195
SHADOW IDENTIFICATION USING ANT COLONY
OPTIMIZATION
1D. USHA NANDINI, 2DR. A. EZIL SAM LENI
1
Research Scholar, Department Of Computer Science and Engineering, Sathyabama University, Chennai,TN, India
2
Professor, epartment of Computer Science and Engineering, SRR Engineering College, Chennai,TN, India
Email: [email protected], [email protected]
ABSTRACT
A novel method has been proposed for the identification of shadows in satellite images. The method is based on the use of Ant Colony Optimization (ACO) for the identification of shadows in remotely sensed images. The existence of shadow regions in images has been a hindrance to image analysis and hence accurate shadow detection and removal is still a current research topic. The proposed work is a combination of the previous techniques and an object based technique. The proposed work first identifies the edges of all the objects in the scene and then each object is analyzed using ant colony optimization to determine whether it is a shadow or a foreground object. The shadow regions are detected in a finite number of steps, considering the various properties of the shadow regions.
Keywords: Ant Colony Optimization (ACO), Edge Detection, Shadow Detection, Shadow Properties,
Threshold.
1.INTRODUCTION
Shadows are present in satellite images, which are interference in the image analysis process as they hide the details of the underlying objects. Shadow detection and removal has been under research for many years, but most of these methods are quite efficient for simple scenes but they fail when it comes to complex scenes. Hence accurate shadow detection is still an ongoing research topic.
Shadows are formed when the light coming from the sun is blocked by an object. There are two types of shadows; they are cast shadow and self shadow. When one object casts its shadow on another object it is called cast shadow, on the other hand, when a part of an object does not receive direct light it appears dark which is called self shadow. The cast shadow can further be divided into two parts; the umbra and the penumbra. The umbra region receives only the diffuse skylight whereas the penumbra region receives part of the direct light from the sun as well as diffuse light. Hence the penumbra appears brighter than the umbra region. In satellite images the differentiation between the umbra and the penumbra is difficult.
2.RELATEDWORK
Shadow detection and removal has become very important in image processing. Satellite images contain shadows of various objects like buildings, trees, clouds, etc., which will hide the information of the underlying objects. The presence of shadows in images has both advantages and disadvantages. The shadows in images help in identifying the size and shape of the building which is useful for urban planning and reconstruction of scenes. Shadows also help to evaluate the size and the shape of buildings. The disadvantage of the presence of shadows is that they hide the information of the concealed objects, result in fake color tones, and distort the object’s shape.
Though research on shadow detection and removal has been going on for more than two decades, high accuracy is still not achieved for complex scenes making it a ongoing research topic. Polidorio proposed a method in which the difference between saturation and intensity is thresholded in the HSI color space [1]. Huang used the Phong illumination model and thresholded the hue and green –blue difference and the blue component [2]. Tsai in his method considered the various color models like HSI, YCbCr, HCV, HSV and YIQ. He thresholded
196 spaces. This method misinterpreted dark objects as shadows [3]. Chung made an improvement to Tsai’s method. He performed global and local thresholding to the invariant color models [4]. Wu and Tang used Bayesian network for shadow detection where inputs are needed from the user and many clues have been used [5]. Tian et.al designed a Tricolour Attenuation Model for detection of shadows in outdoor scenes where the spectral power distributions of daylight and skylight are set [6]. This method does not consider the changes in the spectral power distributions at sunlight and sunset and hence does not produce accurate results for images taken at either sunrise or at sunset. Aliaksei Makarau et.al in the paper Adaptive Shadow detection using the Blackbody Radiator model proposed an algorithm for automatic shadow detection, which approximates the illumination spectra using a black body radiator [7]. Here many assumptions are made and this again fails when complex scenes have been considered. The prevalence of clouds in satellite images has also been a big obstacle to the image analysis process and hence the detection of cloud shadows and removal is still an ongoing modern research. Zhe Zhu et.al in the paper Object based cloud and cloud shadow detection in Land Sat imagery proposed a multistage approach cloud shadow detection [9]. Adrian Fisher in his paper, Cloud and cloud shadow detection in SPOT 5 HRG imagery with Automatic Morphological Feature Extraction detects markers for cloud regions and grows them to get cloud segments. Manual interpretation is needed to eliminate false clouds and false shadows [10]. The various shadow detection techniques have been studied in [13]. Most of these methods produce accurate results for simple scenes, but the accuracy gets reduced as the scene gets complex. Therefore the need for accurate shadow detection is very essential.
3.ANTCOLONYOPTIMIZATION
Ant colony optimization [ACO] is a heuristic algorithm that is widely used to solve optimization problems. This algorithm was developed by Marco Dorigo to find optimal solutions for very complicated problems [11]. ACO is used to repeatedly add solution components to partly found solutions. The algorithm is influenced by the natural behaviour of ants, where the ants though almost blind communicate with each other using a chemical substance called pheromone. The ants in their search for food initially move in a rather random fashion. On their way to find food they deposit a substance
called pheromone. They also deposit pheromone on their way back home. The ants that follow are more likely to follow the path that has more pheromone trail rather than moving in a random fashion, these ants will also deposit pheromone on the path thus making that path more attractive for other ants to follow. Thus the more the ants follow a path the more attractive that path becomes for other ants to follow. Moreover, the ants that take the shorter route will deposit pheromone on their route much faster than the ants that take longer routes; this will increase the probability of other ants to follow this route. Hence over a period of time all the ants will follow the shortest route to the food source, thus leading to an optimal solution [11, 12]. Additionally, the pheromone evaporates over time, thus reducing the probability of finding low quality solutions. This algorithm, though the convergence is slow leads to finding an optimal solution. Many researchers have used ant colony optimization algorithms for different image processing techniques like image segmentation, edge detection, etc. This paper proposes a method for using ant colony optimization technique for shadow segmentation.
4.PROPOSEDMETHOD
The proposed work is a combination of the previous techniques and an object based technique. The proposed work first identifies the edges of all the objects in the scene and then each object is analyzed using ant colony optimization to determine whether it is a shadow or a foreground object. The shadow regions are detected in a finite number of iterations, taking into account the various properties of the shadow regions. The proposed shadow detection technique shown in Fig.1 comprises of the following steps:
• Preprocessing of the image
197
Figure 1: Flowchart Of The Proposed Work
4.1 Preprocessing Of The Image
There are several methods in literature to enhance the input image. In this paper, a high frequency emphasis filtering is done to enhance the image [8]. The image is filtered using a high pass filter and the resultant output is multiplied by an offset value and added with a constant value greater than one. The constant multiplier is used increase the amplitude of the high frequencies thus highlighting the high frequency values. The multiplier has comparatively higher value than the offset.
where, a is the offset and b is the multiplier and a should be much less than b to get good results, a<<b. Histogram equalization is performed on the resulting image to get an enhanced image. This enhanced image is given to the next stage for processing.
4.2 Object Identification
First, edge detection is done on the given input image to identify all the objects in the image. The shadow of the different objects in the image will also be identified as objects in this step which is given as input to the next step.
In this stage, each pixel in the image is considered as a node and K random ants are selected
which move in the image from pixel to pixel to identify the edges of objects [11]. For an image of size M×N, there are M×N nodes for the ants to traverse. Each ant of the K random ants is allowed to traverse the nodes in the image.
A pheromone matrix which is equal to the size of the image is first initialized with an initial pheromone value. A heuristic matrix which is also equal to the size of the image is considered. The heuristic information at each node is calculated using the intensity value at that node. Once the pheromone matrix and the heuristic matrix have been initialised, the ants are allowed to traverse the image to construct the pheromone matrix. The ants move in an eight connected neighbourhood based on the pheromone value in the neighbouring pixel as well as the heuristic information at that node. The heuristic information is influenced by the fact that the intensity value at the edge of the object and that of its background is significant.
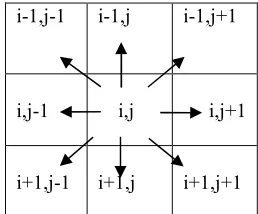
Figure 2: Possible Movement Of Ants In 8-Connected Neighbourhood
The ant will move from node (i,j) to (i,j+1) with a probability which is given by
In the above equation, Ω represents the 8 connected neighbourhood of the possible movement of the ants in the nth iteration. Generally, 4 connected or 8 connected neighbourhoods are considered, here a 8 connected neighbourhood is considered.
is the pheromone value at the node (i,j+1) and Ƞis the heuristic information at the node (i,j+1). α and β are used to control the influence of the variables τ and Ƞ in the equation. When α is high, the ants will (1)
i-1,j-1 i-1,j i-1,j+1
i,j-1 i,j i,j+1
i+1,j-1 i+1,j i+1,j+1
[image:3.612.336.465.349.456.2]198 tend to follow the path with a higher pheromone trail. When β is high the pixel properties have a greater influence on the path selected by an ant.
Each ant will deposit its own pheromone on the path it has taken to complete its tour. This is the local pheromone update given by Q/Lk [1] where Q is a
constant and Lk is the length of the tour of the ant.
Once all the ants have completed a tour, a global pheromone update is done with the tour of the best ant. Pheromone evaporation is also considered in order to avoid finding locally optimal solutions. If there was no pheromone evaporation the paths which were traversed by the first ants tend to be more attractive for the further ants to follow. For ants that take longer tours the time for the pheromone to evaporate is much more, and hence less attractive. For shorter paths, the ants traverse the path more frequently and hence those paths become more attractive.
4.3 Shadow Detection
Once the objects have been identified using ant colony optimization, each object is analyzed to see if it is a shadow object or a foreground object. This is again done using ant colony optimization technique. The heuristic information which is given by Ƞ is modified such that it takes into account the properties of shadows in the image under consideration. The properties of shadows considered here are:
•Shadow regions have lower intensity values than their non shadow regions [3].
•Shadow regions have lower frequency values than their non shadow regions. •The chromaticity value of the shadow
region does not change.
The Ƞ value is a function of these properties. Depending on the type of image we analyze the Ƞ value is modified as the properties of the shadow is different for different types of images like outdoor images, aerial images, satellite images, etc. Here only aerial images have been considered for shadow detection and hence the shadow properties of aerial images have been considered.
The algorithm involved in the shadow object identification is as follows:
Begin
For each object identified do
Initialize the pheromone matrix to a minimal value
Select k random ants
Repeat until all the ants have completed their tour
The next node traversed by the ant is determined by the shadow properties of the neighbouring nodes
Update the pheromone value at each node traversed by the ant
Update the pheromone matrix globally
Determine a threshold value using Otsu’s method
If pheromone value is greater than the threshold
Object is classified as shadow object
Else
Object is classified as a foreground object.
End if
End for.
End.
The local update of the pheromone is done each time an ant goes over a node. This is done by all the K ants, which are considered. A global update of the pheromone is done after all the K ants have completed a tour. The tours of all the ants are analyzed and the tour of the best ant is considered for the update. The threshold value used in the above algorithm is obtained by the Otsu’s method [14]. Depending upon the threshold value, the objects are categorized into shadow objects and non shadow objects.
5.EXPERIMENTALPART
Aerial images have been taken for testing the proposed method. The values of the various parameters are fixed to produce favorable results. The values taken for the various parameters are:
K - 300 ants. Ʈinit – 0.1
q0 – 0.4
199
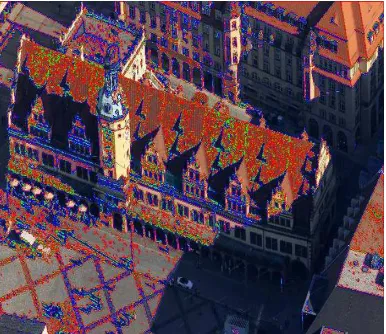
[image:5.612.284.519.69.251.2]Figure 3: Original Image
Figure 4: Intensity Profile Of The Image
Figure 5: Objects Identified In The Image
Figure 6: Shadows Identified By The Proposed Method
Figure 3 shows an aerial image containing shadows, figure 5 shows the image where the different objects are identified and figure 6 shows the binary image where the black regions depict the shadow regions. Accuracy was found to be comparatively better than the previous algorithms for urban aerial images.
6. CONCLUSION
[image:5.612.89.284.312.481.2] [image:5.612.91.284.526.693.2]200
REFERENCES:
[1] A.A.Polidorio, F.C.Flores, N.N.Imai, A.M.Tomaselli, C.Franco, Automatic Shadow Segmentation in Aerial Images, Proc. Brazilian Symposium on Computer Graphics and Image Processing, 2003, pp. 270-277.
[2] J.Huang, W.Xie and L.Tang, Detection of and Compensation for Shadows in Colored Urban Aerial Images, Proc. 5th World Congress Intelligent Control and Automation, Hangzhou, China, Jun. 15-19, 2004, pp. 3098-3100.
[3] V.J.D.Tsai, A Comparative Study on Shadow Compensation of Color Aerial Images in Invariant Color Models, IEEE Transactions on Geoscience and Remote Sensing, vol. 44, no. 6, pp. 1661-1671, June 2006.
[4] K.L.Chung, Y.R.Lin, Y.H.Huang, Efficient Shadow Detection of Color Aerial Images Based Successive Thresholding Scheme, IEEE Transactions on Geoscience and Remote Sensing, pp. 671-682, 2009.
[5]T.P.Wu and C.K.Tang, A Bayesian Approach for Shadow Extraction from a Single Image, Proc. IEEE International on Computer Vision, pp. 480-487, Oct. 2005.
[6] J.Tian, J.Sun and Y.Tang, Tricolor Attenuation Model for Shadow Detection, IEEE Transactions on Image Processing, vol. 18, no. 10, pp. 2355-2363, Oct. 2009.
[7] Aliaksei Makarau, Rudolf Ritcher, Rupert Muller and Peter Reinartz, Adaptive Shadow Detection Using Black Body Radiator Model , IEEE Transactions on Geoscience and Remote Sensing, vol.49, no.6, Jan. 2011.
[8] R.C.Gonzalez, Tiger Woods, Digital Image Processing, Reading M.A.Addison Wesley, 1992.
[9] Zhe Zhu, Curtis E. Woodcock, Object-based Cloud and Cloud shadow Detection in Landsat Imagery, Remote Sensing of Environment, vol. 118, pp. 83-94, March 2012.
[10] Adrian Fisher, Cloud Shadow Detection in SPOT5 HRG Imagery with Automated Morphological Feature Extraction, Remote Sensing, pp. 776-800, June 2014.
[11] M.Dorigo, V.Maniezzo, A.Colorni “Ant System: Optimization by a Colony of Cooperating Agents”, Man and Cybernetics, vol.26, pp. 29-41,1996.
[12] M.Dorigo, L.M.Gambardella, “Ant Colony System: A Cooperative Learning Approach to the Travelling Salesman Problem”, IEEE Transactions on Evolutionary Computation, vol. 1, pp. 53-66, 1997.
[13] D.Usha Nandini, Dr.Ezil Sam Leni, “A Survey of the Existing Shadow Detection Techniques”, in Proc. ICCICCT, Kanyakumari, India, 10-11, July 2014, pp.175-177.