WRL
Research Report 95/4
The Case for
Persistent-Connection
HTTP
research relevant to the design and application of high performance scientific computers. We test our ideas by designing, building, and using real systems. The systems we build are research prototypes; they are not intended to become products.
There are two other research laboratories located in Palo Alto, the Network Systems Lab (NSL) and the Systems Research Center (SRC). Another Digital research group is located in Cambridge, Massachusetts (CRL).
Our research is directed towards mainstream high-performance computer systems. Our prototypes are intended to foreshadow the future computing environments used by many Digital customers. The long-term goal of WRL is to aid and accelerate the development of high-performance uni- and multi-processors. The research projects within WRL will address various aspects of high-performance computing.
We believe that significant advances in computer systems do not come from any single technological advance. Technologies, both hardware and software, do not all advance at the same pace. System design is the art of composing systems which use each level of technology in an appropriate balance. A major advance in overall system performance will require reexamination of all aspects of the system.
We do work in the design, fabrication and packaging of hardware; language processing and scaling issues in system software design; and the exploration of new applications areas that are opening up with the advent of higher performance systems. Researchers at WRL cooperate closely and move freely among the various levels of system design. This allows us to explore a wide range of tradeoffs to meet system goals.
We publish the results of our work in a variety of journals, conferences, research reports, and technical notes. This document is a research report. Research reports are normally accounts of completed research and may include material from earlier technical notes. We use technical notes for rapid distribution of technical material; usually this represents research in progress.
Research reports and technical notes may be ordered from us. You may mail your order to:
Technical Report Distribution
DEC Western Research Laboratory, WRL-2 250 University Avenue
Palo Alto, California 94301 USA
Reports and technical notes may also be ordered by electronic mail. Use one of the fol-lowing addresses:
Digital E-net: JOVE::WRL-TECHREPORTS
Internet: [email protected]
UUCP: decpa!wrl-techreports
To obtain more details on ordering by electronic mail, send a message to one of these addresses with the word ‘‘help’’ in the Subject line; you will receive detailed instruc-tions.
Reports and technical notes may also be accessed via the World Wide Web:
Jeffrey C. Mogul
May, 1995
Abstract
The success of the World-Wide Web is largely due to the simplicity, hence ease of implementation, of the Hypertext Transfer Protocol (HTTP). HTTP, however, makes inefficient use of network and server resources, and adds unnecessary latencies, by creating a new TCP connection for each request. Modifications to HTTP have been proposed that would transport multiple requests over each TCP connection. These modifications have led to debate over their actual impact on users, on servers, and on the network. This paper reports the results of log-driven simulations of several variants of the proposed modifications, which demonstrate the value of persistent connec-tions.
This Research Report is an expanded version of a paper to appear in the Proceedings of the
SIGCOMM ’95 Conference on Communications Architectures and Protocols.
Permission to copy without fee all or part of this material is granted provided that the copies are not made or distributed for direct commercial advantage, the ACM copyright notice and the title of the publication and its date appear, and notice is given that copying is by permission of the Association for Computing Machinery. To copy otherwise, or to republish, requires a fee and/or specific permission.
2. Overview of the HTTP protocol 1
3. Analysis of HTTP’s inefficiencies 2
3.1. Other inefficiencies 3
4. Proposed HTTP modifications 4
4.1. Protocol negotiation 5
4.2. Implementation status 6
5. Design issues 6
5.1. Effects on reliability 6
5.2. Interactions with current proxy servers 7
5.3. Connection lifetimes 9
5.4. Server resource utilization 9
5.5. Server congestion control 10
5.6. Network resources 10
5.7. User’s perceived performance 11
6. Competing and complementary approaches 11
7. Simulation experiment design 12
7.1. Trace data sets 13
7.2. Simulator overview 15
7.3. Summary of simulation parameters 16
7.4. Validation 17
8. Simulation results 18
8.1. Connection refusal rates 18
8.2. Connection re-use rates 19
8.3. The effect of a Web indexer 22
8.4. Success rates viewed by client 25
8.5. Frequency of forced closes 26
8.6. PCB table use 27
8.7. Adaptive timeouts 28
8.8. Network loading 29
9. Related work 30
10. Future work 30
11. Summary and conclusions 31
Acknowledgements 32
Figure 2: Packet exchanges and round-trip times for a P-HTTP interaction 5 Figure 3: Situation with a potential for temporary deadlock 8
Figure 4: Cumulative distribution of retrieval sizes 14
Figure 5: Cumulative distribution of connection durations 14 Figure 6: HTTP request interarrival times, as seen by server 14 Figure 7: Comparison of simulated and actual PCB states (election service) 17 Figure 8: Effect of varying 2*MSL timer on number of TIME_WAIT entries 18 Figure 9: Requests refused due to too many simultaneous connections 19 Figure 10: Number of requests arriving for already-open connections (Election 20
service)
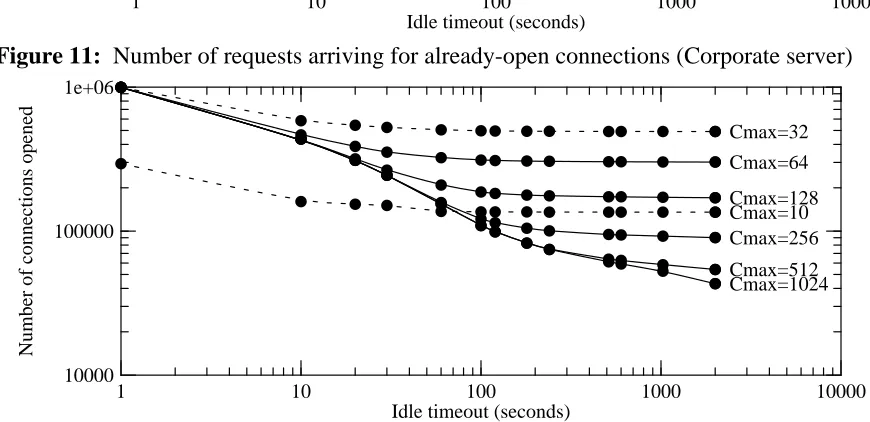
Figure 11: Number of requests arriving for already-open connections (Cor- 20 porate server)
Figure 12: Number of TCP connections opened (Election service) 20 Figure 13: Mean number of HTTP requests per TCP connection (Election ser- 21
vice)
Figure 14: Standard deviations of requests/connection (Election service) 21 Figure 15: Maximum number of requests/connection (Election service) 21 Figure 16: Cumulative number of requests/connection (Election service) 22 Figure 17: Mean number of HTTP requests per TCP connection (Corporate 23
server)
Figure 18: Standard deviations of requests/connection (Corporate server) 23 Figure 19: Maximum number of requests/connection (Corporate server) 23 Figure 20: Cumulative number of requests/connection (Corporate server) 24 Figure 21: Mean number of requests per connection (Corporate server, no in- 24
dexer)
Figure 22: Standard deviations of requests/connection (Corporate server, no in- 24 dexer)
Figure 23: Maximum number of requests/connection (Corporate server, no in- 25 dexer)
Figure 24: Distribution of best-case requests/connection (Election service) 25 Figure 25: Distribution of best-case requests/connection (Corporate server) 26 Figure 26: Number of forced closes of TCP connections (Election service) 26 Figure 27: Number of forced closes of TCP connections (Corporate server) 27 Figure 28: Maximum number of TIME_WAIT entries in PCB table (Election 28
service)
Figure 29: Maximum number of TIME_WAIT entries in PCB table (Corporate 28 server)
Figure 30: Effect of adaptive timeouts on open-connection hits (Election service) 29 Figure 31: Effect of adaptive timeouts on open-connection hits (Corporate serv- 29
People use the World Wide Web because it gives quick and easy access to a tremendous variety of information in remote locations. Users do not like to wait for their results; they tend to avoid or complain about Web pages that take a long time to retrieve. Users care about Web latency.
Perceived latency comes from several sources. Web servers can take a long time to process a request, especially if they are overloaded or have slow disks. Web clients can add delay if they do not quickly parse the retrieved data and display it for the user. Latency caused by client or server slowness can in principle be solved simply by buying a faster computer, or faster disks, or more memory.
The main contributor to Web latency, however, is network communication. The Web is useful precisely because it provides remote access, and transmission of data across a distance takes time. Some of this delay depends on bandwidth; you can reduce this delay by buying a higher-bandwidth link. But much of the latency seen by Web users comes from propagation delay, and you cannot improve propagation delay (past a certain point) no matter how much money you have. While caching can help, many Web access are ‘‘compulsory misses.’’
If we cannot increase the speed of light, we should at least minimize the number of network round-trips required for an interaction. The Hypertext Transfer Protocol (HTTP) [3], as it is currently used in the Web, incurs many more round trips than necessary (see section 2).
Several researchers have proposed modifying HTTP to eliminate unnecessary network round-trips [21, 27]. Some people have questioned the impact of these proposals on network, server, and client performance. This paper reports on simulation experiments, driven by traces collected from an extremely busy Web server, that support the proposed HTTP modifications. According to these simulations, the modifications will improve user’s perceived performance, network loading, and server resource utilization.
The paper begins with an overview of HTTP (section 2) and an analysis of its flaws (section 3). Section 4 describes the proposed HTTP modifications, and section 5 describes some of the potential design issues of the modified protocol. Section 7 describes the design of the simulation experiments, and section 8 describes the results.
2. Overview of the HTTP protocol
The HTTP protocol [1, 3] is layered over a reliable bidirectional byte stream, normally TCP [23]. Each HTTP interaction consists of a request sent from the client to the server, fol-lowed by a response sent from the server to the client. Request and response parameters are expressed in a simple ASCII format (although HTTP may convey non-ASCII data).
The server parses the request, and takes action according to the specified method. It then sends a response to the client, including (1) a status code to indicate if the request succeeded, or if not, why not; (2) a set of object headers, meta-information about the ‘‘object’’ returned by the server; and (3) a Data field, containing the file requested, or the output generated by a server-side script.
URLs may refer to numerous document types, but the primary format is the Hypertext Markup Language (HTML) [2]. HTML supports the use of hyperlinks (links to other documents). HTML also supports the use of inlined images, URLs referring to digitized images (usually in the Graphics Interchange Format (GIF) [7] or JPEG format), which should be displayed along with the text of the HTML file by the user’s browser. For example, if an HTML page includes a corporate logo and a photograph of the company’s president, this would be encoded as two in-lined images. The browser would therefore make three HTTP requests to retrieve the HTML page and the two images.
3. Analysis of HTTP’s inefficiencies
I now analyze the way that the interaction between HTTP clients and servers appears on the network, with emphasis on how this affects latency.
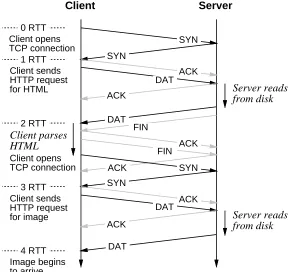
Figure 1 depicts the exchanges at the beginning of a typical interaction, the retrieval of an HTML document with at least one uncached inlined image. In this figure, time runs down the page, and long diagonal arrows show packets sent from client to server or vice versa. These arrows are marked with TCP packet types; note that most of the packets carry acknowledge-ments, but the packets marked ACK carry only an acknowledgement and no new data. FIN and SYN packets in this example never carry data, although in principle they sometimes could.
Shorter, vertical arrows show local delays at either client or server; the causes of these delays are given in italics. Other client actions are shown in roman type, to the left of the Client timeline.
Also to the left of the Client timeline, horizontal dotted lines show the ‘‘mandatory’’ round trip times (RTTs) through the network, imposed by the combination of the HTTP and TCP protocols. These mandatory round-trips result from the dependencies between various packet exchanges, marked with solid arrows. The packets shown with gray arrows are required by the TCP protocol, but do not directly affect latency because the receiver is not required to wait for them before proceeding with other activity.
The mandatory round trips are:
1. The client opens the TCP connection, resulting in an exchange of SYN packets as part of TCP’s three-way handshake procedure.
SYN SYN ACK DAT ACK DAT FIN ACK FIN ACK SYN SYN ACK DAT DAT Client Server Server reads from disk Server reads from disk 0 RTT 1 RTT 2 RTT 3 RTT 4 RTT Client opens TCP connection Client sends HTTP request for HTML Client parses HTML Client opens TCP connection Client sends HTTP request for image Image begins to arrive ACK
Figure 1: Packet exchanges and round-trip times for HTTP
3. After parsing the returned HTML document to extract the URLs for inlined images, the client opens a new TCP connection to the server, resulting in another exchange of SYN packets.
4. The client again transmits an HTTP request, this time for the first inlined image. The server obtains the image file, and starts transmitting it to the client.
Therefore, the earliest time at which the client could start displaying the first inlined image would be four network round-trip times after the user requested the document. Each additional inlined image requires at least two further round trips. In practice, for documents larger than can fit into a small number of packets, additional delays will be encountered.
3.1. Other inefficiencies
In addition to requiring at least two network round trips per document or inlined image, the HTTP protocol as currently used has other inefficiencies.
Because the client sets up a new TCP connection for each HTTP request, there are costs in addition to network latencies:
•Connection setup requires a certain amount of processing overhead at both the
serv-er and the client. This typically includes allocating new port numbserv-ers and resources, and creating the appropriate data structures. Connection teardown also requires some processing time, although perhaps not as much.
•The TCP connections may be active for only a few seconds, but the TCP
per-connection information for four minutes [23] (Many implementations violate this specification and use a much shorter timer.) A busy server could end up with its tables full of connections in this ‘‘TIME_WAIT’’ state, either leaving no room for new connections, or perhaps imposing excessive connection table management costs.
Current HTTP practice also means that most of these TCP connections carry only a few thousand bytes of data. I looked at retrieval size distributions for two different servers. In one, the mean size of 200,000 retrievals was 12,925 bytes, with a median of 1,770 bytes (ignoring 12,727 zero-length retrievals, the mean was 13,767 bytes and the median was 1,946 bytes). In the other, the mean of 1,491,876 retrievals was 2,394 bytes and the median 958 bytes (ignoring 83,406 zero-length retrievals, the mean was 2,535 bytes, the median 1,025 bytes). In the first sample, 45% of the retrievals were for GIF files; the second sample included more than 70% GIF files. The increasing use of JPEG images will tend to reduce image sizes.
TCP does not fully utilize the available network bandwidth for the first few round-trips of a connection. This is because modern TCP implementations use a technique called slow-start [13] to avoid network congestion. The slow-start approach requires the TCP sender to open its ‘‘con-gestion window’’ gradually, doubling the number of packets each round-trip time. TCP does not reach full throughput until the effective window size is at least the product of the round-trip delay and the available network bandwidth. This means that slow-start restricts TCP throughput, which is good for congestion avoidance but bad for short-connection completion latency. A long-distance TCP connection may have to transfer tens of thousands of bytes before achieving full bandwidth.
4. Proposed HTTP modifications
The simplest change proposed for the HTTP protocol is to use one TCP connection for mul-tiple requests. These requests could be for both inlined images and independent Web pages. A client would open an HTTP connection to a server, and then send requests along this connection whenever it wishes. The server would send responses in the opposite direction.
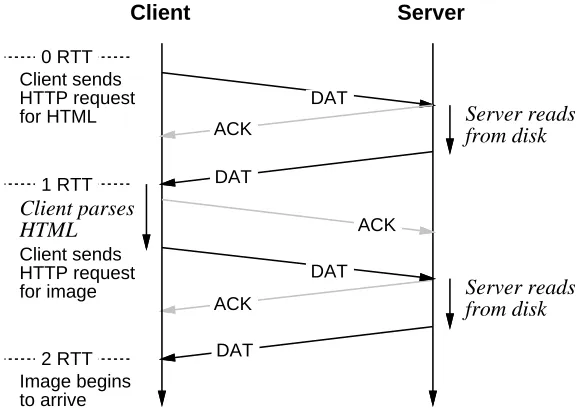
This ‘‘persistent-connection’’ HTTP (P-HTTP) avoids most of the unnecessary round trips in the current HTTP protocol. For example, once a client has retrieved an HTML file, it may generate requests for all the inlined images and send them along the already-open TCP connec-tion, without waiting for a new connection establishment handshake, and without first waiting for the responses to any of the individual requests. We call this ‘‘pipelining.’’ Figure 2 shows the timeline for a simple, non-pipelined example.
HTTP allows the server to mark the end of a response in one of several ways, including simply closing the connection. In P-HTTP, the server would use one of the other mechanisms, either sending a ‘‘Content-length’’ header before the data, or transmitting a special delimiter after the data.
DAT ACK
DAT
ACK DAT DAT
Client Server
Server reads from disk
Server reads from disk
0 RTT
1 RTT
2 RTT Client sends HTTP request for HTML
Client parses HTML
Client sends HTTP request for image Image begins to arrive
[image:13.612.179.470.75.280.2]ACK
Figure 2: Packet exchanges and round-trip times for a P-HTTP interaction
servers. A client might also be ‘‘helpful’’ and close its connections after a long idle period. A client would not close a TCP connection while an HTTP request is in progress, unless the user gets bored with a slow server.
A server, however, cannot easily control the number of clients that may want to use it. There-fore, servers may have to close idle TCP connections to maintain sufficient resources for processing new requests. For example, a server may run out of TCP connection descriptors, or may run out of processes or threads for managing individual connections. When this happens, a server would close one or more idle TCP connections. One might expect a ‘‘least-recently used’’ (LRU) policy to work well. A server might also close connections that have been idle for more than a given ‘‘idle timeout,’’ in order to maintain a pool of available resources.
A server would not close a connection in the middle of processing an HTTP request. However, a request may have been transmitted by the client but not yet received when the server decides to close the connection. Or, the server may decide that the client has failed, and time out a connection with a request in progress. In any event, clients must be prepared for TCP connec-tions to disappear at arbitrary times, and must be able to re-establish the connection and retry the HTTP request. A prematurely closed connection should not be treated as an error; an error would only be signalled if the attempt to re-establish the connection fails.
4.1. Protocol negotiation
We would also like current-HTTP servers to be usable by P-HTTP clients. One could define the modified HTTP so that when a HTTP client contacts a server, it first attempts to use P-HTTP protocol; if that fails, it then falls back on the current P-HTTP protocol. This adds an extra network round-trip, and seems wasteful.
P-HTTP clients instead can use an existing HTTP design feature that requires a server to ig-nore HTRQ fields it does not understand. A client would send its first HTTP request using one of these fields to indicate that it speaks the P-HTTP protocol. A current-HTTP server would simply ignore this field and close the TCP connection after responding. A P-HTTP server would instead leave the connection open, and indicate in its reply headers that it speaks the modified protocol.
4.2. Implementation status
We have already published a study of an experimental implementation of the P-HTTP protocol [21]. In that paper, we showed that P-HTTP required only minor modifications to exist-ing client and server software and that the negotiation mechanism worked effectively. The modified protocol yielded significantly lower retrieval latencies than HTTP, over both WAN and LAN networks. Since this implementation has not yet been widely adopted, however, we were unable to determine how its large-scale use would affect server and network loading.
5. Design issues
A number of concerns have been raised regarding P-HTTP. Some relate to the feasibility of the proposal; others simply reflect the need to choose parameters appropriately. Many of these issues were raised in electronic mail by members of the IETF working group on HTTP; these messages are available in an archive [12].
The first two issues discussed in this section relate to the correctness of the modified protocol; the rest address its performance.
5.1. Effects on reliability
Several reviewers have mistakenly suggested that allowing the server to close TCP connec-tions at will could impair reliability. The proposed protocol does not allow the server to close connections arbitrarily; a connection may only be closed after the server has finished responding to one request and before it has begun to act on a subsequent request. Because the act of closing a TCP connection is serialized with the transmission of any data by server, the client is guaranteed to receive any response sent before the server closes the connection.
A race may occur between the client’s transmission of a new request, and the server’s termina-tion of the TCP connectermina-tion. In this case, the client will see the connectermina-tion closed without receiv-ing a response. Therefore, the client will be fully aware that the transmitted request was not received, and can simply re-open the connection and retransmit the request.
Regardless of the protocol used, a server crash during the execution of a non-idempotent operation could potentially cause an inconsistency. The cure for this is not to complicate the network protocol, but rather to insist that the server commit such operations to stable storage before responding. The NFS specification [26] imposes the same requirement.
5.2. Interactions with current proxy servers
Many users reach the Web via ‘‘proxy’’ servers (or ‘‘relays’’). A proxy server accepts HTTP requests for any URL, parses the URL to determine the actual server for that URL, makes an HTTP request to that server, obtains the reply, and returns the reply to the original client. This technique is used to transit ‘‘firewall’’ security barriers, and may also be used to provide central-ized caching for a community of users [6, 11, 22].
Section 4.1 described a technique that allows P-HTTP systems to interoperate with HTTP sys-tems, without adding extra round-trips. What happens to this scheme if both the client and serv-er implement P-HTTP, but a proxy between them implements HTTP [28]? The sserv-ervserv-er believes that the client wants it to hold the TCP connection open, but the proxy expects the server to terminate the reply by closing the connection. Because the negotiation between client and server is done using HTRQ fields that existing proxies must ignore, the proxy cannot know what is going on. The proxy will wait ‘‘forever’’ (probably many minutes) and the user will not be happy.
P-HTTP servers could solve this problem by using an ‘‘adaptive timeout’’ scheme, in which the server observes client behavior to discover which clients are safely able to use P-HTTP. The server would keep a list of client IP addresses; each entry would also contain an ‘‘idle timeout’’ value, initially set to a small value (such as one second). If a client requests the use of P-HTTP, the server would hold the connection open, but only for the duration of the per-client idle timeout. If a client ever transmits a second request on the same TCP connection, the server would increase the associated idle timeout from the default value to a maximum value.
Thus, a P-HTTP client reaching the server through an HTTP-only proxy would encounter
1-1
second additional delays , and would never see a reply to a second request transmitted on a given TCP connection. The client could use this lack of a second reply to realize that an HTTP-only proxy is in use, and subsequently the client would not attempt to negotiate use of P-HTTP with this server.
A P-HTTP client, whether it reaches the server through a P-HTTP proxy or not, might see the TCP connection closed ‘‘too soon,’’ but if it ever makes multiple requests in a brief interval, the server’s timeout would increase and the client would gain the full benefit of P-HTTP.
The simulation results in section 8 suggest that this approach should yield most of the benefit of P-HTTP. It may fail in actual use, however; for example, some HTTP-only proxies may forward multiple requests received on a single connection, without being able to return multiple
1If the proxy forwards response data as soon as it is ‘‘pushed’’ by the server, then the user would not actually
replies. This would trick the server into holding the connection open, but would prevent the client from receiving all the replies.
5.2.1. Possibility of proxy deadlock
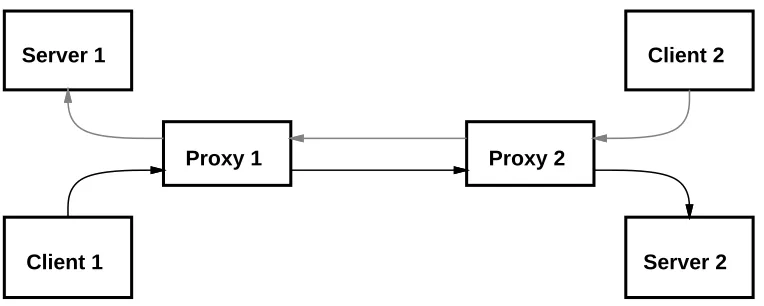
Some people have suggested that the use of persistent connections may increase the prob-ability of a deadlock between two or more proxies with overcommitted resources. This potential deadlock arises in the situation depicted in figure 3, which has several unusual (but not impos-sible) features:
•More than one proxy is used on the path between a client and a server.
•The proxies are used to relay in both directions; that is, each member of a set of
proxies acts as both client and server with respect to other proxies.
Server 1 Client 2
Proxy 1 Proxy 2
[image:16.612.99.481.245.398.2]Client 1 Server 2
Figure 3: Situation with a potential for temporary deadlock
A deadlock could arise when both of the proxies in figure 3, or more generally each member of a cycle of proxies, has filled its quota of active TCP connections by accepting a connection from a client, and still needs to make a connection to the other in order to fulfill one of the pending requests from its clients. For example, suppose that each proxy in the figure can handle at most two TCP connections, and that they have each acccepted connections connections from their immediate clients. This leaves neither proxy with the resources to establish a connection to the other.
In order for an actual deadlock to occur, several additional conditions must exist. First, nei-ther of the clients will asynchronously abort its connection (although a frustrated user might be expected to do this). Second, when one proxy fails to establish a connection to the other, it must wait (or continuously retry the connection attempt) instead of signalling failure. Existing proxies do not retry failed connection attempts, but immediately report them to their clients. If the specification for persistent-connection HTTP requires proxies not to retry failed TCP connec-tions, this should avoid deadlock.
5.3. Connection lifetimes
One obvious question is whether the servers would have too many open connections in the persistent-connection model. The glib answer is ‘‘no, because a server could close an idle con-nection at any time’’ and so would not necessarily have more concon-nections open than in the cur-rent model. This answer evades the somewhat harder question of whether a connection would live long enough to carry significantly more than one HTTP request, or whether the servers would be closing connections almost as fast as they do now.
Intuition suggests that locality of reference will make this work. That is, clients tend to send a number of requests to a server in relatively quick succession, and as long as the total number of clients simultaneously using a server is ‘‘small,’’ the connections should be useful for multiple HTTP requests. The simulations (see section 8) support this.
5.4. Server resource utilization
HTTP servers consume several kinds of resources, including CPU time, active connections (and associated threads or processes), and protocol control block (PCB) table space (for both open and TIME_WAIT connections). How would the persistent-connection model affect resource utilization?
If an average TCP connection carries more than one successful HTTP transaction, one would expect this to reduce server CPU time requirements. The time spent actually processing requests would probably not change, but the time spent opening and closing connections, and launching new threads or processes, would be reduced. For example, some HTTP servers create a new process for each connection. Measurements suggest that the cost of process creation accounts for a significant fraction of the total CPU time, and so persistent connections should avoid much of this cost.
Because we expect a P-HTTP server to close idle connections as needed, a busy server (one on which idle connections never last long enough to be closed by the idle timeout mechanism) will use up as many connections as the configuration allows. Therefore, the maximum number of open connections (and threads or processes) is a parameter to be set, rather than a statistic to be measured.
The choice of the idle timeout parameter (that is, how long an idle TCP connection should be allowed to exist) does not affect server performance under heavy load from many clients. It can affect server resource usage if the number of active clients is smaller than the maximum-connection parameter. This may be important if the server has other functions besides HTTP service, or if the memory used for connections and processes could be applied to better uses, such as file caching.
persistent-connection model, with a mean of ten HTTP requests per active connection, the PCB table would contain only 2400 TIME_WAIT entries.
PCB tables may be organized in a number of different ways [16]. Depending on the data structures chosen, the huge number of TIME_WAIT entries may or may not affect the cost of looking up a PCB-table entry, which must be done once for each received TCP packet. Many existing systems derived from 4.2BSD use a linear-list PCB table [15], and so could perform quite badly under a heavy connection rate. In any case, PCB entries consume storage.
The simulation results in section 8 show that persistent-connection HTTP significantly reduces the number of PCB table entries required.
5.5. Server congestion control
An HTTP client has little information about how busy any given server might be. This means that an overloaded HTTP server can be bombarded with requests that it cannot immediately handle, leading to even greater overload and congestive collapse. (A similar problem afflicts naive implementations of NFS [14].) The server could cause the clients to slow down, some-what, by accepting their TCP connections but not immediately processing the associated re-quests. This might require the server to maintain a very large number of TCP connections in the ESTABLISHED state (especially if clients attempt to use several TCP connections at once; see section 6).
Once a P-HTTP client has established a TCP connection, however, the server can automati-cally benefit from TCP’s flow-control mechanisms, which prevent the client from sending re-quests faster than the server can process them. So while P-HTTP cannot limit the rate at which new clients attack an overloaded server, it does limit the rate at which any given client can make requests. The simulation results presented in section 8, which imply that even very busy HTTP servers see only a small number of distinct clients during any brief interval, suggest that controll-ing the per-client arrival rate should largely solve the server congestion problem.
5.6. Network resources
HTTP interactions consume network resources. Most obviously, HTTP consumes bandwidth, but IP also imposes per-packet costs on the network, and may include per-connection costs (e.g., for firewall decision-making). How would a shift to P-HTTP change consumption patterns?
The expected reduction in the number of TCP connections established would certainly reduce the number of ‘‘overhead’’ packets, and would presumably reduce the total number of packets transmitted. The reduction in header traffic may also reduce the bandwidth load on low-bandwidth links, but would probably be insignificant for high-low-bandwidth links.
At the same time, a shift to longer TCP connections (hence larger congestion windows) and more rapid server responses will increase short-term bandwidth requirements, compared to cur-rent HTTP usage. In the curcur-rent HTTP, requests are spaced several round-trip times apart; in P-HTTP, many requests and replies could be streamed at full network bandwidth. This may affect the behavior of the network.
5.7. User’s perceived performance
The ultimate measure of the success of a modified HTTP is its effect on the user’s perceived performance (UPP). Broadly, this can be expressed as the time required to retrieve and display a series of Web pages. This differs from simple retrieval latency, since it includes the cost of rendering text and images. A design that minimizes mean retrieval latency may not necessarily yield the best UPP.
For example, if a document contains both text and several inlined images, it may be possible to render the text before fully retrieving all of the images, if the user agent can discover the image ‘‘bounding boxes’’ early enough. Doing so may allow the user to start reading the text before the complete images arrive (especially if some of the images are initially off-screen). Thus, the order in which the client receives information from the server can affect UPP.
Human factors researchers have shown that users of interactive systems prefer response times below two to four seconds [25]; delays of this magnitude cause their attention to wander. Two seconds represents just 28 cross-U.S. round-trips, at the best-case RTT of about 70 msec.
Users may also be quite sensitive to high variance in UPP. Generally, users desire predictable performance [17]. That is, a user may prefer a system with a moderately high mean retrieval time and low variance, to one with lower mean retrieval time but a much higher variance. Since congestion or packet loss can increase the effective RTT to hundreds or thousands of mil-liseconds, this leaves HTTP very few round-trips to spare.
6. Competing and complementary approaches
Persistent-connection HTTP is not the only possible solution to the latency problem. The
NetScape browser takes a different approach, using the existing HTTP protocol but often
open-ing multiple connections in parallel. For example, if an HTML file includes ten inlined images,
NetScape opens an HTTP connection to retrieve the HTML file, then might open ten more
con-nections in parallel, to retrieve the ten image files. By parallelizing the TCP connection over-heads, this approach eliminates a lot of the unnecessary latency, without requiring implemen-tation of a new protocol.
The multi-connection approach has several drawbacks. First, it seems to increase the chances for network congestion; apparently for this reason, NetScape limits the number of parallel con-nections (a user-specifiable limit, defaulting to four). Several parallel TCP concon-nections are more likely to self-congest than one connection.
series, NetScape must pay this cost for every HTML file, and for every group of parallel image retrievals.
The multi-connection approach sometimes allows NetScape to render the text surrounding at least the first N images (where N is the number of parallel connections) before much of the im-age data arrives. Some imim-age formats include bounding-box information at the head of the file;
NetScape can use this to render the text long before the entire images are available, thus
improv-ing UPP.
This is not the only way to discover image sizes early in the retrieval process. For example, P-HTTP could include a new method allowing the client to request a set of image bounding boxes before requesting the images. Or, the HTML format could be modified to include optional image-size information (as has been proposed for HTML version 3.0 [24]). Either alternative could provide the bounding-box information even sooner than the multi-connection approach. All such proposals have advantages and disadvantages, and are the subject of continuing debate in the IETF working group on HTTP.
Several people have suggested using Transaction TCP (T/TCP) [4, 5] to eliminate the delay associated with TCP’s three-way handshake. T/TCP also reduces the number of TIME_WAIT entries by shortening the duration of the TIME_WAIT state. Therefore, T/TCP solves some of the same problems solved by P-HTTP. The use of T/TCP with unmodified HTTP (that is, one HTTP request per T/TCP connection) does not reduce the number of times that the client and server must modify their connection databases, nor does it support pipelining. Most important, T/TCP is still an ‘‘experimental’’ protocol and will not be widely implemented for many years. P-HTTP could be deployed immediately, using the existing enormous installed base of TCP im-plementations. If T/TCP becomes widely deployed, it should be possible to layer P-HTTP over T/TCP instead of TCP, but this change probably will not yield significant benefits.
Since P-HTTP does not change the basic nature of HTTP’s mechanisms for communicating request and response information, it should be fully compatible with most of the proposed exten-sions to HTTP. For example, the Secure HyperText Transfer Protocol (SHTTP) [10] should work just as well with persistent connections, although we have not tested this.
7. Simulation experiment design
In order to answer some of the open questions about the performance of P-HTTP, I decided to simulate the behavior of a P-HTTP server using input streams taken from the logs of actual HTTP servers. This allowed me to explore the effect of various parameter combinations and policies. The use of actual event streams, rather than a synthetic load, should produce realistic results.
The specific open questions addressed by these simulations include:
•Do clients display sufficient locality of reference to allow each connection to carry
several HTTP requests (see section 5.3)?
•Does P-HTTP reduce server resource utilization (see section 5.4)?
•Does the adaptive timeout mechanism, proposed in section 5.2 to deal with
The simulations were also designed to investigate how the values of several parameters, includ-ing table sizes and timeout durations, would affect performance.
The systems from which the logs were taken use the NCSA httpd server, version 1.3, with minor modifications to improve performance. Since this program generates a log without con-nection durations or fine-grained timestamps, I modified the server to generate an additional log file with the information necessary to drive the simulations. The new log includes a connection completion timestamp and the connection duration of each request. All timing information was done with a resolution of about 1 msec.
7.1. Trace data sets
I used logs from two different servers to drive the simulations. One data set came from the 1994 California Election service, and includes over 1.6 million HTTP requests in a ten-day period; the busiest 24-hour period includes almost 1 million requests. The other data set came from a large corporation’s public Web site, and includes 3.4 million HTTP requests over ap-proximately 82 days.
The election service was actually implemented as a set of three individual servers that shared a single alias in the host name space. Clients tended to load-share among the three servers. The corporate server is a single computer.
Although both data sets come from relatively busy servers, they differ in several ways. The election service was used quite intensively over just a few days. The corporate web site encoun-tered far lower peak loads. The election service saw 24,000 distinct client addresses; the cor-porate server saw 134,000 clients.
Some of these client addresses represent intermediate proxies, and so aggregate requests from many different users. This should not affect the simulation, since one would see this aggregation with either HTTP or P-HTTP.
Since the two services provide different kinds of information, they saw somewhat different access patterns. Figure 4 shows the cumulative distribution of retrieval sizes (the number of bytes returned by the server for each request). The election service returned many files shorter than 100 bytes, while the corporate server provided mostly files longer than 1000 bytes.
The majority of retrievals from both servers took less than 1 second (see figure 5). However, the corporate server saw a somewhat larger fraction that took between 1 and 10 seconds. The retrievals with very short durations were made by nearby clients or proxies.
10 100 1000 10000 100000 1e+06 0
3.5e+06
500000 1e+06 1.5e+06 2e+06 2.5e+06 3e+06
Cumulative number of retrievals
[image:22.612.84.517.55.613.2]Election server Corporate server
Figure 4: Cumulative distribution of retrieval sizes
0.01 10000
Elapsed time (sec)
0.1 1 10 100 1000 10000
0 3.5e+06
500000 1e+06 1.5e+06 2e+06 2.5e+06 3e+06
Cumulative number of retrievals
Election server Corporate server
Figure 5: Cumulative distribution of connection durations
0.1 1e+06
Request interarrival time in msec
1 10 100 1000 10000 100000
1 1e+06
Number of events
10 100 1000 10000 100000
Election servers
Corporate server
7.1.1. Limitations of the traces used
Traces taken from just two HTTP servers clearly do not necessarily capture the full range of possible behavior. It may be that other servers see much less (or much more) locality of refer-ence, or that as the client population scales up, the ‘‘working set’’ of simultaneously active clients seen by a server could increase beyond the number of available connections. Because, however, the Election service was designed to attract many clients during a brief period, its traces may come closer to representing the busy servers of the future than would traces from most other contemporary servers.
Lightly-used servers should see much higher locality of reference, since they will tend to have far few simultaneously active clients. Note also that the corporate server was lightly used during many periods; as figure 6 shows, a substantial number of its request arrivals were separated by more than 10 seconds (10,000 msec).
These simulations do not directly address the complete behavior of individual clients, since the traces were made at the servers. One would have to gather client-side traces from a large set of clients in order to prove that the typical client focusses its attention on a small set of servers for periods of several seconds or longer. However, from simple observations of how people actually use the Web, one could quite reasonably infer this to be the case.
Nor do these simulations directly address how different client caching strategies would affect the results. Since the traces were generated by real clients, most of which presumably were using caches, these simulations do reflect the use of normal client-side caching techniques.
7.2. Simulator overview
The simulator, a simple program consisting of about 1400 lines of C code, models the relevant behavior of a P-HTTP server, tracking several kinds of server state. It maintains a count of the number of open connections, and simulates the server’s PCB table, so that it can keep track of the number of TIME_WAIT entries. It can also maintain an ‘‘adaptive timeout’’ database of any given size.
Note that the simulator does not simulate the network or the clients, nor does it simulate the HTTP or TCP protocols. It simulates only the connection (‘‘session-layer’’) behavior of the server. Client and network behavior is provided by the traces of HTTP accesses, and so any effect that the modified protocol might have on client or network behavior is not modelled. Also, since the simulator sees requests arrive at the same spacing as in the original HTTP-based trace, these simulations do not account for the ‘‘pipelining’’ made possible by P-HTTP; they underestimate the potential locality of reference.
The simulator then goes through the event records, in time-sequence order. If it is simulating an HTTP server (that is, one request per connection), it simply processes the connection-open and connection-close events verbatim, maintaining the PCB table and removing TIME_WAIT entries as they reach the 2*MSL age.
If the program is simulating a P-HTTP server, it must do more work. For a connection-open event, it checks to see if a connection to the specified IP address is already open; if so, it simply updates its statistics counters. (Since the server logs cannot record the identity of the actual client process, I assume that each client host has only one process making HTTP requests. This assumption is safe for single-user and proxy clients, but is excessively liberal for busy timeshar-ing clients. However, I know of no way to correct for this effect.)
If there is no currently-open connection, the simulated server then checks to see if it has any free connection slots (the maximum number of simultaneous connections is a parameter of the simulation). If so, it simply creates a new ESTABLISHED record in the PCB table. Otherwise, it must make room by closing an idle connection. (The simulated server closes the least-recently used connection; this replacement policy has obvious attractions, but I have not investigated other possible policies.) If no idle connection is available, the new connection is rejected.
During a simulation of a P-HTTP server, a connection-close event causes the connection to be marked as idle, but leaves it in the ESTABLISHED TCP state.
After each event record is processed, the simulator looks for connections that have been idle longer than the specified idle-timeout parameter; these are moved into the TIME_WAIT state. The simulator also looks for connections that have been in the TIME_WAIT state for the full 2*MSL waiting period, and removes them entirely from the PCB table.
If the simulation includes the adaptive timeout mechanism (see section 5.2), the simulator maintains a table listing the N most recently active clients (N is another parameter). The table entries include the idle-timeout values for each host. When a client is first seen, it is entered into this table with a minimal timeout value. If a subsequent request arrives from the client before the connection times out, the simulator increases the client’s idle-timeout to the maximum value.
7.3. Summary of simulation parameters
The simulator allows specification of these parameters:
•P-HTTP mode: controls whether the simulated server uses the HTTP or P-HTTP
protocol.
•Maximum number of open connections
•Idle-timeout: in adaptive-timeout mode, this is maximum idle timeout.
•2*MSL timeout: allows simulation of non-standard timeouts for the TIME_WAIT
state.
•Adaptive-timeout table size: the number of entries in the recently-active client list,
•Initial idle-timeout: in adaptive-timeout mode, the idle timeout used for clients not
known to be using P-HTTP.
The simulator reports a set of statistics for each trial, including the total number of HTTP requests seen, the number of requests refused because too many were already open, the total number of TCP connections created, and the maximum number of simultaneously open connec-tions. The simulator also reports the maximum number of TIME_WAIT entries in the PCB table, and the maximum number of PCB table entries (including both TIME_WAIT and OPEN, but not any other TCP states).
For P-HTTP simulations, the statistics also include the number times a request arrived for a TCP connection that was already open, the number of times a connection was closed to make room for a new one, and the number of connections closed because of idle-timeouts.
7.4. Validation
Does the simulation accurately model reality? I could verify the simulation of the original HTTP protocol against measurements made on the election servers, since those servers logged the contents of their PCB tables every 15 minutes. (I do not have similar logs for the corporate server.)
Figure 7 shows how the simulated and actual values compare, over a busy two-day period for the election service. The curves show instantaneous values sampled every fifteen minutes (of either real or simulated time); I did not try to compute the mean (or maximum) value over each sample interval.
0 12 24 36 48
Time (hours since 00:00 Nov. 8) 1
10000
# of PCB table entries 10 100 1000
ESTABLISHED (simulated) TIME_WAIT (simulated) TIME_WAIT (actual)
[image:25.612.131.538.418.583.2]ESTABLISHED (actual)
Figure 7: Comparison of simulated and actual PCB states (election service)
The simulator appears to underestimate the number of ESTABLISHED (i.e, open) connections by a much wider margin. Some of the ESTABLISHED TCP connections counted in the actual measurements were not HTTP server connections (for the period shown in figure 7, there were about 5 non-HTTP connections counted in each sample), but this cannot account for the factor of two or three discrepancy at some points. In fact, many connections persisted in the ES-TABLISHED state longer than the server logs indicate. The server writes its log record before closing the connection, so the logged connection durations failed to include the final network round-trip. This discrepancy does bias the simulation results, but there is no reliable way to repair the logs retroactively.
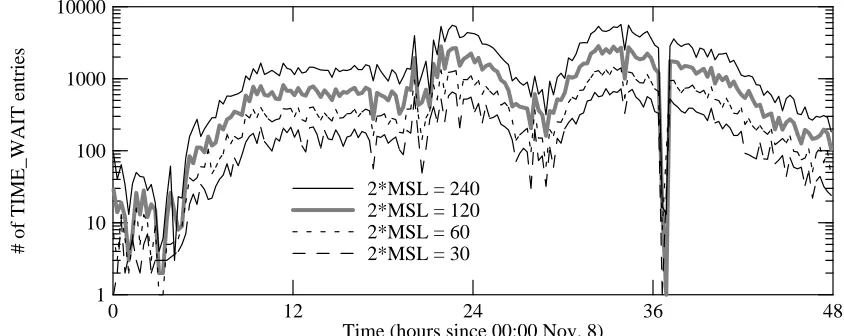
Figure 8 shows how varying the 2*MSL timeout value affects the simulated number of TIME_WAIT entries.
0 12 24 36 48
Time (hours since 00:00 Nov. 8) 1
10000
# of TIME_WAIT entries
10 100 1000
2*MSL = 120 2*MSL = 240
2*MSL = 30 2*MSL = 60
Figure 8: Effect of varying 2*MSL timer on number of TIME_WAIT entries
8. Simulation results
The first simulations compare the behavior of HTTP and several configurations of P-HTTP, varying the maximum number of connections and the idle-timeout parameter. This set of simulations did not include adaptive idle timeouts. For all of the simulations in this section, the 2*MSL timeout is set to 240 seconds (the value specified in the standard [23]).
The simulations show that for HTTP, the maximum number of simultaneously open TCP con-nections was rather small: 42 concon-nections for the election service, and 30 concon-nections for the corporate server. This means that a P-HTTP server allowing at least this many simultaneous connections would never have to refuse a request.
8.1. Connection refusal rates
What refusal rates would result if the open-connection limit were smaller? Figure 9 shows the number of connections refused as a function of the idle-timeout parameter and the
maximum-connection limit (Cmax), for both data sets. (Since ‘‘idle timeout’’ is meaningless for HTTP, the
an x-axis coordinate of 2000 seconds.) With a maximum of 32 connections, P-HTTP refuses significantly fewer requests than HTTP. Presumably this is because many requests that arrive during a period when all connections are in use come from a host that already owns a connec-tion. With a maximum of 10 connections, however, P-HTTP refuses significantly more requests than HTTP. Clearly the refused requests are not coming from hosts that already own one of the 10 open connections, but it is not clear why this makes things so much worse. At any rate, these results suggest that one needs to support at least 32 simultaneous connections, for workloads resembling the ones studied.
0.1 10000
Idle timeout, seconds
1 10 100 1000
10 1e+07
Number of requests refused 100 1000 10000 100000 1e+06
HTTP
P-HTTP
Corp server, Cmax = 10 Legend:
HTTP
Election service, Cmax = 10
HTTP
[image:27.612.118.543.185.356.2]P-HTTP Election service, Cmax = 32
Figure 9: Requests refused due to too many simultaneous connections
8.2. Connection re-use rates
How often does the P-HTTP protocol pay off, in terms of reduced latency as seen by the user? One measure of this is the number of times a request arrives for an already-open connection. Figures 10 and 11 show the number of ‘‘open-connection hits’’ as a function of the idle-timeout
parameter, for various limits on Cmax. In each graph, the dotted line shows the theoretical best
case; this is slightly less than the total number of requests made, because the first request from a client can never be a hit (and there may be other such ‘‘compulsory misses’’). The best-case hit rate for the election service is almost 99%; the best-case hit rate for the corporate server is about 95%. Even with an idle timeout of just 2 minutes, the election service would have achieved a 95% hit rate; the corporate server would have achieved 88%.
These graphs suggest that most of the benefit comes with an idle timeout of about 60 seconds. Longer timeouts yield only a negligible increase in the number of hits, except if the server can
support very large numbers of active connections. Increasing Cmax seems to increase the hit
rate, although with diminishing returns once Cmaxreaches 3 or 4 times the minimum required to
avoid refusing requests. Note that while P-HTTP could achieve a nearly optimal hit rate for the election service, the corporate server would not quite reach this limit, probably because of the much longer duration of the traces.
Figure 12 shows the total number of TCP connections that would be opened using P-HTTP, as
a function of the idle-timeout and Cmax parameters. (The results for the corporate server, not
shown, are quite similar.) This is just the complement of the number of open-connection hits,
except when Cmaxis low enough to cause some request refusals (dotted lines). For this data set,
1 10000 Idle timeout (seconds)
10 100 1000
0 1.8e+06
500000 1e+06 1.5e+06
[image:28.612.82.516.61.620.2]Number of open-connection hits Cmax = 10Cmax = 10 Cmax = 32 Cmax = 32 Cmax = 64 Cmax = 64 Cmax = 128 Cmax = 128 Cmax = 1024
Figure 10: Number of requests arriving for already-open connections (Election service)
1 10000
Idle timeout (seconds)
10 100 1000
0 3.5e+06
500000 1e+06 1.5e+06 2e+06 2.5e+06 3e+06
Number of open-connection hits
Cmax = 10 Cmax = 10 Cmax = 32 Cmax = 32 Cmax = 64 Cmax = 64 Cmax = 1024
Figure 11: Number of requests arriving for already-open connections (Corporate server)
1 10000
Idle timeout (seconds)
10 100 1000
10000 1e+06
Number of connections opened
100000
[image:28.612.106.514.68.236.2]Cmax=10 Cmax=32 Cmax=64 Cmax=128 Cmax=256 Cmax=512 Cmax=1024
Figure 12: Number of TCP connections opened (Election service)
[image:28.612.76.511.417.628.2]deviation divided by the sample mean). Figure 15 shows the maximum number of requests per connection.
1 10000
Idle timeout (seconds)
10 100 1000
0 40
10 20 30
Mean requests/connection
[image:29.612.122.547.84.678.2]Cmax = 10 Cmax = 32 Cmax = 64 Cmax = 128 Cmax = 256 Cmax = 512 Cmax = 1024
Figure 13: Mean number of HTTP requests per TCP connection (Election service)
1 10000
Idle timeout (seconds)
10 100 1000
1 7
2 3 4 5 6
Normalized standard deviation
Cmax = 10
Cmax = 32 Cmax = 64 Cmax = 128 Cmax = 256 Cmax = 512 Cmax = 1024
Standard deviations normalized to means
Figure 14: Standard deviations of requests/connection (Election service)
1 10000
Idle timeout (seconds)
10 100 1000
0 40000
10000 20000 30000
Max. requests/connection
[image:29.612.141.541.101.271.2]Cmax = 10 Cmax = 32 Cmax = 64 Cmax = 128 Cmax = 256 Cmax = 512 Cmax = 1024
[image:29.612.125.543.488.678.2]From figure 13 one can see that, even with a relatively low limit on the number of active connections, on average it is not hard to satisfy ten or more HTTP requests with one TCP con-nection. Figure 14, however, shows that the results are quite variable, with standard deviations
typical three or four times the mean. The curve for Cmax = 10 shows a much higher standard
deviation, because with so few connections available, a few clients that make frequent requests will tend to hold on to their connections, while most other clients will seldom get a chance to reuse a connection.
Since figure 15 shows that a few TCP connections, apparently those from busy proxy hosts, would handle a huge number of HTTP requests, do most connections gain from persistent con-nections? And do non-proxy clients see a high hit rate?
1 10000
Number of requests per connection
10 100 1000
0 2e+06
500000 1e+06 1.5e+06
Cumulative number of requests
Cmax = 256, idle timeout = 120 Cmax = 64, idle timeout = 10 sec
[image:30.612.101.516.225.394.2]Cmax = 1024, idle timeout = 1000 50%
Figure 16: Cumulative number of requests/connection (Election service)
Figure 16 shows, for the election service, the cumulative number of requests per connection,
th
for several values of the server parameters. The horizontal gray line shows where the 50
per-centile lies. Over a broad range of parameter settings, a substantial number of the HTTP re-quests are satisfied by a connection that is reused many times.
Figures 17 through 19 show the means, standard deviations, and maxima for the corporate server. Although with this trace, P-HTTP results in much lower means than with the election service trace, the standard deviations and maxima are much higher. Some connections ap-parently would capture many thousands of HTTP requests, over a broad range of parameter values. Are these connections typical? The cumulative distribution in figure 20 suggests that only a small fraction of the requests are satisfied by long-running connections (those that handle over 100 requests).
8.3. The effect of a Web indexer
1 10000 Idle timeout (seconds)
10 100 1000
0 14
2 4 6 8 10 12
Mean requests/connection Cmax = 10
[image:31.612.125.546.60.594.2]Cmax = 32 Cmax = 64 Cmax = 128 Cmax = 256 Cmax = 512 Cmax = 1024
Figure 17: Mean number of HTTP requests per TCP connection (Corporate server)
1 10000
Idle timeout (seconds)
10 100 1000
1 6
2 3 4 5
Normalized standard deviation
Cmax = 10
Cmax = 32 Cmax = 64 Cmax = 128 256, 512 Cmax = 1024
[image:31.612.141.543.67.234.2]Standard deviations normalized to means
Figure 18: Standard deviations of requests/connection (Corporate server)
1 10000
Idle timeout (seconds)
10 100 1000
0 12000
2000 4000 6000 8000 10000
Max. requests/connection
Cmax = 10 Cmax = 32 64 - 512 Cmax = 1024
Figure 19: Maximum number of requests/connection (Corporate server)
[image:31.612.120.544.450.649.2]1 10000 Number of requests per connection
10 100 1000
0 3.5e+06 500000 1e+06 1.5e+06 2e+06 2.5e+06 3e+06
Cumulative number of requests
Cmax = 32, idle timeout = 10 sec
Cmax = 1024, idle timeout = 1000 Cmax = 256, idle timeout = 120
50%
[image:32.612.92.514.62.596.2]50%
Figure 20: Cumulative number of requests/connection (Corporate server)
1 10000
Idle timeout (seconds)
10 100 1000
0 12 2 4 6 8 10
Mean requests/connection Cmax = 10
Cmax = 32 Cmax = 64 Cmax = 128 Cmax = 256 Cmax = 512 Cmax = 1024
Figure 21: Mean number of requests per connection (Corporate server, no indexer)
1 10000
Idle timeout (seconds)
10 100 1000
0.5 3 1 1.5 2 2.5
Normalized standard deviation
10 32
64 128256 Cmax = 512 Cmax = 1024
[image:32.612.108.516.68.235.2]Standard deviations normalized to means
Figure 22: Standard deviations of requests/connection (Corporate server, no indexer)
[image:32.612.95.507.433.635.2]1 10000 Idle timeout (seconds)
10 100 1000
0 12000
2000 4000 6000 8000 10000
Max. requests/connection
[image:33.612.121.542.65.236.2]Cmax = 10 32 - 256 Cmax = 512 Cmax = 1024
Figure 23: Maximum number of requests/connection (Corporate server, no indexer)
of one additional outlier seen with long idle timeouts. This turned out to be a popular proxy relay.
8.4. Success rates viewed by client
The high maximum values of the requests per connection statistic, as shown in figures 15 and 19, raised the question of what fraction of the client hosts saw a high hit rate. That is, were the TCP connections that saw many HTTP requests limited to a small subset of the client hosts, or were they distributed among a wide set of clients?
[image:33.612.125.544.478.650.2]Figures 24 and 25 show, for the election service and corporate server respectively, the dis-tribution of the best-case request per connection values among the clients. For example, from
figure 24 we can see that, for Cmax= 256 and an idle timeout of 120 seconds (solid curve), over
half of the individual election client hosts would have been able, at least once, to send at least 20 HTTP requests over a single TCP connection.
1 100000
Best-case number of requests/connection
10 100 1000 10000
0 25000
5000 10000 15000 20000
Cumulative number of clients
Cmax = 64, idle timeout = 10 sec
Cmax = 1024, idle timeout = 1000 Cmax = 256, idle timeout = 120 50%
Figure 24: Distribution of best-case requests/connection (Election service)
This wide distribution of the benefits of P-HTTP depends somewhat on the server parameters.
For example, figure 25 shows that for the corporate server, setting Cmax = 32 and the idle
1 10000 Best-case number of requests/connection
10 100 1000
0 140000
20000 40000 60000 80000 100000 120000
Cumulative number of clients
Cmax = 32, idle timeout = 10 sec
[image:34.612.98.512.66.238.2]Cmax = 1024, idle timeout = 1000 Cmax = 256, idle timeout = 120 50%
Figure 25: Distribution of best-case requests/connection (Corporate server)
8.5. Frequency of forced closes
A P-HTTP server closes an idle TCP connection for two reasons: either it needs to make room for a request from a different client (a ‘‘forced’’ close), or the connection has been idle for longer than the idle-timeout parameter allows. Figures 26 and 27 show the number of forced closes for various parameter values; the number of connections closed by idle timeouts is the complement of this number.
1 10000
Idle timeout (seconds)
10 100 1000
0 1.6e+06
200000 400000 600000 800000 1e+06 1.2e+06 1.4e+06
Number of forced closes
Cmax = 10
[image:34.612.100.514.378.546.2]Cmax = 32 Cmax = 64 Cmax = 128 Cmax = 256 Cmax = 1024
Figure 26: Number of forced closes of TCP connections (Election service)
Figure 26 implies that the election service would often have run into the Cmax limit and be
forced to close an idle connection, unless Cmaxwere quite large. The curves in this figure show
almost no dependence on the idle-timeout parameter for values above 30 seconds or so; that is,
unless Cmaxis quite large, few connections would live long enough to time out. Conversely, the
1 10000 Idle timeout (seconds)
10 100 1000
0 2.5e+06
500000 1e+06 1.5e+06 2e+06
Number of forced closes
Cmax = 10
[image:35.612.144.551.68.237.2]Cmax = 32 Cmax = 64 Cmax = 128 Cmax = 1024
Figure 27: Number of forced closes of TCP connections (Corporate server)
8.6. PCB table use
In section 5.4, I argued that P-HTTP should dramatically reduce the number of PCB table entries in the TIME_WAIT state. Even if the number of PCB table entries for open connections increased somewhat (because the server is holding connections open longer), the total number of PCB table entries should decrease.
The simulator counts the number of ESTABLISHED and TIME_WAIT entries. (The simulator reports the peaks, rather than means, of these counts, because the system must reserve enough memory to satisfy the peak. Also, the peak size determines the CPU-time cost of PCB lookups during periods of heavy load, precisely when this cost is most problematic.) An HTTP server, which closes connections quite rapidly, also ends up with many entries in a variety of short-duration states (primarily CLOSE_WAIT and FIN_WAIT), but the simulator did not model this. A P-HTTP server with a reasonably good open-connection hit rate, and thus a rela-tively low rate of connection closes, should tie up relarela-tively few PCB table entries in these short-duration states.
Figures 28 and 29 show the peak number of TIME_WAIT entries for various combinations of parameters. P-HTTP always does significantly better than HTTP. This holds true even if one looks at the total number of PCB table entries (modelled as the sum of the TIME_WAIT entries
plus Cmax).
Generally, the number of TIME_WAIT entries does not appear to depend on the idle-timeout
parameter, for values above a threshold that varies somewhat with Cmax. This is because most
connections are closed before the idle timeout goes off, and so most of the TIME_WAIT entries are generated by forced closes.
However, for large values of Cmax (somewhere around 500 connections), increasing the
1 10000 Idle timeout (seconds)
10 100 1000
100 10000
Maximum # of TIME_WAIT entries
1000 Cmax = 10
Cmax = 32 Cmax = 64 Cmax = 128 Cmax = 256 Cmax = 512 Cmax = 1024
[image:36.612.90.507.67.236.2]HTTP
Figure 28: Maximum number of TIME_WAIT entries in PCB table (Election service)
1 10000
Idle timeout (seconds)
10 100 1000
100 10000
Maximum # of TIME_WAIT entries
1000
10, 32 Cmax = 64 128, 256 Cmax = 1024 HTTP
[image:36.612.83.511.109.426.2]512
Figure 29: Maximum number of TIME_WAIT entries in PCB table (Corporate server)
hand, may be more spread out in time, and so their TIME_WAIT entries are less likely to coexist in the PCB table.
This effect suggests that increasing the idle timeout without bound, while it might improve the open-connection hit rate slightly, would not be a good idea. Increasing the demand for PCB table entries results in a moderate increase in the memory resource requirements, and potentially a large increase in the CPU overhead for managing this table.
8.7. Adaptive timeouts
How well would P-HTTP perform if servers had to use the adaptive timeout scheme (described in section 5.2) in order to deal with HTTP proxies? That is, what would happen to the open-connection hit rate? A reduction in this rate would reduce the benefit of P-HTTP.
I simulated an adaptive-timeout policy while varying several parameters, including the initial timeout and the size of the per-client timeout table. For these simulations, I held the maximum
1 1000 Maximum idle timeout
10 100
600000 1.6e+06
800000 1e+06 1.2e+06 1.4e+06
Number of open-connection hits Initial timeout = 1 Initial timeout = 2 Initial timeout = 10 100 table entries
1000 table entries 10000 table entries
[image:37.612.128.552.69.431.2]Cmax = 512
Figure 30: Effect of adaptive timeouts on open-connection hits (Election service)
1 1000
Maximum idle timeout
10 100
500000 3.5e+06
1e+06 1.5e+06 2e+06 2.5e+06 3e+06
Number of open-connection hits Initial timeout = 1 Initial timeout = 2 Initial timeout = 10 100 table entries
1000 table entries 10000 table entries No adaptive timeouts
Cmax = 512
Figure 31: Effect of adaptive timeouts on open-connection hits (Corporate server)
Figures 30 and 31 show the results for the number of open-connection hits. Figure 31 also shows the results for a P-HTTP server without adaptive timeouts (gray curve); figure 30 does not show this curve, which would overlap almost exactly with the curve for the adaptive timeout case with a table size of 10,000 entries, and an initial timeout of 10 seconds.
With the initial timeout set to 1 second, and even with the largest simulated table size, the adaptive timeout scheme fails to capture between 15% (election service) and 24% (corporate server) of the open-connection hits available to the non-adaptive scheme. (Note that the vertical scales in figures 30 and 31 do not start at zero.) So the adaptive timeout scheme does reduce the potential performance of P-HTTP, although it would still eliminate 84% of the election service’s TCP connections, and 73% of the corporate server’s connections.
8.8. Network loading
[image:37.612.135.550.248.429.2]