150
IMPLEMENTING VALUE INVESTING STRATEGY
THROUGH AN INTEGRATED FUZZY-ANN MODEL
SHEN, KAO-YI
Asstt Prof., Department of Banking and Finance, SCE, Chinese Culture University E-mail: [email protected]
ABSTRACT
Value investing strategy is a main approach that has been widely examined in the academic field for identifying stocks with good prospects. However, to implement this strategy in practice, it is unavoidable to explore the implicit relationship among financial performance and subsequent stock returns for making decisions. Thus, this research adopts a theoretical framework from the value investing strategy and proposes an integrated AI (artificial intelligence) model to learn the complicated if-then rules for supporting stock selection. The proposed Fuzzy-ANN model may leverage its superior learning capability of neural network for modeling large amount of data, and the fuzzy inference system is used to retain the plausible relationships among financial variables and stock movements. An empirical case is illustrated for how to apply the proposed model in the Taiwan’s stock market. The selected value stocks (i.e., high value portfolio) outperformed the market indexes (Taiwan 50 index and Taiwan stock exchange weighted index) in various holding periods. To put risk factor into consideration, the high value portfolio also surpassed the market indexes by using the Sharpe ratio measurement with statistical significance. The result indicates that the proposed Fuzzy-ANN model is capable to select high value stocks with meaningful insights.
Keywords: Artificial Neural Network (ANN), Adaptive Neuro-Fuzzy Inference Systems (ANFIS),
Fundamental Analysis, Investment Strategy, F-score Model
1. INTRODUCTION
Stock selection problem is a critical issue in the financial field. Graham and Dodd [1] claimed that sometimes the inefficiency of market might cause a stock to decline far below its intrinsic value, smart investors could gain profits by selecting this type of stocks, termed as value stocks. Because of the outstanding investment records of Berkshire Hathaway Inc., the value investing strategy has gained enormous attention in financial market [2]. In academic research, high B/M (book-to-market value) stocks are often categorized as value stocks. Researchers intend to identify high B/M stocks with good financial prospects by analyzing a variety of accounting signals and historical data. However, given the stock market’s volatility and complexity, to conduct this strategy requires in-depth financial knowledge and long enough experience in the stock market. Although the use of relevant financial information for assessing the prospects of a stock is widely accepted, the opinions on which information should be included and the ways of modeling are divided. Conventional studies [3]-[4] often use a regression model to capture changes in future earnings, where earnings are considered as one of the key factors in stock valuation. To focus on the
value investing strategy, [5] presented a well-known F-score model, which included 9 financial variables from 3 dimensions to differentiate expected winners and losers. The aforementioned studies often take the form of regression model to examine the relative strength of financial variables for discriminating value stocks, but the limitation of regression model may only conclude consistent relationships among all of the variables in the same equation. Furthermore, the general assumption of regression model requires independent relationship among the financial variables, which is not realistic in practice. To overcome the limitations, this study proposes an integrated Fuzzy-ANN model to learn the complicated rules among variables under evaluation.
stock’s earning persistence [10], but the black-box learning process hampers its way to provide meaningful input-output causalreasoning. In recent years, some intelligent techniques have been applied to form a hybrid or integrated model for supporting investment decisions. For example, [11] proposed a hybrid stock trading system based on technical analysis by integrating GA, ANN, and Fuzzy logics. Cheng et al. [12] introduced a fusion ANFIS model based on stock volatility for stock index forecasting. The use of hybrid or integrated intelligent techniques may help to extend the limitations of single method [13], but the aforementioned studies mainly focused on retrieving trading rules from historical stock price or trading volume movements. The analysis of crucial financial information to retrieve rules for value stock selection has not been explored.
Therefore, to bridge the gap, this study attempts to integrate AI techniques with an accounting model to implement value investing strategy. To handle the imprecise relationships among financial variables, fuzzy inference system (FIS) was applied to integrate with ANN technique in the proposed model. The use of FIS can help keep the uncertainty for time-series forecasting and evaluation [14]-[15], and the integrated Fuzzy-ANN method is proposed to explore future stock prospect.
An empirical case from the Taiwan’s stock market is used to illustrate the selection of high value stocks. After the screening of listed companies in Taiwan’s stock market from 2008 to 2009, there were total 712 suitable samples stocks included for analysis. In the first stage, a step-wise regression model was constructed to select core financial variables for the proposed model. And the trained model evaluated the sample stocks for selecting high value stocks in the second stage. A portfolio comprising of 22 high value stocks is compared with Taiwan 50 index (jointly designed by the Taiwan Stock Exchange and FTSE Group) and the Taiwan stock market index. After adjusting risk factor by using the Sharpe ratio measurement, the constructed high value portfolio outperforms Taiwan 50 index and the market index significantly in several holding periods.
The remaining part of the paper is organized as follows. In Section 2, the literature review of value investing and adopted AI techniques are presented. In Section 3, the required steps for the Fuzzy-ANN model are illustrated. In Section 4, construction and evaluation of a high value portfolio are provided and analyzed. In Section 5, findings and discussion
are presented. Finally, in Section 6, conclusions and suggestion for the future research direction are provided.
2. LITERATURE REVIEW
This section reviews related studies in investment analysis including value investing strategy and fundamental analysis. The AI techniques mentioned in this study are also discussed, including fuzzy inference, ANN and ANFIS.
2.1 Value Investing and Fundamental Analysis
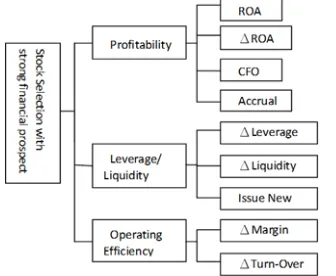
[image:2.612.321.489.469.607.2]The value investing strategy is based on fundamental analysis [16], or sometimes called financial ratio analysis approach [17]. Fundamental analysis ignores the trading information while making evaluation, and focuses on the derived information or signals from financial statements. Various investing strategies could be found in the thread of fundamental analysis [16], and the value investing strategy is one of the most famous strategies. In general, value investing often waits until stock market becomes overly pessimistic to offer low enough buy-in prices compared with the intrinsic value of stocks. The recent financial turmoil from 2008 offers a good timing to test this strategy. To examine the value investing strategy, [5] proposed the F-score model and chose 9 fundamental signals to measure 3 aspects of a firm’s financial performance, and the F-score’s conceptual framework is shown as in Figure 1:
Figure 1: The Framework of F-score Model
152
2.2 Fuzzy Inference System and ANN
Due to the complicated characteristics of investment, experts need to rely on their financial knowledge and experience while considering the complex evaluation process. Fuzzy inference system is known for being capable to tolerate imprecise data and to model nonlinear relationships of high complexity [18]-[20]. Despite the superior reasoning capability of fuzzy inference system for making decisions under uncertainty, the fuzzy technique is often criticized as how to define the membership function (i.e., the degree of one instance belongs to one or more categories). To solve the issue for complex real-world problem, researchers turn for the support from the other AI techniques. One of the integrated methods takes the advantage of ANN to form the membership functions for rules in FIS, which is commonly termed as neuro-fuzzy system. The neuro-fuzzy system has been applied in various fields, and several studies also introduced it for supporting investment decisions [12]-[13]. The aforementioned applications in investment mainly relied on the neuro-fuzzy system for capturing trading rules from the historical prices and volumes of stocks. Although there have been some initiations of studies in applying neuro-fuzzy inference system for investment decisions, the previous studies put their emphasis on the trading aspect [11]-[15]. Relatively speaking, a financial analysis based neuro-fuzzy inference system is still unexplored.
3. PROPOSED MODEL
[image:3.612.325.519.75.266.2]Considering the complexity of the learning processes of fuzzy inference, the first stage aims to reduce the potential rules by selecting core variables from the original F-score model. By applying the repetition of variable selection, the step-wise regression model may choose the set of variables that are most relevant for explaining the subsequent holding period returns (HPRs) for stocks. According to the previous study by [20], the “ROE” variable may be used to replace the “Accrual” variable to enhance the original F-score model. In this study, the ROE variable is also included for subsequent analysis. At each step, a single variable either enters into the model or leaves the model, decided by F-test value. After the selection of core variables, the second stage adopts the Fuzzy-ANN model for the learning of effective rules. The Figure 2 shows the flow chart of the 2-stage model, and the explicit steps are as follow:
Figure 2: The 2-stage Processes for Value Stock Selection
3.1 Select Core Variables from the F-score Model
The regression model is examined by monitoring the sum of square errors and observing the original 9 accounting signals from the F-Score in the step-wise regression. In this study, the threshold F-value for entering the model is set to be 3.5 after some trial experiments.
3.2 Train the Fuzzy-ANN Model
In the second stage, the model maps the input variable with the target dependent variable, which is the subsequent HPR for each stock. The HPR is defines as Eq. (1):
(1) where the Vend and Vinitial denote the ending value
and initial value of a stock respectively, Dperiod
represents pertaining dividend gains during the holding period.
All of the selected core variables for each stock from training period are mapped with their HPRs in the subsequent time period. Thus, the trained model could be applied for forecasting by using financial data in current time period.
To train the Fuzzy-ANN model by modifying the membership functions for each rule with the corresponding outputs. The training process adjusts the parameters to map the given input (core F-score variables) and output (subsequent HPRs) data. There are some fuzzy membership functions that may be used, and the Gauss membership function is famous for its widely adopted applications in finance. The equation of the Gauss membership function is as in Eq. (2). After choosing the type of membership function, the number of membership function for each input needs to be assigned. To
(
end initial)
period / initial153
1 / 1
n n
i i i
i i
FinalOutput=
∑
=w z∑
=wreduce the complexity of the potential rules, the number of membership function for each input is set to be 3 or 4 in this study. As for learning algorithm, both of the back-propagation and the hybrid learning (a combination of least-squares and back-propagation gradient descent method) were used, and the superior learning outcome suggests that the hybrid algorithm should be adopted. The final output is calculated by linear combination, and the equation is as in the Eq. (3). In this step, the original data should be divided into two groups, namely training set and testing set, respectively. Only the training set data will be used for modeling, and the testing data should be reserved for validation purpose.
(2) where x denotes the random variable, σ and c represents standard deviation and central mean.
(3) where z is the output level of each rule, and wiis
the firing strength for a generic Sugeno-type fuzzy system.
While the network converges to an acceptable state, the post-training analysis may be taken to examine the effectiveness of the model. The acceptable state can be observed by monitoring the plots of RMSE (root mean square error), to see if the RMSE converges to a stable state. The model’s output and the actual output may be plotted altogether to examine the potential fitness. To examine the stability of the training result, a 3-fold cross validation was implemented. The historical sample data was divided into 3 parts, while 2 of 3 parts are treated as the training set and the remaining part is reckoned as testing set. The validation processes is executed 3 times and the purpose is to examine all of the parts. According to Zhiyon, et al. [12], the k-fold cross validation may generate better result because of its comprehensive combinations. The RMSE may be expressed in Eq. (4) and the k-fold cross validation is shown is Eq. (5) respectively.
(4) where n is the number of outputs predicted, yi is
the predicted output and is the expected output.
1
1 k
j j
True Error RSME
k =
=
∑
(5) where k is the number of folds, and the number is set to be 3 in this study.
Evaluate the performance of the model’s selected stocks. After the formation of the trained Fuzzy-ANN model, the updated financial data may be used as inputs to generate FIS output. The stocks with high FIS system output (above selected threshold) may be included to form a high value portfolio.
4. EMPIRICAL ANALYSIS
Empirical data of this study were retrieved in the TEJ (Taiwan Economics Database) from 2008 to 2011. The historical financial data in 2008 and 2009 were used for training the proposed model, and the subsequent returns in 2010 and 2011 were examined to assess the performance of the selected stocks. After the exclusion of financial stocks and screening out incomplete data, there were only 712 sample stocks left for 2009 and 2010. Based on the concept of value investing strategy, the highest 40% B/M (Book-to-Market) ratio stocks in the beginning of 2009 were selected as proxies of value stocks (285 stocks) for further modeling. To test the model’s effectiveness, 30% (85 stocks) of the high B/M stocks were kept untouched as testing set. Only about 70% high B/M sample stocks (200 stocks) were used for training.
In the first stage, a step-wise regression model was developed to retrieve high influential variables for further modeling. Except the variable CFO, the other variables were all measured in percentage. To prevent potential distortion in the modeling process, the CFOvariable was transformed to a range closer to the other variables in the regression model. As stated in the previous section, the threshold of F value was set to be 3.5, and the selected 4 core variables are CFO (cash flow from operation),
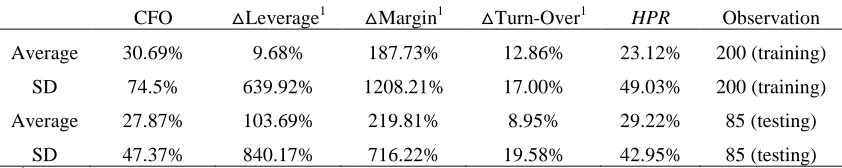
△Leverage, △Margin, and △Turn-Over. The general description of the raw data for high B/M stocks in 2009 is as in the Table 1.
Considering the reality that all Taiwan stocks’ annual financial statements should be released before the end of April in each year, all of the sample stocks’ financial ratios were collected for the end of April 2009. The desired outputs in the Fuzzy-ANN model were the following 12 or 24 months’ HPRs of sample stocks. The HPRs of the sample stocks were adjusted by the TEJ database to eliminate the dividend effect. To evaluate the stock selection capability of the proposed method, all of the HPRs were benchmarked against the market index (Taiwan stock exchange weighted index) and a large-cap index (TW 50 index). In the second stage of the modeling, the rule-based fuzzy inference was comprised of 4 core variables, and
( )2
1 1 ˆ n i i i
RSME y y n = =
∑
−(
)
( ) 2 2 2 ; , x cf xσ c e σ
154 the combination reached to 81 (the number of membership functions for input variables CFO,
△Leverage, △Marginand△Turn-Over were all set to be 3 after experiments) rules based on the setting of fuzzy membership function. To obtain a better structure setting for modeling, various membership functions and learning algorithms were tested. After experiments, the model employed the
[image:5.612.80.501.209.293.2]Levenberg-Marquardt algorithm (one of the back-propagation methods) with Gauss membership function, and the constant output-type was found to be suitable for the network structure. The training and testing results of the two time periods by various membership functions could be summarized as in Table 2.
Table 1: Descriptive Statistics Of The High B/M Stocks In 2009
CFO △Leverage1 △Margin1 △Turn-Over1 HPR Observation Average 30.69% 9.68% 187.73% 12.86% 23.12% 200 (training)
SD 74.5% 639.92% 1208.21% 17.00% 49.03% 200 (training) Average 27.87% 103.69% 219.81% 8.95% 29.22% 85 (testing)
SD 47.37% 840.17% 716.22% 19.58% 42.95% 85 (testing)
1
[image:5.612.89.506.325.489.2]The measurement time period for △Leverage, △Margin and △Turn-Over capture the change from 2008 to 2009.
Table 2: The RMSE Of The Training And Testing Models In Different Time Periods.
Membership function
Output-type 12months 24months training testing training testing Triangular Constant 0.3789 0.4012 0.4010 0.6603 Triangular Linear 0.3032 >1 0.3126 >1 Gauss Constant 0.3466 0.5549 0.3710 0.9596 Gauss Linear 0.2727 >1 0.2841 >1
Table 3: Monthly Against The Market Index (unit:%)
differences 6 months 12 months 18 months 24 months (Hi-Value-TW50) 2.3838 5.1603* 3.9224* 2.6488
(Hi-Value-Mkt) 1.9092 5.1078* 3.7612* 2.6603
*
[image:5.612.83.505.531.589.2]t-test was taken to indicate the significance at .1 levels with two-tailed testing.
Table 4: The Comparison of Profits in Different Time Periods
12 months (Jan2010~Dec2010) 24 months (Jan2010~Dec2011)
HPR Sharpe Ratio1 HPR Sharpe Ratio1 Hi-Value 110.42% 0.8894 66.57% 0.3383 TW 50 index 8.77% 0.3216 -11.77% 0.0163 Mkt index 9.58% 0.3424 -13.63% 0.0129
1
annual riskless rate was set to be 1% in the calculation.
[image:5.612.328.505.612.711.2]In this study, the two most frequently used fuzzy membership functions were applied, and the result indicated that the Gauss membership function with constant output-type generated the lowest RMSE in the time period of 12 months. Thus, after several experiments, the Fuzzy-ANN model with 12 months HPRs was selected for the subsequent analysis. The RSME for the training period converged at 0.3466 until 50 epochs, and the result was shown as Figure 3:
Figure 3: The Training Error of the 12 Months Model HPR
The FIS output against the expected output for the training set was checked, and the result seemed to be acceptable for testing. To further examine the model’s capability in mapping the desired output and exact output, the FIS outputs for testing set were plotted against the expected outputs as in
Figure 4:
Figure 4: The FIS Output Against The Expected Output In 12 Months Model
[image:6.612.101.293.582.689.2]After the validation of the trained Fuzzy-ANN model, the study further examined the stock selection capability while applying to the real stock market. The whole sample set was used to generate FIS output. For those stocks with FIS output higher than 0.5 were selected to form the Hi-Value (i.e., high value) portfolio with equal weights in the portfolio (comprised of 22 stocks). The return performance of the Hi-Value portfolio was compared against the market index and the Taiwan 50 index in various time periods. The Taiwan 50 index comprises of 50 highly capitalized blue-chip stocks and it represents nearly 70% of the Taiwan stock market. To balance the evaluation in return and risk, the Sharpe ratio as Eq. (6) was also calculated to see if the Hi-Value portfolio outperformed the market index considering risk factor. The result was shown in the Table 3, and the monthly HPR of the Hi-Value portfolio was plotted to compare with the market indexes in the Figure 5.
Figure 5: Monthly HPR Of Hi-Value Portfolio And The Market Indexes.
(
)
r p f
p
HPR r
Sharpe atio= − σ (6)
where HPRp is the portfolio’s average
holding-period return, rf is the riskless rate of return, and p
σ
(adjusted for risk factor) is the standard deviation of HPRp.The monthly (monthly HPR average) of the Hi-Value portfolio outperformed both the TW50 index and the market index in all of the 4 time periods, and the differences showed statistical significance in 12 and 18 months. As the monthly
HPR of the Hi-Value portfolio seemed to reveal higher volatility, to put the risk factor into consideration, the HPR and the Sharpe ratio for 12 and 24 months were also calculated (in the Table 4). The Sharpe ratio is commonly used in financial industry to measure the performance of mutual funds considering the balance in return and risk.
The Sharpe ratio may be interpreted as the portfolio’s capability to earn premium per unit risk, often regarded as risk-adjusted returns. In both of the two time periods, Hi-Value portfolio consistently showed better results. The HPR of Hi-Value portfolio reached up to 66.57% in 24 months as in Table 4, while the other two market indexes all fall into negative returns in the same period.
5. FINDINGS AND DISCUSSIONS
To summarize, the 2-stage model generated a set of fuzzy inference rules based on the core F-score model. According to the concept of value investing strategy, the set of fuzzy inference rules supported to select high value stock for constructing a Hi-Value portfolio. The result indicates that Hi-Hi-Value portfolio earned higher HPRs in all of the time periods, and the Hi-Value portfolio outperformed the TW50 index and market index by using the Sharpe ratio measurement. Aside from the superior performance of the constructed Hi-Value portfolio, the derived FIS rules also provided insights for decision makers. Most of the derived rules from the Fuzzy-ANN model are consistent to general understanding in finance, such as:
{Rule: if CFO is “high” and △Leverage is “low” and △Margin is “high” and △Turn-Over is “middle”, then the subsequent HPR is relatively high}.
Among the 81 rules, one of the rules that indicated low subsequent HPR is worthwhile for discussion, which is:
156 {Rule: if CFO is “low” and △Leverage is “high” and” and △Margin is “low”, and △ Turn-Over is “high”, then the subsequent HPR is relatively low}.
According to corporate finance, turnover comes from operations and the other sources of revenues. If a company increases its total turnover significantly but its cash flow from operations is relatively low, then the source of revenue and income might need further examination. Also, increased leverage and deteriorating margin often imply the difficulties in business competition, and this could be a negative sign for subsequent stock performance. Compared with previous studies [11]-[14] that utilized AI techniques for supporting investment decisions, the derived reasoning rules provide meaningful insights in finance for decision makers, which is also the major contribution of the proposed model.
6. CONCLUSIONS
In conventional studies that examine the effectiveness of investing strategy, each financial signal must be independent of the others in a regression model. Therefore, the interactions and imprecise relationships among financial variables cannot be handled. To overcome the limitation of conventional approach, this study proposes a Fuzzy-ANN model for value-investing strategy. To examine the effectiveness of the proposed model, a high value portfolio was constructed from real market data based on the model’s outputs. The empirical data was retrieved in the Taiwan stock market from 2008 to 2011. The historical data of financial ratios in 2008 and 2009 were used for the training purpose, and the HPRs of selected stocks in 2010 and 2011 were examined to evaluate the return performance of the selected stocks (i.e., the Hi-Value portfolio).
Although the result shows the effectiveness of the proposed model, the study still has potential limitations and bias. First, there may be a survival bias, which only companies with complete financial information in the database were included for the empirical analysis. If a company reveals very high B/M ratio and goes private in the subsequent 1 or 2 years, the extreme outcome would not be included for modeling. Second, although the purpose of this study is to implement the proposed Fuzzy-ANN model for the value investing strategy, the derived fuzzy rule-base could only select potential high B/M stocks for the better prospects without obtaining the pricing target for each stock. Future research is suggested to explore this issue.
REFRENCES:
[1] B. Graham, D. Dodd, Security Analysis: principles and techniques, McGraw Hill, New York, 1963.
[2] A. Schroeder, The Snowball: Warrant Buffett and the Business of Life, Random House Publishing Group, New York, 2008.
[3] J.A. Ou, S.H. Penman, “Accounting Measurement, Price-Earnings Ratio, and the Information Content of Securities Prices”,
Journal of Accounting Research, Vol. 27, 1989, pp. 111-144.
[4] B. Lev, S.R. Thiagarajan, “Fundamental Information Analysis”, Journal of Accounting Research, Vol. 31, No. 2 ,1993, pp. 190-215. [5] J.D. Piotroski, “Value Investing: The Use of
Historical Financial Statement Information to Separate Winners from Losers”, Journal of Accounting Research, Vol. 38, 2000, pp. 1-41. [6] E. Hadavandi, H. Shavandi, A. Ghanbari,
“Integration of genetic fuzzy systems and artificial neural networks for stock price forecasting”, Knowledge-Based System, Vol. 23, No. 8, 2010, pp. 800-808.
[7] A. Fan, and M. Palaniswarmi, “Stock Selection Using Support Vector Machines”, Proceedings of the International Joint Conference on Neural Networks, Vol. 3, 2001, pp. 1793-1798. [8] K.J. Kim, and W. Lee, “Stock Market
Prediction Using Artificial Neural Networks with Optimal Feature Transformation”, Neural Computing & Applications, Vol. 13, No. 3, 2004, pp. 255-250.
[9] K.Y., Shen, “Implementing Value Investing Strategy by Artificial Neural Network”,
International Journal of Business and Information Technology, Vol. 1, No. 1, 2010, pp. 12-22.
[10] K.Y. Shen, “The Modeling of Earnings Prediction by Time-Delay Neural Network”,
Advanced Material Research, Vol. 433-440, 2012, pp. 907-911.
[11] T. Chavamakul, D. Enke, “A hybrid stock trading system for intelligent technical analysis-based equivolume charting”,
Neurocomputing, Vol. 72 , No. 6-18, 2009, pp. 3517-3528.
[12] C.H. Cheng, L.Y. Wei, Y.S. Chen, “Fusion ANFIS models based on multi-stock volatility causality for the TAIEX forecasting,
[13] T. Zhiyong, C. Quek, Y.K.C. Philip, “Stock Trading with Cycles: A Financial Application of ANFIS and Reinforcement Learning”,
Expert System with Applications, Vol. 38, 2011, pp. 4741-4755.
[14] H.M. Huang, M. Pasquier, C. Quek, “Financial Market Trading System with a Hierarchical Co-Evolutionary Fuzzy Predictive Module”,
IEEE Transactions Evolutionary Computation, Vol. 13, No. 1, 2009, pp. 56-70.
[15] M. Khashei, M. Bijari, G.A. Raissi Ardali, “Improvement of Auto-Regressive Integrated Moving Average models using Fuzzy logic and Artificial Neural Networks”, Neurocomputing, Vol. 72, No. 4-6, 2009, pp. 956-967.
[16] J.S. Abarbanell, B.J. Bushee, “Fundamental Analysis, Future Earnings, and Stock Prices”,
Journal of Accounting Research, Vol. 35, No. 1, 1997, pp.1-24.
[17] E.H. Feroz, S. Kim, R.L. Raab, “Financial Statement Analysis: A Data Envelopment Analysis Approach”, The Journal of the Operational Research Society, Vol. 54, No. 1, 2003, pp. 48-58.
[18] C. Carlsson, R. Fuller, “A fuzzy approach to real option valuation”, Fuzzy Sets and Systems, Vol. 139, No. 2, 2003, pp. 297-312.
[19] M. Tavana, F. Zandi, “A hybrid fuzzy real option analysis and group ordinal approach for knowledge management strategy assessment”,
Knowledge Management Research & Practice, Vol. 8, No. 3, 2010, pp. 216-228.
[20] V. Kodogiannis, A. Lolis, “Forecasting Financial Time Series using Neural Network and Fuzzy System-based Techniques”, Neural Computing and Applications, Vol. 11, No. 2, 2002, pp. 90-102.
[21] K.Y. Shen, M.R. Yan, “A Hybrid Value Investing Method for the Evaluation of Banking Stocks”, International Journal of Trade, Economics and Finance, Vol. 1, No. 3, 2010, pp. 277-282.
[22] J.S.R. Jang, “ANFIS: Adaptive-Network-Based Fuzzy Inference System”, IEEE Transactions on Systems, Man, and Cybernetics, Vol. 23, No. 3, 1993, pp. 665-685.