CLUSTERING AND NEURAL NETWORK APPROACHES FOR
AUTOMATED SEGMENTATION AND CLASSIFICATION OF
MRI BRAIN IMAGES
1 MRS.P.MUTHUKRISHNAMMAL, 2 DR.S.SELVAKUMAR RAJA
1
Research Scholar, Sathyabama University, Chennai-119, Tamil Nadu, India.
2
Dean, Arunai Engineering College,Thiruvannamalai,Tamil Nadu, India E-mail: 1 [email protected], 2 [email protected]
ABSTRACT
Nowadays the application of image processing for medical imaging is increasing enormously and the most common medical images such as Ultrasound, x-ray, CT, digital mammography, and MRI are that are stored and represented in soft-copy. An MRI can give different grey levels for different tissues and various types of neuropathology and its analysis involves: Data acquisition, processing, and visualization stages. Medical image segmentation plays a very important role in most of the computer-aided diagnostic tools [1]. Brain tumor detection is one of the most difficult and important for medical diagnosis. Even by an expert physician it consumes a lot of energy and time to get the accurate location of the tumor.These tools could save clinicians’ time by simplifying complex time-consuming processes. The main part of these tools is to design an efficient segmentation algorithm. Mostly the medical images contain noise whose behaviour is not predictable, in-homogeneities, and complex structures. Therefore, segmentation of medical images is a very challenging and complicated task. In this paper we propose new approach wherein the features of MR images are extracted using curvelet transform via wrapping based method in combination with the Haralick parameters. The features which are obtained from the coefficients of curvelet transform is used as the database for the further classification stage which is neural network based (PNN) classifier for the classification stage and it categorizes the brain tumour that belong to benign and malignant types. Finally the K-Means clustering based segmentation algorithm is used for segmenting the abnormal brain tumour region which is the region of interest which can be used for further diagnosis process by the oncologists.
Keywords: MRI, Classification, Segmentation, Curvelets, K-Means Segmentation, PNN classifier
1.
INTRODUCTIONBrain images are mainly grouped into three major types of tissue regions namely: WM (White Matter), GM (Gray Matter) and CSF(Cerebral Spinal Fluid). Brain tumor normally affects CSF. Hence, it is given greater importance than the others. Tumors are classified mainly into two types: Benign and Malignant. Benign tumor is the initial form of tumor and it is easy to detect. Whereas, malignant tumor is very difficult to detect and causes even death as it affects the spinal cord which may cause strokes. In this paper, the proposed method involves four basic steps: feature extraction, classification, segmentation and performance analysis. feature extraction by curvelet decomposition, GLCM and Haralick parameters, classification by Probabilistic Neural Networks, segmentation by K-means algorithm and performance analysis using confusion matrix
parameters (classification accuracy) like segmentation accuracy, sensitivity and specificity. In the rest of the paper, literature survey of the existing methods are explained in section 2, a curvelet based feature extraction and segmentation and classification algorithms for the proposed method is explained in section 3 and the experimental results and comparison of parameters with the previous method are illustrated section 4. The proposed algorithm is concluded with the future work in section 5.
2. LITERATURE SURVEY
grouping the pixels according to the similarities among the characteristics. In the proposed k-means algorithm initially define the number of clusters 'k' are defined. Then k-cluster centers are chosen randomly. The distance between each pixel to each cluster centers are calculated.
Using the Euclidean distance formula, single pixel is compared to all cluster centers. The pixel is moved to a particular cluster which has shortest distance amongst all. Then the centroid is re-calculated. Again each pixel is compared to all centroids. The process continuous until the centre converges. This algorithm is considered best for noiseless images [2].
HariPrasath S.P et al had proposed a new medical image segmentation method based on Enhanced fuzzy c- means (EFCM) algorithm and YCbCr color model. Firstly, the contrast applied MRI is converted into YCbCr color model then the image was being classified into the region of interest using EFCMs algorithm. The method was capable of solving exactly contoured lesion objects problem in MRI image by adding the color-based segmentation operation. The key idea of color-converted segmentation algorithm with EFCMs was to solve the given MRI image by converting the input grey-level image into a colour space image and operating the image labeled by cluster [3]. The proposed EFCM method used the following weighted function
A two-dimensional Fuzzy C-Means (2DFCM) algorithm was proposed by Jinhua Yu and Yuanyuan Wang for the molecular image segmentation. The 2DFCM algorithm was composed of three stages. The first stage was the noise suppression by utilizing a method combining a Gaussian noise filter and anisotropic diffusion techniques. The second stage was the texture energy characterization using a Gabor wavelet method. The third stage was introducing spatial constraints provided by the de-noising data and the textural information into the two dimensional fuzzy clustering using the formula below:
Where mj, j = 1, 2, . . . ,c, represent the cluster
prototypes, μi j gives the membership of pixel xi in
the jth cluster mj and c is the total number of
clusters. The incorporation of intensity and textural information allows the 2DFCM algorithm to produce satisfactory segmentation results for images corrupted by noise (outliers) and intensity variations [4].
Shan Shen, et al proposed a new method of segmentation called Improved Fuzzy C Means in which a neighborhood attraction, which is dependent on the relative location and features of neighboring pixels, was shown to improve the segmentation performance dramatically. In this method a robust method of segmentation was used with Artificial Neural Network. Among the clustering techniques the fuzzy c-means (FCM) clustering and expectation–maximization (EM) algorithms were considered the most prominent. Here, an attraction called neighborhood attraction was considered to exist between neighboring pixels according to the formula below,
Where is the feature extraction and represents distance attraction. During clustering, each pixel attempts attract its neighboring pixels toward its own cluster. This neighborhood attraction was depending on two factors such as the feature attraction or pixel intensities, and the distance attraction i.e., spatial position of the neighbors, which also relies on the neighborhood structure. Compared to other FCM-based methods, IFCM offers better continuity and simpler computation [5].
S.ZulaikhaBeevi et al proposed a novel and efficient Fuzzy Spatial C-means Clustering algorithm which is being robust to noise. The proposed clustering algorithm used fuzzy spatial information to calculate membership value. The main fact of this algorithm was to incorporate the spatial neighbourhood information into the standard FCM algorithm by a prior probability. The major advantage of the algorithm was its simplicity, and allows it to run on large datasets. The proposed algorithm is histogram based hence the convergence was quick as the whole image need not be used [6].
functions which makes it a powerful tool with applications such as data mining and medical imaging applications. Then pre-processing of the segmented tumour image based on 2D discrete wavelet decomposition: It is an important step which is used to extract the texture features of an image. The two level of decomposition gives rise to four sub-bands. After that feature extraction and feature selection process, wherein17 spatial features are extracted from the two-level wavelet approximation tumour image by using both dominant grey-level run length and co-occurrence matrix method. And finally the classification process where a given number of test samples are assigned to a class based on knowledge gained by the classifier during the training phase of the neural network. [7]
Neelum et al proposed a hybrid method technique that makes use of both wavelet transform and FCM. Firstly, Wavelet transform is applied to the input MR image to obtain four sub bands namely LL, LH, HL and HH. Approximation co-efficients in LL are set equal to zero and inverse wavelet transform is applied to obtain a high pass image. The images are sharpened and FCM algorithm is applied. In FCM segmented image some of the edge information is missing. To fill the missing edge information the Kirch's edge detection mask is used here. Discrete Wavelet Transform (DWT) provides frequency information as well as time-space location. Hence both the methods together give accurate edge details with multi-resolution [8].
Ridgelet transform is an anisotropic geometric wavelet transform, was proposed by Candes and Donoho. The ridgelet transform is better for representing straight-line singularities. This transform with arbitrary directional selectivity provides a key to the analysis of higher dimensional singularities. But, the ridgelet transform is only applicable to objects with global straight-line singularities, which are rarely seen in real applications. A natural idea to analyze local line or curve singularities is to consider a partition of the image, and then apply the ridgelet transform to the resulting sub-images. This block ridgelet based transform, which is named curvelet transform, but the geometry of ridgelets is itself not clear, as they are not true ridge functions in digital images. So another simpler curvelet transform based on a frequency partition technique was proposed .The curvelet transform is a multiscale pyramid with many directions and positions at each length scale, and also needle-shaped elements at fine scales. This pyramid is nonstandard, but curvelets have useful geometric features and the curvelets obey a
parabolic scaling relation. Curvelets are used for optimal sparse representation of objects with edges, optimal sparse representation of wave propagators and also optimal image reconstruction in severely ill-posed problems [9, 10].
3. PROPOSED METHOD
3.1 Methodology Overview
Here, the MR images are collected from publicly available resource. First the image is converted into a format that is capable for further manipulation by the computer. By using MATLAB, the MR images are converted into matrices form. Then the features of the images are extracted using the Fast Discrete Curvelet Transform. Here fast discrete curvelet transformation is used to analyze texture of an image which is to be used as a base for a Computer Aided Diagnosis (CAD) system .The features extracted contains a dataset which is further divided into training dataset and test dataset. The training images are converted into the transformed domain and the coefficients are used as the prototypes for probabilistic neural network. For the testing set, the images are converted to the transformed domain and the approximate coefficients serves as the feature set. The test images are fed into the PNN combined with Radial Bias Function classifier for being classified. It classifies the stage of Brain Tumor that is benign, malignant or normal automatically. Then the MR image segmentation is done using K-Means clustering which segments the abnormal region of the brain. Lastly, performance based on the result will be analyzed for the proposed method and it shows promising results than K-Means Clustering algorithm.
3.2 Images Acquisition
The proposed approach is applied to analyze the simulated MRI images taken from publicly available sources. This dataset consists of 50 brain MR images in which 40 images with tumor and the remaining brain images are normal and the dataset is divided as training dataset and testing dataset.
3.3Texture Analysis
3.3.1 Feature extraction and analysis
Feature analysis is a quantitative method to quantify and detect structural abnormalities in different brain tissues. As the tissues present in the brain are very difficult to classify using the shape or the grey-level intensities, texture feature extraction is very important for further classification. Texture is that innate property of all surfaces that describes visual pattern that contains important information about the structural arrangement of the surface also characterized by the spatial distribution of gray levels in a neighborhood. The features are extracted by using the FDCT decomposition and also grey-level co-occurrence matrix (GLCM).
3.3.2 Fast discrete curvelet Decomposition
The two fast discrete curvelet transforms (FDCTs) which are simpler, faster, and less redundant are of: Curvelets via USFFT, and Curvelets via Wrapping. Both FDCTs run in O (n2 log n) flops for n by n Cartesian arrays, which are also invertible, with rapid inversion algorithms which have the same complexity. The curvelet transform which are faithful to the mathematical transformation. These digital transformations are linear and take as input Cartesian arrays of the form f[t1, t2], 0 ≤ t1, t2 < n, which allows to think of the output as a collection of coefficients cD(j, , k)
obtained by the equation
where each is a digital curvelet waveform. In this work, the FDCT via wrapping is used and its algorithm is as follows:
Fast Discrete Curvelet Transform via Wrapping:
The algorithm for FDCT via wrapping is as follows:
1. Apply the 2D FFT and obtain Fourier samples [n1, n2], −n/2 n1, n2 < n/2.
2. For each scale j and angle l,, form the product [n1, n2] [n1, n2].
3. Wrap this product around the origin and obtain
j, [n1, n2] = W( )[n1, n2], where the range
for n1 and n2 is now 0 n1 < L1,j and 0 n2 < L2,j (for θ in the range (−π/4, π/4)).
4. Apply the inverse 2D FFT to each j, hence collecting the discrete coefficients CD(j, , k).
Figure2: FDCT Via Wrapping
3.3.3 Gray-Level Co-Occurrence Matrix (GLCM)
A mathematical definition of the co-occurrence matrix was proposed by R.M. Haralick. Haralick et al. proposed 14 features computed using the Gray Level Co-occurrence Matrix (GLCM), which is a structure that describes the co-occurring intensity values at a given offset [11]. In other words, the GLCM provides information on how often a gray level occurs at different directions. Usually, we consider four directions in the 2D case: ߶ = 0 ∘, =
45 ∘, = 90 ∘, and ߶ = 135 ∘. However, Haralick et.al
suggest that using the mean value, the features computed for the four directions to guarantee rotation invariance. Moreover, symmetric GLCM (i.e., taking into account voxels separated by −݀and
݀voxels) is a common choice in image analysis. Thus, the GLCM, matrix defined as ܩ߶݀(݅, ݆), is a
square matrix of size ܰ, where ܰis the total number of voxels in the window, so that (݅, ݆) entry represents the number of co-occurrences of gray levels ݅and ݆for voxels separated at a distance ݀in direction ߶ The dominant grey-level run length matrix φ(d, θ) is given by the formula,
The grey-level co-occurrence matrix ¢ (d, θ) is,
and the resulting sets of statistical measures computed are called feature vectors.
Energy: The gray-scale image texture measure of homogeneity changing which reflects the distribution of image gray-scale uniformity of weight and texture.
Where, p(x,y) is the GLCM
Contrast: It is the main diagonal near the moment of inertia, which measure the value of the matrix is distributed and images of local changes in number, reflecting the image clarity and texture of shadow depth.
Correlation Coefficient: It measures the joint probability occurrence of the specified pixel pairs. Correlation :∑∑(x- μx)(y-μy)p(x , y)/σxσy)
Homogeneity: It is the measure of the closeness of the distribution of elements in the GLCM to the GLCM diagonal.
Homogeneity =∑∑ (p(x, y)/(1 + [x-y]))
3.3.4 Probabilistic Neural Network classifier
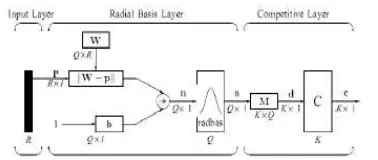
[image:5.595.307.496.526.606.2]The Probabilistic Neural Network (PNN) was first proposed in[13]. In this neural network, the operations are organized into multilayered feed forward network which has four layers : input layer, pattern layer, summation layer and output layer. PNNs are a special form of Radial Basis Function (RBF) network used for classification. The architecture of a PNN is shown in Fig :3
Figure 3: Architecture of Probabilistic Neural Network
The input layer unit does not perform any computation and simply distributes the input to the neurons in the pattern layer. On receiving a X
pattern from the input layer, the output of the pattern layer is computed by,
where ‘d ‘denotes the dimension of the pattern vector x , σ is the smoothing parameter and Xij is the neuron vector. the maximum likelihood of pattern X being classified into Ci is computed by
the summation layer neurons by summarizing and averaging the output of all neurons that belong to the same class
Where Ni denotes the total number of samples in
class Ci . And the decision layer classifies the
output based on the summation of all neurons, based on Bayesian classification as
Where (x) denotes the estimated class of the pattern X and m is the total number of classes in the training samples. The PNNs are a special form of RBF network which maps any input pattern to a number of classifications. If the output depends on the distance of the input from the given stored vector, then it is called radial basis. It is a kind of FFNN where each unit in the hidden layer includes a RBF, as the activation function. The positions and the weight associated are learnt from training patterns. The PNN network architecture with RBF is shown in fig 4.
Here the classification problem considered is the two class problem, namely benign class and malignant class. The dataset is divided as training dataset and testing dataset. The output resulted as benign case, malignant or normal case.
Figure4: The PNN with RBF Network Architecture
The weights of the hidden layer need to be set by using “training data”. Hence, the images were divided into training and testing datasets. Out of fifty images, five images were selected as “test data” while the remaining were used for training. The training data was used to the PNN as inputs and the weights of the hidden layer are calculated and the classification of the images was done.
A cluster is a collection of objects which are similar between them and are dissimilar to the objects belonging to other clusters. Clustering is one of the unsupervised learning methods which deal with finding a structure in a collection of unlabeled data. It is the process of forming objects into groups whose members are similar in some properties. K-means clustering is an algorithm to group objects based on attributes/features into k number of groups where k is a positive integer. The clustering is done by minimizing the Euclidean distance between data and the corresponding cluster centroid [2].
K-Means algorithm
The purpose of k-means algorithm is to cluster the data. K-means algorithm is one of the popular and simplest partitions clustering method. K-Means is the one of the unsupervised learning algorithm for clusters. In the k-means algorithm initially we have to define the number of clusters k. Then we choose k-cluster centres randomly. Using the Euclidean distance function, the distance between the each pixel to each cluster centers are calculated. Each single pixel is compared to all cluster centers using the distance formula. Then the pixel is moved to a particular cluster which has shortest distance among all. Then we re-estimate the centroid. Again each pixel is compared to all centroids, which continues until the center converges.
For a given cluster assignment C of the data points, compute the cluster means. For a current set of cluster means, assign each observation as C(i) and above two steps are iterated until convergence.
Algorithm:
1. Give the no of cluster value as k.
2. Randomly choose the k cluster centers
3. Calculate mean or center of the cluster
4. Calculate the distance between each pixel to each cluster center
5. If the distance is near to the center then move to that cluster
6. Otherwise move to next cluster. 7. Re-estimate the center.
4. EXPERIMENTAL RESULTS
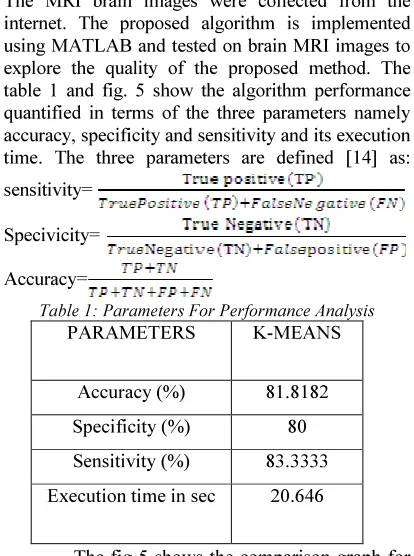
The MRI brain images were collected from the internet. The proposed algorithm is implemented using MATLAB and tested on brain MRI images to explore the quality of the proposed method. The table 1 and fig. 5 show the algorithm performance quantified in terms of the three parameters namely accuracy, specificity and sensitivity and its execution time. The three parameters are defined [14] as: sensitivity=
Specivicity=
Accuracy=
Table 1: Parameters For Performance Analysis
PARAMETERS K-MEANS
Accuracy (%) 81.8182 Specificity (%) 80 Sensitivity (%) 83.3333 Execution time in sec 20.646
[image:6.595.303.510.212.490.2]The fig 5 shows the comparison graph for the different parameters of the classifier:
Figure 5: comparison of classifier performance parameters
4.1. Simulation Results
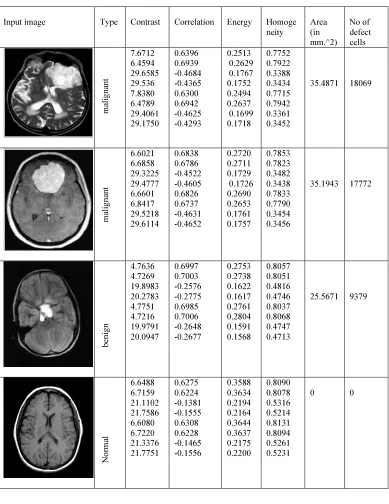
The table 2 shows the MRI image and the feature extracted using curvelet decomposition by
[image:6.595.304.505.520.699.2]homogeneity and the values at different are given in the tabular column. The features extraction stage contains a dataset which is further divided into training dataset and test dataset. The training images are converted into the transformed domain and the coefficients are used as the prototypes for probabilistic neural network. For the testing set, the
[image:7.595.85.474.228.732.2]images are converted to the transformed domain and the approximate coefficients serves as the feature set. The test images are fed into the PNN combined with Radial Bias Function classifier for being classified. The table 3 shows the results of k-means segmentation of the different images.
Table 2: Features Extracted From The Images:
Input image
Type Contrast Correlation Energy Homoge neity Area (in mm.^2) No of defect cells ma li g n an t 7.6712 6.4594 29.6585 29.536 7.8380 6.4789 29.4061 29.1750 0.6396 0.6939 -0.4684 -0.4365 0.6300 0.6942 -0.4625 -0.4293 0.2513 0.2629 0.1767 0.1752 0.2494 0.2637 0.1699 0.1718 0.7752 0.7922 0.3388 0.3434 0.7715 0.7942 0.3361 0.3452
35.4871 18069
ma li g n an t 6.6021 6.6858 29.3225 29.4777 6.6601 6.8417 29.5218 29.6114 0.6838 0.6786 -0.4522 -0.4605 0.6826 0.6737 -0.4631 -0.4652 0.2720 0.2711 0.1729 0.1726 0.2690 0.2653 0.1761 0.1757 0.7853 0.7823 0.3482 0.3438 0.7833 0.7790 0.3454 0.3456
35.1943 17772
b en ig n 4.7636 4.7269 19.8983 20.2783 4.7751 4.7216 19.9791 20.0947 0.6997 0.7003 -0.2576 -0.2775 0.6985 0.7006 -0.2648 -0.2677 0.2753 0.2738 0.1622 0.1617 0.2761 0.2804 0.1591 0.1568 0.8057 0.8051 0.4816 0.4746 0.8037 0.8068 0.4747 0.4713
25.5671 9379
N o rm al 6.6488 6.7159 21.1102 21.7586 6.6080 6.7220 21.3376 21.7751 0.6275 0.6224 -0.1381 -0.1555 0.6308 0.6228 -0.1465 -0.1556 0.3588 0.3634 0.2194 0.2164 0.3644 0.3637 0.2175 0.2200 0.8090 0.8078 0.5316 0.5214 0.8131 0.8094 0.5261 0.5231
b
en
ig
n
5.0425 5.1098 20.5359 21.2498 4.9900 5.1117 20.8159 21.1546
0.6831 0.6847 -0.2816 -0.2917 0.6838 0.6821 -0.2830 -0.2973
0.2591 0.2646 0.1607 0.1619 0.2621 0.2705 0.1649 0.1682
0.7926 0.7964 0.4682 0.4626 0.7915 0.7979 0.4705 0.4685
11.7057 1966
Table3: Output Of K-Means Segmentation For The Different Images:
TEST IMAGE CURVELET
TRANSFORM
K-MEANS SEGMENTED RESULTS
ABNORMAL REGION DETECTION
MALIGNANT
BENIGN
NORMAL
5. CONCLUSION
There are different types of tumors available. They may be benign or malignant over the brain. This work presented the automated brain image classification for early stage abnormality detection with use of neural network classifier and spotting of tumor was done with image segmentation. We proposed a new tumor classification based on discrete curvelet transform in which multi-level transformation is possible. Pattern recognition was performed using probabilistic neural network with radial basis function and pattern was characterized with the help of FDCT and Haralick features analysis. The noise free image is given as input to the k-means and tumor is extracted from the MRI image and algorithm is enough to extract it if the tumor is a mass The proposed method gives more accurate result. The future work concentrates on segmentation using Fuzzy C means and other segmentation algorithms and with different types of classifiers for accurate tumor shape extraction of malignant tumor. Also As another extension, a toolbox can be developed in MATLAB to convert 2-dimensional images into 3-dimensional. A 3D image will be useful for the oncologists at the time of surgery.
REFERENCES:
[1] Mohammad.A.Balafar, Abdul-Rahman Ramli, Syamsiah Mashohor, "Brain magnetic resonance image segmentation using novel improvement for expectation maximizing,” Neurosciences 2011; Vol. 16,pp242-247. [2] P.Dhanalakshmi and T.Kanimozhi ,”Automatic
Segmentation of Brain Tumor using K-Means Clustering and its Area Calculation, International Journal of Advanced Electrical and electronics Engineering (IJAEEE) ISSN (Print) : 2278-8948,Volume-2, Issue-2, 2013,pp130-134
[3] HariPrasath S.P, G.KharmegaSundararaj, A.Jayachandran “Brain Tumor Segmentation of Contrast Material Applied MRI Using Enhanced Fuzzy C-Means Clustering”, International Journal of Engineering and Innovative Technology (IJEIT) Volume 1, Issue 2, February 2012,pp161-166
[4] Jinhua Yu and Yuanyuan Wang, “Molecular Image Segmentation Based on Improved Fuzzy Clustering” in International Journal of Biomedical Imaging Volume 2007, Article ID 25182, 1-10 pages
[5] Shan Shen, William Sandham, Shan Shen, William Sandham, Member, IEEE, Malcolm Granat, and Annette Sterr, “MRI Fuzzy
Segmentation of Brain Tissue Using Neighborhood Attraction With Neural-Network Optimization” in IEEE Transactions on Information Technology in Bio Medicine,Vol.9,No 3, Sept 2005.
[6] S.ZulaikhaBeevi, M.MohammedSathik, K.Senthamaraikannan “A Robust Fuzzy Clustering Technique with Spatial Neighborhood Information for Effective Medical Image Segmentation” in (IJCSIS) International Journal of Computer Science and Information Security, Vol. 7, No. 3, March 2010
[7] Padma Nandhagopal.A, Sukanesh.R, “Wavelet Statistical Texture Features-Based Segmentation And Classification Of Brain Computed Tomography Images” in IET Image Process., 2013, Vol. 7, Iss. 1, pp. 25–32 25 doi:10.1049/iet-ipr.2012.0073 & The Institution of Engineering and Technology 2013
[8] Neelum Noreen, Khizar Hayat and Sajjad A. Madani “MRI Segmentation through Wavelets and Fuzzy C-Means” in World Applied Sciences Journal 13 (Special Issue of Applied Math): 34-39, 2011 ISSN 1818-4952 © IDOSI Publications, 2011
[9] E. Candes, D. Donoho, “Continuous curvelet transform: II. Discretization and frames”, Appl. Comput. Harmon. Anal., 19, 198-222 (2003). [10] Emmanuel Candes, Laurent Demanet, “Fast
Discrete Curvelet Transforms, March2006, pp1-44
[11] Andrés Ortiz, Antonio A. Palacio, Juan M. Górriz, “Segmentation of Brain MRI Using SOM-FCM-Based Method and 3D Statistical Descriptors,Hindawi Publishing Corporation Computational and Mathematical Methods in MedicineVolume 2013, Article ID 638563, 12 pages
[12] R. M. Haralick, K. Shanmugam, and I. Dinstein, “Textural features for image classification,” IEEE Transactions on Systems, Man and Cybernetics, vol. 3, no. 6, pp. 610– 621, 1973
[13]D. F. Specht, “Probabilistic neural networks,” Neural Networks, vol. 3, no. 1, pp. 109–118, 1990.