Pathways
Thesis by
Kibeom Kim
In Partial Fulfillment of the Requirements for the Degree of
Doctor of Philosophy
CALIFORNIA INSTITUTE OF TECHNOLOGY Pasadena, California
2019
© 2019
Kibeom Kim
ORCID: 0000-0002-0764-4875
ACKNOWLEDGEMENTS
ABSTRACT
PUBLISHED CONTENT AND CONTRIBUTIONS
1. Kim, K. & Goentoro, L. Choosing the right input in cell signaling. Science
361,643–644 (2018).
https://doi.org/10.1126/science.aau6457
K.K participated in writing of the perspective.
2. Kim, K. et al. Two-element transcriptional regulation in the canonical Wnt pathway.Current Biology27,2357–2364 (2017).
https://doi.org/10.1016/j.cub.2017.06.037
TABLE OF CONTENTS
Acknowledgements . . . iii
Abstract . . . iv
Published Content and Contributions . . . v
Table of Contents . . . vi
List of Illustrations . . . vii
Chapter I: Introduction . . . 1
1.1 Bibliography . . . 11
Chapter II: Investigating memory inβ-catenin and Smad3 dynamics . . . 14
2.1 Introduction . . . 14
2.2 Results . . . 18
2.3 Discussion . . . 26
2.4 Materials and Methods . . . 28
2.5 Supplementary Figures . . . 32
2.6 Work Contributions . . . 35
2.7 Bibliography . . . 36
Chapter III: Two element transcriptional reguation in the Canonical Wnt pathway 40 3.1 Introduction . . . 40
3.2 Results . . . 41
3.3 Discussion . . . 52
3.4 Materials and Methods . . . 54
3.5 Supplementary Figures . . . 59
3.6 Supplementary Information: Modeling analysis of incoherent feed-forward loop . . . 63
3.7 Work Contributions . . . 66
3.8 Bibliography . . . 67
Chapter IV: Conclusions . . . 70
LIST OF ILLUSTRATIONS
Number Page
1.1 Structure of signaling pathways . . . 3
1.2 Memory of protein levels . . . 7
2.1 Variability of second messengers in signaling pathways . . . 14
2.2 Wnt and Tgfβsignaling pathways. . . 18
2.3 Crispr-Cas9 mediated genomic fusion of β-catenin and Smad3 with fluorescent reporters. . . 19
2.4 Characterization of fluorescence-fusion β-catenin and Smad3 . . . . 20
2.5 CV and memory of β-catenin and Smad3 . . . 22
2.6 Signaling affects CV and memory of second molecules . . . 24
2.7 Cellular context modulates variability and memory of β-catenin and Smad3 . . . 25
S2.1 Fluorescence fusion second proteins activate target genes . . . 32
S2.2 Fluorescence tracking and digital synchronization . . . 33
S2.3 Variability and memory of β-catenin with blocking of Wnt secretion . 34 S2.4 β-catenin and Smad3 concentrations over a cell cycle . . . 35
3.1 Endogenous genes show regulation not captured by WRE. . . 42
3.2 A suppressive 11-bp NRE is necessary forsiamoisregulation . . . . 44
3.3 The 11-bp NRE binds to β-catenin and Tcf . . . 46
3.4 11-bp NREs regulateBrachyury (T)in mouse embryonic stem cells. . 51
S3.1 Rescue of suppression by 11-bp NRE was observed with even shorter promoters . . . 59
S3.2 11-bp NREs interact withβ-catenin and Tcf3, but not other transcrip-tion factors . . . 60
S3.3 Predicted 11-bp NREs interact with TCFs and β-catenin . . . 61
S3.4 Analysis of β-catenin Chip-Seq on HCT-116 cells . . . 62
S3.5 Model IFFL circuits in the Wnt pathway . . . 63
C h a p t e r 1
INTRODUCTION
Decision making and information transfer in biology
Life adds an interesting layer to the physical world with its teleonomic property, which can be best described as ‘purpose-driven behavior that emerges from physical law’[1]. Any physical reaction that is touched by life can be weighed in relation to a subjective purpose and thus gains a layer of consequence. An otherwise indifferent mass emission of thermal energy from combustion of hydrocarbons could be viewed as costly for survival of organisms in the immediate vicinity of the reaction, but beneficial for other organisms such as pine trees that require such energy for reproduction [2]. The consequences can therefore be measured in cost and benefit, and can further decompose into specific values such as risk, utility, and efficiency.
The consequences of physical reactions that an organism could encounter or embody are closely intertwined with behaviors of the organism, as these behaviors could harness, avoid, or cope with the reactions. In this light, a set of behaviors that triggers specific events with costs or benefits for an organism could be considered a decision. Decision making generally requires information for the biological actor. For a mouse, the flight and freeze response is triggered by visual stimulus of an approaching, looming shadow [3]. For E.coli, a decision to synthesize proteins required to import and digest lactose require the cell to sense paucity of glucose and abundance of lactose [4]. Indeed, analyzing how specific information is sensed, transduced, and interpreted is essential in investigating the design and evolution of decision-making modules in biology.
of allolactase (metabolite of lactose) and activation requiring catabolite activator protein (triggered in low cAMP levels) at the transcriptional site oflacgenes gives rise to a transcriptional ‘AND’ gate that initiates only when glucose levels are low and lactose levels are abundant. As we will soon cover, architecture of metazoan decision making modules can be far more complex in structure and functions.
In my thesis, I focus on information transfer in metazoan signaling pathways that enable a community of cells to coordinate decision making. In the first part of the thesis, in collaboration with Chris Frick, I characterized variability in the temporal dynamics of signaling proteins, and investigating how memory may be encoded by the dynamics. In the second part of the thesis, in collaboration with Jaehyoung Cho and Thomas Hilzinger, I uncovered a novel mechanism of transcriptional regulation in the Wnt pathway that enables decoding of dynamic information encoded in signal transduction. Before unwrapping these topics, I would first like to cover relevant background on information transfer in signaling pathways that motivate the research in my thesis.
Multi-cellular decision making and signaling pathways
A multicellular organism requires communication within its members for regula-tion of roles and coordinaregula-tion of activity to facilitate shared goals of survival and reproduction as a whole. Consider development, an indispensable process for mul-ticellular life: each cell in the developing embryo must express a proper set of genes and mobilize based on its relative location and time point, thus deciding cell fate for itself and its daughters. Precise coordination is required for a single fertilized egg to develop into a mature organism such as a person, where trillions of cells have determined their respective role among hundreds of possible cell types encoded by the genome [5, 6]. Each cell requires significant contextual information to achieve this extraordinary feat of spatiotemporal coordination. Much of the information is already encoded within the cell, with memory of past decisions and context manifest in forms such as epigenetic regulation and existing configuration of gene expression [7]. This encoding by intracellular modules allow organization of cell fates into a hierarchical tree of development [8], or - in another perspective- flexibly defined tra-jectories in Waddington’s landscape [9], in which past decisions alter the probability of potential fates.
other cells nearby and over long distances. Seven metazoan signaling pathways have emerged early in evolutionary history to fulfill this need of intercellular information transfer: Tgf-4β, canonical Wnt, nuclear receptors (NR), receptor tyrosine kinase (RTK), the Notch/Delta, Hedgehog, and Janus kinase/signal transducer and activator of transcription (JAK/STAT) pathways [10, 11]. Functional pathways in the list can be observed in organisms as ancient in the phylogenetic tree as cnidarians (jellyfish) and ctenophores (comb jellies). Moreover, core components of the pathways are highly conserved from cnidarians to vertebrates.
How signaling pathways function in a cell
How do signaling pathways carry out intercellular communication? Signaling path-ways are composed of signaling ligands that travel in extracellular space, receptors that detect the ligands, and intracellular network of proteins that transduce the signal for response within the cell. (Figure 1.1)
Transmembrane receptor Plasma membrane Signaling Ligands Co-receptor Nucleus Transcriptional Regulation Second messengers Axin APC βcat Axin APC GSK DC
βcat βcat
[image:10.612.141.469.334.546.2]DC DC βcat DC Wnt P P P P P APC βcat Transcriptional Regulation Dvl AA B
Figure 1.1: Structure of signaling pathways
(A) Example illustration of signalosome at the membrane- composed of signal lig-ands, receptors, transduction components, and second messengers.
(B) Example illustration intracellular signaling transduction network: Wnt trans-duction pathway
triggers oligomerization and conformational change that activate the intracellular domains of the receptors. Once activated, the intracellular signaling domains of the receptors recruit a variety of factors such as kinases and scaffolding proteins necessary for signal transduction, forming a signalosome complex (Figure 1.1A). From the signalosome complex, a cascade of biochemical reactions propagates, which ultimately leads to accumulation of pathway specific transcription factors, also known assecond messengers/ signal proteins, that regulate gene expression in the nucleus (Figure 1.1B).
While following the aforementioned generality, the molecular architecture of signal transduction are quite divergent in signaling pathways. For example, the signalo-some activation in the Wnt pathway recruits and inactivates main components of β-catenin degradation complex, allowing β-catenin to stabilize, complex with Tcf transcription factors, and translocate to the nucleus for gene regulation [13]. in the Tgf-βpathway, Smad, a second messenger, is activated by the signalosome through phosphorylation, associates with common partner Smad, and translocates into the nucleus [14]. In contrast, in the Notch/Delta pathway, Notch has a dual role as both signaling receptor for Delta ligand and second messenger after cleavage following ligand binding [15].
Based on the general structure, information transfer through signaling pathway seems quite straightforward: information in the form of signaling ligands is detected by receptors, transduced by activation and accumulation of second messengers, and decoded into transcriptional response in the nucleus. Modulation at different steps of signaling, however, allows for high complexity in information transfer.
Information transfer through dynamics of second messengers
The extent of complexity in signaling pathways is staggering. Each pathway has multiple homologous signaling ligands and receptors allowing combinatorial speci-ficity of ligand-receptor complexes: varying cellular response depending on spe-cific ligand-receptor signalosome is ubiquitous in signaling pathways. The receptors have ancillary chaperones and co-receptors that affect ligand binding and selectivity. Crosstalk introduces combinatorial effect of information transfer between signaling pathways.
In the decoding layer of signaling pathways, second messengers can interact with multitudes of transcription factors (TFs)- activators, repressors, epigenetic factors, inhibitors, etc. These interactions are controlled spatiotemporally, such as timing of specific TF expression or locales of TF binding sites in the genome. Further, the target gene output from signaling pathways can be linked to negative or positive regulation of pathway activation, creating feedback control.
Transfer of complex information from the signalosome to the transcriptional re-sponse in the nucleus depends on second messengers. Richness of information seems to inpart derive from dynamics of signal proteins. Dynamics can be defined as ‘spatiotemporal patterns of activity’ [16]: in signaling, it describes behavior of proteins over time in a set spatial arrangement, e.g. accumulation in the nucleus, export into extracellular space, etc. Aspects of dynamics can be characterized in terms such as amplitude, duration, and frequency of activity.
Noise and variability in second messenger dynamics
That genetically identical cells in homogeneous conditions can have variability in their decision-making has been an often-repeated observation made as early as the 1970s [23]. An exemplary case of this phenomenon in metazoan system is presented in decision making for apoptosis in cells exposed to TRAIL (TNF-related apoptosis inducing ligand) [24]. In the study, the investigators reported heterogeneous response in clonal cell lines, with variance in time to death after TRAIL exposure, where some cells did not die at all. Upon analysis of relevant factors in sister cells, the authors concluded that variability in several proteins exert combinatorial control in an important kinetic rate in the apoptotic decision. Further, they demonstrated that there is a degree of heritability from the mother cell that decays over time, suggesting a time frame of memory that carries over a cell generation.
At the biochemical level, protein levels between cells may vary due to inherent stochasticity in diverse processes such as transcription, translation, and degradation. For second messengers bound within the network of the pathway, propagation of noise from other proteins in the network could contribute to the variability. For example, analysis of the mathematical model of the Wnt pathway [25], generated from measured pathway kineticsin vivo, revealed that β-catenin is highly sensitive to variation in in the factors in the pathway such as scaffolds and kinases in the β-catenin degradation complex [26]. Certain features of the network can also reduce variability: negative feedback reduces noise at the cost of limiting the dynamic range of the second messenger [27, 28].
31]. In other words, the dynamic output of signaling molecules were much more consistent when calculating fold change of activated level over basal level, and transcriptional output of some target genes correlated more closely to the fold change than to the absolute levels.
Memory and temporal profiles of variability
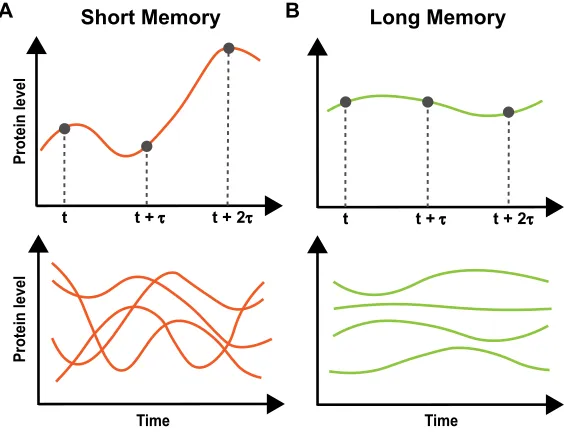
Closely related to phenomenon of cell-to-cell variability is the temporal profile of variability within each cell. Population variability arises as protein levels or reaction rates in each cell to deviate from the population norm. As important to how the variation is manifest in the population is how the variability behaves across time through fluctuations in individual cells. For example, protein levels in two populations may have identical variability in a static measure such as standard deviation, but frequency and amplitude of fluctuations in protein levels between cells of the two populations could be drastically different.
Protein level
t t +τ t + 2τ Short Memory
t t +τ t + 2τ Long Memory
Protein level
Time Time
[image:14.612.166.451.334.551.2]A B
Figure 1.2: Memory of protein levels
(A) Top: An example trace of protein levels over time with short memory. Fluctu-ations cause correlation between time points to decay quickly with increasing time interval (τ)
Bottom: How protein levels in a population may behave with short memory
(B) Top: An example trace of protein levels over time with long memory. Stable levels cause correlation between time points to decay slowly with increasing time interval (τ)
Bottom: How protein levels in a population may behave with long memory
fluctu-ations, defined as ‘the rate of decay of statistical dependence of two points with increasing time interval between the two points’ (Figure 1.2) [33]. In the aforemen-tioned case of cells’ apoptotic decision-making, memory of factors that determine apoptotic outcome is shorter than a cell cycle, leading sister cells to diverge in their decisions within one generation.
Using single cell analysis, two studies have focused on investigating memory and variability of protein levels: Austinet al. (2006) investigated memory of destabilized GFP expressed by synthetic gene circuits inE.coli, demonstrating strong influence of degradation and dilution on memory [34]. The authors further showed that introduction of negative autocorrelation led to dampening of noise amplitude and shorter memory profiles. Sigalet al. (2006), investigated variability and memory of endogenous housekeeping genes in human cell lines, demonstrating that proteins have distinct memory profiles and that memory has close correlation with variability [35].
Memory in signaling second messengers
Thus far, memory of Metazoan second messengers of signaling pathways has not been characterized except in cases that exhibit oscillations and frequency modula-tion in signal dynamics [36, 37]. Although both Wnt and Tgf-βsignaling pathways have negative feedback components that could theoretically enable periodicity in their respective second messengers, evidence from the dynamics do not suggest os-cillations nor frequency modulation in either pathways [38–40]. Because signaling dynamics carry important weight in information transfer, we propose to investigate how memory and temporal variability operates in second messengers and affects cellular decision making. In Chapter 2 of this thesis, I cover a collaborative effort between Chris Frick and myself that establishes a system to characterize memory of β-catenin and Smad3 at a single cell level, and investigates how the property is modulated in various contexts.
Decoding information from signaling dynamics
kinetics and and feedforward regulations.
In several studies, binding and promoter kinetics involved with transcription have been demonstrated to decode specific information from signaling dynamics. One such example is from investigation of stress-response signaling in budding yeast S. cerevisae, which involves secondary messenger Msn2. Hao and Shae (2011) observed that varying stress stimuli evoked different modes of Msn2 response dy-namics: glucose limitation stimulated duration and frequency modulation, oxidative stress modulated duration of initial peak, and oxidative stress primarily affected am-plitude of the dynamics [41]. To investigate how genes could decode Msn2 dynamics and thereby differentiate varying stresses, the authors focused on modeling expres-sion based on modulating kinetics. Both theoretical and experimental analysis demonstrated that tuning binding kinetics of transcription factors influenced sensi-tivity of response to amplitude modulation, and tuning promoter kinetics (switching on-off states) influenced sensitivity to duration and frequency modulation.
In a similar vein, dynamics of calcium, a secondary messenger with many regulatory roles including mitochondrial and immune control, is known to be decoded through binding kinetics of its partner secondary messengers [42]. JNK and NF-κB have slow degradation and low affinity for calcium, while NFAT has fast degradation and high affinity for the ion. The kinetics therefore bias secondary messenger activation such that JNK and NF-κB activate in strong but transient calcium pulses, and NFAT activates with low, sustained calcium dynamics.
Coherent feedforward regulation also has a role in decoding dynamics. One of the transcriptional products in Erk signaling is c-fos, a regulatory transcription factor. Erk phosphorylates c-fos and therefore stabilizes it. Thus, new c-fos products rapidly degrade in transient Erk signaling as Erk is unavailable, but stabilize with sustained Erk dynamics [43]. Feedforward regulation to sense sustained dynamics is also observed with NF-κb. In host defense in response to LPS, Nf-κb translocates to the nucleus to acts as a weak activator in the transcription of Il6. Transient activation of Nf-κb thus leads to weak expression of Il6 that is quickly repressed. However, Nf-κB also induces expression of C/EBPδ, which cooperates with Nf-δB for strong activation of Il6. This feedforward regulation involving C/EBPγ allows for Il6 expression during sustained activation of Nf-κB.
signaling pathways, I1-FFL has been theorized as a possible transcriptional circuit that could detect fold change dynamics of second messengers [29, 44]. Indeed, evidence suggests that transcription of Il8 detects fold change through activation by Nf-κB and ‘repression’ through promoter competition of transcriptionally inactive p50 homodimer, another target of NF-κB [31].
Decoding in the Wnt pathway
Previous examples of decoding second messenger dynamics demonstrate general strategies and tuning that cells incorporate to sense specific information. Chapter 3 of my thesis focuses specifically on how signal in the Wnt pathway is decoded.
Siamois and Xnr3, Wnt target genes in development of Xenopus laevis, exhibit
1.1 Bibliography
1. Olsman, N. A.Architecture, Design, and Tradeoffs in Biomolecular Feedback
SystemsPhD thesis (California Institute of Technology, 2019).
2. Ne’eman, G., Goubitz, S. & Nathan, R. Reproductive traits of Pinus halepensis in the light of fire–a critical review.Plant Ecology171,69–79 (2004).
3. Yilmaz, M. & Meister, M. Rapid innate defensive responses of mice to looming visual stimuli.Current Biology23,2011–2015 (2013).
4. Jacob, F. & Monod, J. Genetic regulatory mechanisms in the synthesis of proteins.Journal of molecular biology3,318–356 (1961).
5. Bianconi, E. et al.An estimation of the number of cells in the human body.
Annals of human biology40,463–471 (2013).
6. Carroll, S. B. Chance and necessity: the evolution of morphological complexity and diversity.Nature409,1102 (2001).
7. Cavalli, G.Chromatin and epigenetics in development: blending cellular
mem-ory with cell fate plasticity2006.
8. Zhou, J. X. & Huang, S. Understanding gene circuits at cell-fate branch points for rational cell reprogramming.Trends in genetics27,55–62 (2011).
9. Waddington, C. The strategy of the genes: a discussion of some aspects of
theoretical biology. 1957 (London: Allen & Unwin).
10. Nichols, S. A., Dirks, W., Pearse, J. S. & King, N. Early evolution of animal cell signaling and adhesion genes. Proceedings of the National Academy of
Sciences103,12451–12456 (2006).
11. Babonis, L. S. & Martindale, M. Q. Phylogenetic evidence for the modular evolution of metazoan signalling pathways.Philosophical Transactions of the
Royal Society B: Biological Sciences372,20150477 (2017).
12. Gerhart, J. 1998 Warkany lecture: signaling pathways in development.
Tera-tology60,226–239 (1999).
13. Clevers, H. & Nusse, R. Wnt/β-catenin signaling and disease.Cell149,1192– 1205 (2012).
14. Moustakas, A. & Heldin, C.-H. The regulation of TGFβ signal transduction.
Development136,3699–3714 (2009).
15. Mumm, J. S. & Kopan, R. Notch signaling: from the outside in.Developmental
biology228,151–165 (2000).
17. Marshall, C. Specificity of receptor tyrosine kinase signaling: transient versus sustained extracellular signal-regulated kinase activation. Cell 80, 179–185 (1995).
18. Warmflash, A.et al.Dynamics of TGF-βsignaling reveal adaptive and pulsatile behaviors reflected in the nuclear localization of transcription factor Smad4.
Proceedings of the National Academy of Sciences109,E1947–E1956 (2012).
19. Cai, L., Dalal, C. K. & Elowitz, M. B. Frequency-modulated nuclear localiza-tion bursts coordinate gene regulalocaliza-tion.Nature455,485 (2008).
20. Albeck, J. G., Mills, G. B. & Brugge, J. S. Frequency-modulated pulses of ERK activity transmit quantitative proliferation signals. Molecular cell 49,
249–261 (2013).
21. Nelson, D.et al.Oscillations in NF-κB signaling control the dynamics of gene
expression.Science306,704–708 (2004).
22. Nandagopal, N. et al. Dynamic ligand discrimination in the notch signaling pathway.Cell172,869–880 (2018).
23. Spudich, J. L. & Koshland, D. E. Non-genetic individuality: chance in the single cell.Nature262,467 (1976).
24. Spencer, S. L., Gaudet, S., Albeck, J. G., Burke, J. M. & Sorger, P. K. Non-genetic origins of cell-to-cell variability in TRAIL-induced apoptosis.Nature
459,428 (2009).
25. Lee, E., Salic, A., Krüger, R., Heinrich, R. & Kirschner, M. W. The roles of APC and Axin derived from experimental and theoretical analysis of the Wnt pathway.PLoS biology1,e10 (2003).
26. Goentoro, L. & Kirschner, M. W. Evidence that fold-change, and not absolute level, ofβ-catenin dictates Wnt signaling.Molecular cell36,872–884 (2009).
27. Becskei, A. & Serrano, L. Engineering stability in gene networks by autoreg-ulation.Nature405,590 (2000).
28. Cheong, R., Rhee, A., Wang, C. J., Nemenman, I. & Levchenko, A. Information transduction capacity of noisy biochemical signaling networks.science 334,
354–358 (2011).
29. Frick, C. L., Yarka, C., Nunns, H. & Goentoro, L. Sensing relative signal in the Tgf-β/Smad pathway.Proceedings of the National Academy of Sciences
114,E2975–E2982 (2017).
30. Cohen-Saidon, C., Cohen, A. A., Sigal, A., Liron, Y. & Alon, U. Dynamics and variability of ERK2 response to EGF in individual living cells.Molecular cell36,885–893 (2009).
31. Lee, R. E., Walker, S. R., Savery, K., Frank, D. A. & Gaudet, S. Fold change of nuclear NF-κB determines TNF-induced transcription in single cells.
32. Uda, S. et al. Robustness and compensation of information transmission of signaling pathways.Science341,558–561 (2013).
33. Beran, J.Statistics for long-memory processes(Routledge, 2017).
34. Austin, D.et al.Gene network shaping of inherent noise spectra.Nature439,
608 (2006).
35. Sigal, A.et al.Variability and memory of protein levels in human cells.Nature
444,643 (2006).
36. Kellogg, R. A. & Tay, S. Noise facilitates transcriptional control under dynamic inputs.Cell160,381–392 (2015).
37. Heltberg, M., Kellogg, R. A., Krishna, S., Tay, S. & Jensen, M. H. Noise induces hopping between NF-κB entrainment modes.Cell systems3,532–539 (2016).
38. Gouzé, J.-L. Positive and negative circuits in dynamical systems.Journal of
Biological Systems6,11–15 (1998).
39. Zi, Z., Chapnick, D. A. & Liu, X. Dynamics of TGF-β/Smad signaling.FEBS
letters586,1921–1928 (2012).
40. Aulehla, A. & Pourquie, O. Oscillating signaling pathways during embryonic development.Current opinion in cell biology20,632–637 (2008).
41. Hao, N. & O’shea, E. K. Signal-dependent dynamics of transcription factor translocation controls gene expression.Nature structural & molecular biology
19,31 (2012).
42. Dolmetsch, R. E., Lewis, R. S., Goodnow, C. C. & Healy, J. I. Differential activation of transcription factors induced by Ca2+ response amplitude and duration.Nature386,855 (1997).
43. Murphy, L. O., Smith, S., Chen, R.-H., Fingar, D. C. & Blenis, J. Molecular in-terpretation of ERK signal duration by immediate early gene products.Nature
cell biology4,556 (2002).
C h a p t e r 2
INVESTIGATING MEMORY IN
β
-CATENIN AND SMAD3
DYNAMICS
2.1 Introduction
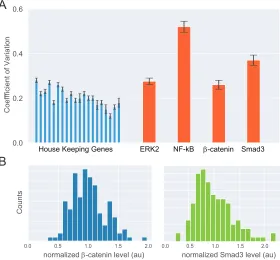
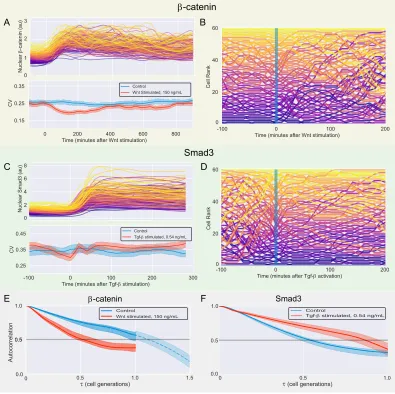
Cells respond to intercellular signals and transduce information to the nucleus by signaling pathways. Information from extracellular signals is encoded through dynamics of second messengers, intracellular molecules that activate and respond to the signals- often with direct roles in transcriptional regulation. One of the foci in investigating signaling pathways is how the pathways operate given cell-to-cell variability. Indeed, single cell studies have demonstrated significant variability in levels of second messengers in multiple signaling pathways (Figure 2.1A).
0.0 0.2 0.4 0.6
Coeffficient of Variation
House Keeping Genes ERK2 NF-kB β-catenin Smad3
0.0 0.5 1.0 1.5 2.0 normalized β-catenin level (au)
Counts
0.0 0.5 1.0 1.5 2.0 normalized Smad3 level (au)
A
[image:21.612.162.442.344.604.2]B
Figure 2.1: Variability of second messengers in signaling pathways
(A) Variability of proteins in mammalian context. Blue: CV of 19 nuclear house-keeping genes in human H1299 cells [1]. Orange: CV of Erk2 [2], NF-kB [3], β-catenin, and Smad3. CV from β-catenin and Smad3 were obtained from single cell data inβ-catenin-mCitrine and NG-Smad3 cell lines, respectively.
In regards to detection of signal via ligand-receptor activation, emerging findings have demonstrated that fold change of second messengers could be precise despite the variability. [2–5]. However, there is ample evidence that, even without up-stream ligand-receptor activation or inhibition, perturbations of second messenger dynamics can bring about significant changes in cells [6–9]. Further, variability of signaling states, reported by transcription output of synthetic promoters, underlies heterogeneity in important cellular responses such as cell-fate decision or response to drug treatment [10, 11].
In this study, in collaboration with Chris Frick, we ask how variability of second messengers in signaling pathways is characterized over time, and how this character-istic may affect cellular processes. Aside from investigations of known oscillatory dynamics [12, 13], how second messengers fluctuate over time has not been well characterized. We use the concept of memory, often represented by autocorrelation functions and defined as ‘the rate of decay of statistical dependence of two points with increasing time interval between the two points,’ to ground our investigation [14]. Simply put, cells with second messengers that have long memory would have stable levels for longer time, while cells with shorter memory would have quick fluctuations with high amplitude (Figure 1.2, reproduced below).
Memory of protein levels at single cell level has been investigated in two previous studies: Austin et al. (2006) characterized memory of destabilized GFP controlled by synthetic circuits in E.coli [15] and Sigal et al. (2016) did so in 19 nuclear housekeeping proteins in human cells [1]. Both studies use autocorrelation function, which is correlation of a time series with a delayed copy of itself as a function of delay (τ). While both studies use normalized autocorrelation for which data in each time point is normalized to population average, Austin et al. calculates the autocorrelation function from protein levels while Sigal et al. calculates it from ranks of the protein levels. In effect, the autocorrelation function from Sigal et al. informs how quickly a cell’s protein level fluctuate relative to those of other cells in a population. By calculating the time at which the autocorrelation function decays to 0.5, one can obtain a standard measure to compare the timescale of memory. This value is referred to as ‘noise frequency range’ by Austin et al. and ‘mixing time’ by Sigal et al.
Protein level
t t +τ t + 2τ
Short Memory
t t +τ t + 2τ
Long Memory
Protein level
Time Time
A B
Figure 1.2 (reproduced): Memory of protein levels
Top: An example trace of protein levels over time with short (A) or long (B)
memory. Fluctuations cause correlation between time points to decay quickly(A)/ slowly(B)with increasing time interval (τ)
Bottom: How protein levels in a population may behave with short(A)or long(B)
memory
and mixing time of a protein- a protein within a population of high CV retained its relative level for a longer time compared to that in a population of low CV (illustrated below).
0.10 0.15 0.20 0.25 0.30 Expression Variability (CV)
0 1 2 3
Mixing time (cell generations)
Mixing time (Tm) vs CV in human housekeeping genes in H1299 cell line,
repro-duced from original data in [1]
[image:23.612.176.438.74.277.2]dataset of human proteins from Sigalet al. a useful standard for which to compare these dynamic properties. Thus, we calculate memory with mixing time and auto-correlation function used by Sigalet al., shown below:
A(τ)=
*
Ri(t) −
Ri(t)
i
· Ri(t+τ) −
Ri(t+τ)
i i + t *
Ri(t) −
Ri(t)
i 2 i + t
Here, we characterize memory of β-catenin and Smad3, second messengers in two major Metazoan signaling pathways, the Wnt and the Tgf-βpathway. In the canon-ical Wnt pathway, β-catenin gets constantly degraded by cytoplasmic degradation complex composed of scaffold protein Axin, APC, and kinases CK1 and GSK3-β [16], (Figure 2.2A). During Wnt ligand-receptor activation, the destruction com-plex is recruited to the receptor and degradation of β-catenin is inhibited, allowing β-catenin to accumulate and translocate to the nucleus.
Stimulation by Tgf-βligands primarily transduces information through two receptor activated Smads (R-Smads), Smad2 and Smad3, although contexts in which Smad1 and Smad5 could also be activated have been discovered [17], (Figure 2.2B). Upon receptor activation, R-Smads are phosphorylated in the C-terminus and form a complex with common Smad4. The resulting Smad heteromer alters the normal flux of Smads shuttling in and outside of the nucleus with slower export and faster import rates, resulting in nuclear localization [18].
Axin APC βcat Axin APC GSK DC
βcat βcat
[image:25.612.137.469.76.257.2]DC DC βcat DC Wnt P P P P P APC βcat Transcriptional Regulation Dvl Tgfβ Smad3 Smad3 P Smad3 P Smad4 Smad3 P Smad4 Smad3 P Smad4 Transcriptional Regulation Smad3 PPase Smad4 A B
Figure 2.2: Wnt and Tgf-βsignaling pathways.
(A) Illustration of Smad3 activation and nucleocytoplasmic shuttling in the Tgf-β pathway
(B) Illustration of rapid degradation of β-catenin and receptor activated inhibition of the degradation in the Wnt pathway.
2.2 Results
Design and Characterization of Endogenous Fluorescentβ-catenin and Smad3
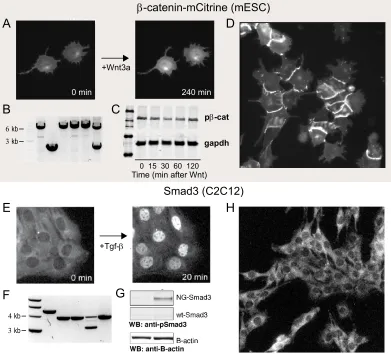
Previously, ectopic β-catenin-GFP fused at both N or C-terminus has been utilized in various contexts to investigate Wnt, from sea urchin and Xenopus embryos to human cell lines. The fusion protein retained proper localization, phosphorylation, nuclear shuttling, as well as response to Wnt ligand stimulation [20–22]. We have successfully generated homozygous clonal cell lines with mCitrine yellow fluorescent protein tagged at theβ-catenin C-terminus (β-catenin-mC) (Figure 2.4A) in mESCs and nMuMGs, and heterozygous clones in C2C12s. Both PCR of β-catenin’s genomic locus and Western blot against β-catenin reflected homozygous integration of the fluorescent protein (Figure 2.4B, S2.1B)
In the clonal mESCβ-catenin-mC line, functional assays were performed to validate that the fusion protein retained its signaling capacity. RT-PCR of Wnt target genes
BrachyuryandAxin2in the β-catenin-mC cell line revealed target activations upon
TAA
β-catenin mCitrine
β-catenin-mCitrine β-catenin gene
exon 15 14
12 13
1
mCitrine selection cassette
Cas9 Cleavage
β-catenin-mCitrine gene
exon 15 14 12 13 1 mCitrine TAA selection cassette Flippase Recognition Target (FRT) Flippase Cleavage exon 15 14 12 13 1 mCitrine TAA Smad3 gene 9 2 3 exon 1
Cas9 Cleavage TAA
ATG mNeonGreen 9 2 3 exon 1 ATG mNeonGreen mNeonGreen-Smad3 gene
transcription / translation
Smad3 mNeonGreen
mNeonGreen-Smad3
transcription / translation
A
[image:26.612.111.503.83.514.2]B
Figure 2.3: Crispr-Cas9 mediated genomic fusion of β-catenin and Smad3 with fluorescent reporters.
(A) Design of β-catenin-mCitrine fusion protein. Antibiotic resistance cassette (geneticin) was used for selection, then excised using Flp-Frt recombination. (B) Design of mNeonGreen-Smad3 fusion protein. Clonal selection was achieved through sequential sorting by fluorescence.
0 min 240 min
0 min 240 min
+Wnt3a
+Tgf-β
pβ-cat
gapdh
0 15 30 60 120 Time (min after Wnt)
β-catenin-mCitrine (mESC)
Smad3 (C2C12)
3 kb
4 kb
3 kb
6 kb A
B C
D
E
F G
[image:27.612.111.502.75.429.2]H
Figure 2.4: Characterization of fluorescence-fusion β-catenin and Smad3
(A) Live imaging the response of β-catenin-mCitrine cells to 150 ng/mL recombi-nant Wnt3A through mCitrine fluorescence.
(B) PCR of genomic β-catenin locus to validate homozygous integration of mC-itrine. Expected band for successful integration is 6.4 kb, wildtype band is 2.3kb. Lanes 1,3,4,5 show homozygous integration, Lane 2 shows no integration, and lane 6 shows heterozygous integration.
(C) Western blot against β-catenin shows transient inhibition of phospho-rylation after addition of 150 ng/mL Wnt3a.
(D) Representative fluorescence image of mESCβ-catenin-mCitrine clonal line. (E) Live imaging the response of NG-Smad3 to Tgf-βaddition.
(F) Expected band for successful integration is 3.8 kb. Lanes 2,3,5 show ho-mozygous integration, 4 shows heterozygous integration, and 1 shows incorrect integration.
(G) Western blot against phospho-Smad3 shows phosphorylation of Smad3 in re-sponse to Tgf-βaddition.
induce increase in overall level and nuclear translocation ofβ-catenin (Figure 2.4A, S2.2A)
The two principal second messengers in the Tgf-β pathway, Smad2 and Smad3, are structurally similar but regulate distinct genes. Moreover, while Smad3 binds directly to DNA, the dominant isoform of Smad2 does not. In this study, we chose to fuse fluorescent reporter at the N-terminus of endogenous Smad3. Smad3 tagged at the N-terminus has been shown to retain its signaling functions - phosphorylation at C-terminus, nuclear shuttling, and transcriptional regulation, and previously utilized to investigate dynamics with ectopic expression [5, 25]. Using Crispr-Cas9 directed genome modification, we successfully generated homozygous clonal cell lines of Smad3 fused mNeonGreen fluorescent protein (NG-Smad3) at the N-terminus (Fig-ure 2.3B) in C2C12 muscle progenitor cells (Fig(Fig-ure 2.4B) and nMuMG epithelial cell lines. We also generated clones of heterozygous NG-Smad3 in mouse embryonic stem cells (mESCs), but were not able to get clones with homozygous integration.
NG-Smad3 in clonal C2C12 lines were demonstrated to retain capacity for signal transduction. Blotting for phospho-Smad3 reveals that the fusion protein is readily phosphorylated with Tgf-β stimulation (Figure 2.4G). In time-lapse imaging, the cells show response to Tgf-β ligand stimulation as cytoplasmic Smad3 is rapidly localized to nucleus (Figure 2.4E). Finally, dynamics of Snail activation, a known target gene of Tgf-β[26], reported by endogenous Snail-p2a-mKate integrated into the same cell lines, demonstrate activation with Tgf-βand correlation with Smad3 dynamics (Figure S2.1A).
Endogenous β-catenin and Smad3 fluctuate quickly
For initial characterization of variability and memory, we used NG-Smad3 clone from C2C12 andβ-catenin-mC clone from mESCs. We captured the dynamics of the fluorescence-tagged second messengers by time-lapse microscopy, under consistent temperature, humidity, and CO2 levels. The cells were kept in normal growing conditions without any ligand stimulation or perturbations. The cells were imaged for 30 hours at 10 minutes per frame, covering over two cell generations. From the images, cells were segmented and tracked by nuclear signal of either mCerulean or mKate tagged with nuclear localization signals. Levels of fluorescence from both second messengers and nuclear markers were quantified, and tracked cells were digitally synchronized by cell cycle (Figure S2.2).
20 40 60
Cell Rank
β-catenin Smad3
0.0 0.5 1.0 1.5
τ (cell generations) 0.5
0.5 1.0
Autocorrelation
β-catenin, CV = 0.26
Smad3, CV = 0.37
0.10 0.15 0.20 0.25 0.30 0.35
Expression Variability (CV) 0
1 2 3
Mixing time (cell generations)
β-catenin (mESC)
Smad3 (C2C12)
0 20 40 60 80 100
Time (% Cell Cycle) 0.20 0.25 0.30 CV 0.25 0.35 0.45
0 20 40 60 80 100
Time (% Cell Cycle)
A B
C D
[image:29.612.115.500.81.393.2]20 40 60
Figure 2.5: CV and memory of β-catenin and Smad3
(A,B) (Top) Ranksβ-catenin (A) / Smad3 (B) levels in 60 random cells through one cell cycle. Color for each cell was determined at timepoint 0 by the fluorescence rank. (Bottom) Coefficient of Variation for the population of cells (β-catenin: N=194, Smad3: N= 114). ±1 bootstrapped SE shown.
(C) Mean-normalized rank autocorrelation functions of β-catenin and Smad3, ±1 bootstrapped SE shown. For β-catenin, polynomial fitting was used to extend the function (dashed line) to estimate mixing time, where A(τ) crosses 0.5
(D) Mixing time (τm) vs CV in human housekeeping genes in H1299 (green [1],
β-catenin in mESCs (blue), and Smad3 in C2C12s (red).
Smad3 was much faster at∼0.6 cell cycle (Figure 2.5D).
It is known that stem cells secrete Wnt proteins in human ES culture that introduce downstream variability [10]. To check whether endogenous Wnt secretions could affect variability and memory of β-catenin in mESCs, we treated the cell line with IWP2, Porcupine inhibitor that blocks secretion of Wnt proteins [27]. The variability and autocorrelation calculated from β-catenin dynamics in the treated cells did not show significant change from the control conditions (Figure S2.3)
Given previous findings correlating CV with mixing time, these results are sur-prising: in comparison to the mixing times of human housekeeping genes, both β-catenin and Smad3 had much shorter memories relative to their CV.
Wnt stimulation reduces variability and memory of β-catenin
As mentioned, Wnt stimulation leads to inhibition of degradation complex, leading to stabilization and nuclear translocation ofβ-catenin. In Gillespie simulations [28] and mass action models [1], increased protein degradation rates are predicted to shorten the timescales of memory. As Wnt signaling primarily inhibits degradation rate ofβ-catenin, we predicted that signaling activation could lengthen the memory of the second messenger.
We tracked and quantified the β-catenin levels of cells treated with 150 ng/mL of recombinant Wnt3a. The ligand stimulation led to 1.8 fold elevation of nuclear β-catenin concentration over the first 3 hours, and reduction of CV over the same duration (Figure 2.6A). Cell traces of rankedβ-catenin revealed a surprising trend: fluctuations of the second messengers within the population sped up significantly (Figure 2.6B). The observation was confirmed in comparison of autocorrelations functions between traces without Wnt stimulation and those with stimulation, with Wnt-stimulated population exhibiting must faster decay of autocorrelation (Figure 2.6E). These results suggested that although degradation is the primary effector of β-catenin dynamics in the Wnt signaling, there may be other, more significant factors affecting memory of the second molecule.
Tgf-βstimulation raises variability and memory of Smad3
0 1 2 3 Nuclear β -catenin (au)
0 200 400 600 800
Time (minutes after Wnt stimulation) 0.15
0.25 0.35
CV
Control
Wnt Stimulated, 150 ng/mL
0.5 1.0 1.5
τ (cell generations) 0.5
0.5 1.0
Autocorrelation
Control
Wnt stimulated, 150 ng/mL
-100 0 100 200
Time (minutes after Wnt stimulation) 0 20 40 60 Cell Rank 0 2 4 6 8
Nuclear Smad3 (au)
-100 0 100 200 300
Time (minutes after Tgf-β stimulation) 0.25
0.35 0.45
CV
Control
Tgf-β stimulated, 0.54 ng/mL
-100 0 100 200
Time (minutes after Tgf-β activation) 0
20 40 60
Cell Rank
β-catenin Smad3
0 0.5 1.0
0.0 0.5 1.0
Control
Tgf-β stimulated, 0.54 ng/mL
0 0.0 A B C D E F β-catenin Smad3
[image:31.612.109.504.75.469.2]τ (cell generations)
Figure 2.6: Signaling affects variability and memory of second molecules
(A,C) Top: Traces of normalized β-catenin(A)or Smad3(C)levels following 150 ng/mL Wnt3a(A)or 0.54 ng/mL Tgf-β (C)stimulation. Bottom: CV of the traces over the same time period (red), contrasted with cells without ligand stimulation (blue). ±1 bootstrapped SE shown.
(B,D) Cell traces of β-catenin (B) or Smad3 (D) ranks before and after ligand addition. Color for each cell was determined based on the rank at time of ligand addition (blue bar).
(E,F) Normalized rank autocorrelation functions in β-catenin(E) and Smad3 (F). Autocorrelations function in ligand-stimulated cells (Red) are plotted with cells in control conditions (Blue). Due to the timing of ligand addition, cells are not digitally synchronized in this data set. ±1 bootstrapped SE shown.
ng/mL Tgf-βligand, coinciding with elevation of CV (Figure 2.6C). Plotting ranked cell traces reveal that, contrasting with findings from the Wnt pathway, Smad3 fluctuations stabilize and slow down with signal activation (Figure 2.6D)
It is interesting to note that signal activation affects memory in opposite manner in the Wnt and Tgf-βpathways. This disparity, as well as the difference in timescales of memory, could contribute to diversity in temporal complexity of information transduction in signaling. The rapid change in profiles of memory in response to signaling also suggest that variability and memory of the second messengers could be sensitive to cellular contexts.
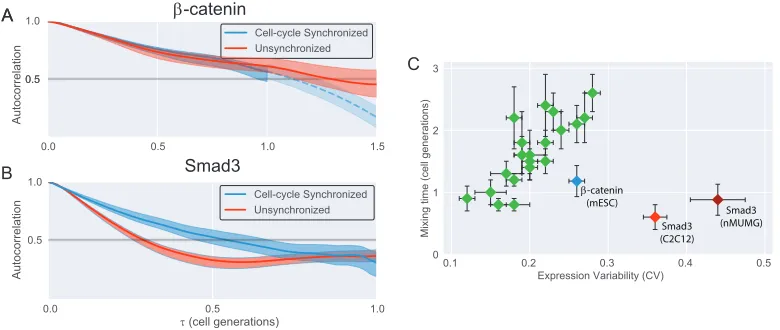
Cellular context modulates CV and memory of β-catenin and Smad3
0.0 0.5 1.0 1.5 0.5 0.5 1.0 Autocorrelation Cell-cycle Synchronized Unsynchronized
0.0 0.5 1.0
τ (cell generations)
0.5 1.0
Cell-cycle Synchronized Unsynchronized
0.1 0.2 0.3 0.4 0.5 Expression Variability (CV)
0 1 2 3
Mixing time (cell generations)
[image:32.612.109.499.279.444.2]β-catenin (mESC) Smad3 (C2C12) Smad3 (nMUMG) Autocorrelation AA B C β-catenin Smad3
Figure 2.7: Cellular context modulates variability and memory of β-catenin and Smad3
(A,B) Normalized rank autocorrelation functions for β-catenin (A) or Smad3(B)
levels, comparing traces that were digitally synchronized for cell cycle (Blue) vs unsynchronized traces (Red). ±1 bootstrapped SE shown.
(C) Mixing time (τm) vs CV in human housekeeping genes, updated showing Smad3
in two different cell lines, C2C12 (red) and nMUMG (dark red).
in which cells skip G1/G2 phases during the synchronized divisions [31]. In many contexts in which cells are not synchronized, the variability in cell cycle phases could affect second messenger dynamics, as both Wnt and Tgf pathways have implicated roles in cell cycle control [32, 33].
We therefore analyzed second messenger dynamics from population of cells that were not signal activated, and compared the memory of unsynchronized cells vs digitally synchronized cells. β-catenin showed no difference between synchronized and unsynchronized cells, suggesting that cell cycle does not affect the dynamics of the second messenger (Figure 2.6A). Smad3, however, showed a significant reduction in memory, reflected by faster decay of the rank-autocorrelation function in unsynchronized cells compared to that of synchronized cells (Figure 2.7B). We find that such discrepancy arises from Smad3 concentration that continuously decreases over a cell cycle, while β-catenin concentrations remain steady (Figure S2.4).
Signaling pathways are used in varying contexts and purposes, and we wondered whether variability and memory of second messengers are contextually dependent given the apparent tuneability. Activation of Tgf-βpathway have stimulatory effects for differentiation and myogenesis in C2C12s [34, 35], while the pathway mediates epithelial-to-mesenchymal transdifferentiation in nMUMG cells [36, 37]. Compar-ing variability and memory of Smad3 in the two varyCompar-ing cell lines, we observed significant differences: Smad3 levels in nMUMG presented larger variability and longer memory (Figure 2.7C) The results suggest that memory of second messen-gers is indeed context specific, but still very short respective to the CV compared to housekeeping genes.
2.3 Discussion
distributions are quickly reestablished after signaling events.
In any case, questions arise on whether target genes either filter or decode the fast, large amplitude fluctuations of second messengers. If indeed the latter is true for some target genes, it would be important to know the timescales of memory in appli-cations such as drug treatment. Further, it would be useful to investigate decoding mechanisms that could differentiate signaling events from natural fluctuations, and classify genes that are sensitive to the short memory from those that are not.
2.4 Materials and Methods
Cell Culture
mouse Embryonic Stem Cells (mESCs): E14 mESC (E14Tg2a.4) were obtained from Mutant Mouse Regional Resource Centers (015890-USCD). The mESC was cultured at 37C and 5% (vol/vol) CO2 on 0.1% gelatin coated plates with Glasgow’s MEM supplemented with 1000 U/mL LIF (Millipore, ESG1106), 10% ES-certified FBS (Thermo Fisher 16141061), non-essential amino acids, and L-glutamine. To confirm the identity of the mESC, we performed differentiation assay, confirmed the expected changes in cell morphology, and verified expression of pluripotency and differentiation markers using qRT-PCR, including Nanog, Oct4, Brachyury, Flk1, Myf5, Gata4, Sox17, Pax6, Otx2. We confirmed the purity of the culture by performing mycoplasma testing.
C2C12cells (American Type Culture Collection, CRL-1772) were cultured at 37C and 5% (vol/vol) CO2 in DMEM (ThermoFisher Scientific; 11995) supplemented with 10% (vol/vol) FBS (Invitrogen; A13622DJ), 100 U/mL penicillin, 100 ug/mL streptomycin, 0.25 ug/mL amphotericin, and 2 mM L-glutamine (Invitrogen)
nMUMG cells were cultured at 37C and 5% (vol/vol) CO2 in DMEM (Ther-moFisher Scientific; 11995) supplemented with 10% (vol/vol) FBS (Invitrogen; A13622DJ), 1% non-essential amino acids, 100 U/mL penicillin, 100 ug/mL strep-tomycin, 0.25 ug/mL amphotericin, and 2 mM L-glutamine (Invitrogen)
Crispr-cas9 mediated genome editing
mNeonGreen-Smad3
We designed a homology directed repair (HDR) template plasmid to insert mNeon-Green coding region at the immediate N-terminus of Smad3 (removing the Smad3 ATG). The plasmid had 900 base pairs of homology to smad3 immediately upstream of the smad3 ATG (5’ Homology Arm) and 900 base pairs of homology to smad3 immediately downstream of the smad3 ATG (3’ Homology Arm). The HDR me-diated editing of genomic smad3 results in expression of a functional, fluorescently labeled Smad3 that is identical to the construct used (Frick et al., 2017) To per-form the homology directed repair mediated knock in of mNeonGreen, cells were transfected with HDR template plasmid, guideRNA synthesized by IDT, and Cas9 protein from IDT (Alt-R S.p. Cas9) using Lipofectamine LTX (Life Technologies).
C-terminus ofβ-catenin, removing the stop codon. The plasmid had 1000 basepairs of homology each on regions upstream and downstream of the stop codon. For delivery of gRNA, we obtained PX330 generously donated to Addgene by the Feng Zhang lab [42]. Into the PX330 plasmid, we inserted gRNA sequence targeting the T promoter and removed the Cas9 coding cassette. Cells were transfected with HDR template plasmid, modified PX330 plasmid, and Cas9 protein (IDT: Alt-R S.P. Cas9) using Lipofectamine LTX (Life Technologies). After clonal selection using puromycin, antibiotic cassette was removed from the genome with transfection of Flippase expression plasmid and selected with TK reverse-selection by 4 uM Ganciclovir solution (Life Technologies).
Single cell clonal selection
mNeonGreen-Smad3
To obtain clones with successfully edited genomic Smad3, the cells were sorted for mNeonGreen fluorescence and then plated as single cells in 96 well plates via lim-iting dilution. The clonal populations that grew up were screened for mNeonGreen fluorescence, NG-Smad3 nuclear accumulation upon Tgf-βtreatment, characteristic localization of Smad3 (absence of puncta, absence of membrane blebbing, correct subcellular localization, etc), and genomic PCR to check for number of alleles edited (heterozygosity or homozygosity) as well as sequencing. Genomic PCR was performed on whole cell lysates using KOD Xtreme Hot Start DNA Polymerase (Millipore-Sigma).
β-catenin-mCitrine
Transfected cells from 24-well were plated in 10cm well and placed in puromycin selection (1.5 ug/mL). After antibiotic selection, single cells were plated in 96 well plates via limiting dilution. The clonal population were screend for characteristic β-catenin mCitrine fluorescence, with strong signal at cell-cell junctions. Genomic PCR was performed from clonal samples to check for integration as well as sequenc-ing, with KOD Xtreme hot start DNA polymerase (Millipore-Sigma).
Western Blots
cadherins. The solution was spun down again, and supernatants were transferred to Laemmli sample buffer and boiled. The samples were then run onto a Bolt™ 4-12% Bis-Tris Plus Gel (Thermofisher, NW04120BOX). Proteins were transferred onto nitrocellulose membranes, blocked for one hour at RT with blocking buffer (Odyssey® Blocking Buffer (TBS) (927-50000) and stained for 1 hr at RT with primary antibody diluted in blocking buffer. The membranes were then stained with fluorescent IR secondary antibodies diluted in blocking buffer for one hour at RT. The fluorescent signal was then imaged using the LiCOR Odyssey Imager and quan-tified using Odyssey Application software version 3.0. The background-subtracted intensity of the protein bands were normalized to GAPDH loading control.
RT-PCR.
Total RNA from mESC was isolated with RNeasy extraction kit (Qiagen 74104). cDNA was synthesized using Quantitect RT (Qiagen 205311). Real-time RT-PCR was performed using Quantitect SYBR-Green kit (Qiagen 204143) using StepOne-Plus RT-PCR System (Applied Biosystems).
Live cell imaging
Cells were grown on 96-well glass-bottomed plates (Griener Bio-One; 655891) overnight before imaging in 200 uL of FluoroBrite DMEM (Gibco-Life Technolo-gies; A18967) containing respective cell culture media. For mESC, the wells were pre-coated with laminin (Invitrogen; 23017-015) diluted into 10 ug/mL in dPBS solution overnight. Cells were imaged using a Zeiss Axio Observer.Z1 inverted fluorescence microscope under incubation [37C and 5% (vol/vol) CO2, with humid-ification] on a motorized stage. In each experiment, 25–80 positions were imaged and focus was maintained using Zeiss Definite Focus. Images were acquired at 10-min intervals with a 40×, 0.8-N.A. Plan Apo objective and Evolve 512 EM-CCD camera (Photometrics).
Imaging Analysis
image by this media-only image. This procedure was repeated for each fluorescence channel. Bleaching correction was performed for each fluorescence channel by correcting for the global change in fluorescence throughout the duration of imaging. For background correction, images were segmented such that the entireties of cells were broadly outlined, and fluorescence signal from the background was then aver-aged and subtracted from the image. This procedure was repeated for all images at each time frame.
Segmentation, tracking, and quantification of signal in cellsWe quantified both median or total fluorescence intensity of NG-Smad3 or β-catenin-mCitrine fluo-rescence in the nuclei. The nuclei of cells were first segmented based on the fluorescence of the constitutively expressed mCerulean3-3NLS (3×NLS) or pSnail-mKate-3NLS. For images with mESC, Ilastik was used for nuclear segmentation [44]. Next, segmented nuclei were tracked across all time frames. Finally, the fluorescence data from the segmented nuclei were extracted. We performed seg-mentation, tracking, and fluorescence quantitation steps using the Lineage Tracker ImageJ (NIH) plug-in (36) and custom MATLAB (MathWorks) scripts (available upon request).
Digital synchronizationCells undergo general morphological change during cell division, balling up with nuclear disintegrated before dividing into two daughter cells. The division can be captured in time series fluorescence data by identifying when total level of fluorescent protein is drastically reduced (theoretically close to halved). Further, median fluorescence of second messengers also spike in levels when a cell balls up during division. Once division points are identified using these signatures, all time series between two cell divisions are collected for syn-chronization. Because cells have natural variations in duration of cell cycle, linear interpolation is used to fit all traces to the same timescale. All code for digital synchronization were performed in Python 3.6.
2.5 Supplementary Figures
A
B
β-catenin -mCitrine clone 75
100 150
M
ol
ec
ul
ar
W
ei
gh
t (
kD
a)
WT
[image:39.612.145.465.105.498.2]C
Figure S2.1: Fluorescence fusion second proteins activate target genes.
(A) Response of endogenous Snail-p2a-mCherry reporter to Tgf-βaddition in NG-Smad3 clonal cell line. Blue: control, red: 2.4 ng/mL Tgf-β added, light blue: addition of SB431-542 inhibitor of Smad2/3 phosphorylation terminates induction of mCherry.
(B) Western blot againstβ-catenin reveals homozygous integration of mCitrine (left lane). Clonal line with Wildtype β-catenin (right lane) for comparison.
A
-100 0 100 200 300 400 500
Time (minutes after Wnt stimulation) 1.0
1.5 2.0
Nuclear
β
-catenin (au)
B
0 2 4 6 8
Nuclear
β
-catenin (au)
[image:40.612.145.454.84.415.2]Cell Division Cell Division
Figure S2.2: Fluorescence tracking and digital synchronization
(A) MOVIE: Example of quantification of β-catenin dynamics in sister cells. Cells were stimulated with 150 ng/mL Wnt3a at t=0 (time of acquisition listed in bottom right corner).
0 20 40 60 80 100 Time (% Cell Cycle)
0.20 0.25 0.30
CV
0.0 0.5 1.0 1.5
τ (cell generations) 0.5
0.5 1.0
Autocorrelation
Control IWP-treated Control IWP-treated
A
[image:41.612.141.470.75.470.2]B
Figure S2.3: Variability and memory ofβ-catenin with blocking of Wnt secretion (A) CV of β-catenin throughout a cell cycle, cells were either in control growing conditions or treated with 2.5 uM IWP2 for two days prior to imaging.±1 boot-strapped SE shown.
0 20 40 60 80 100 Time (% cell cycle)
0.6 0.8 1.0 1.2 1.4
Median level (au)
[image:42.612.141.469.72.262.2]β-catenin Smad3
Figure S2.4: β-catenin and Smad3 concentration over a cell cycle]
Median nuclear levels of β-catenin and Smad3 over a duration of cell cycle. ±1 bootstrapped SE shown.
2.6 Work Contributions
2.7 Bibliography
1. Sigal, A.et al.Variability and memory of protein levels in human cells.Nature
444,643 (2006).
2. Cohen-Saidon, C., Cohen, A. A., Sigal, A., Liron, Y. & Alon, U. Dynamics and variability of ERK2 response to EGF in individual living cells.Molecular cell36,885–893 (2009).
3. Lee, R. E., Walker, S. R., Savery, K., Frank, D. A. & Gaudet, S. Fold change of nuclear NF-κB determines TNF-induced transcription in single cells.
Molec-ular cell53,867–879 (2014).
4. Goentoro, L. & Kirschner, M. W. Evidence that fold-change, and not absolute level, ofβ-catenin dictates Wnt signaling.Molecular cell36,872–884 (2009).
5. Frick, C. L., Yarka, C., Nunns, H. & Goentoro, L. Sensing relative signal in the Tgf-β/Smad pathway.Proceedings of the National Academy of Sciences
114,E2975–E2982 (2017).
6. Sato, N., Meijer, L., Skaltsounis, L., Greengard, P. & Brivanlou, A. H. Main-tenance of pluripotency in human and mouse embryonic stem cells through activation of Wnt signaling by a pharmacological GSK-3-specific inhibitor.
Nature medicine10,55 (2004).
7. Marshall, C. Specificity of receptor tyrosine kinase signaling: transient versus sustained extracellular signal-regulated kinase activation. Cell 80, 179–185 (1995).
8. Yap, J. L., Worlikar, S., MacKerell Jr, A. D., Shapiro, P. & Fletcher, S. Small-Molecule Inhibitors of the ERK Signaling Pathway: Towards Novel Anticancer Therapeutics.ChemMedChem6,38–48 (2011).
9. Zhang, Y., Chang, C., Gehling, D. J., Hemmati-Brivanlou, A. & Derynck, R. Regulation of Smad degradation and activity by Smurf2, an E3 ubiquitin ligase.Proceedings of the National Academy of Sciences98,974–979 (2001).
10. Blauwkamp, T. A., Nigam, S., Ardehali, R., Weissman, I. L. & Nusse, R. Endogenous Wnt signalling in human embryonic stem cells generates an equi-librium of distinct lineage-specified progenitors. Nature communications 3,
1070 (2012).
11. Oshimori, N., Oristian, D. & Fuchs, E. TGF-β promotes heterogeneity and drug resistance in squamous cell carcinoma.Cell160,963–976 (2015).
12. Kellogg, R. A. & Tay, S. Noise facilitates transcriptional control under dynamic inputs.Cell160,381–392 (2015).
14. Beran, J.Statistics for long-memory processes(Routledge, 2017).
15. Austin, D.et al.Gene network shaping of inherent noise spectra.Nature439,
608 (2006).
16. Clevers, H. & Nusse, R. Wnt/β-catenin signaling and disease.Cell149,1192– 1205 (2012).
17. Moustakas, A. & Heldin, C.-H. The regulation of TGFβ signal transduction.
Development136,3699–3714 (2009).
18. Schmierer, B., Tournier, A. L., Bates, P. A. & Hill, C. S. Mathematical modeling identifies Smad nucleocytoplasmic shuttling as a dynamic signal-interpreting system. Proceedings of the National Academy of Sciences 105, 6608–6613 (2008).
19. Warmflash, A.et al.Dynamics of TGF-βsignaling reveal adaptive and pulsatile behaviors reflected in the nuclear localization of transcription factor Smad4.
Proceedings of the National Academy of Sciences109,E1947–E1956 (2012).
20. Miller, J. R. & Moon, R. T. Analysis of the signaling activities of localization mutants ofβ-catenin during axis specification in Xenopus.The Journal of cell
biology139,229–243 (1997).
21. Weitzel, H. E.et al.Differential stability ofβ-catenin along the animal-vegetal axis of the sea urchin embryo mediated by dishevelled. Development 131,
2947–2956 (2004).
22. Kafri, P. et al. Quantifying β-catenin subcellular dynamics and cyclin D1 mRNA transcription during Wnt signaling in single living cells.Elife5,e16748 (2016).
23. Hernández, A. R., Klein, A. M. & Kirschner, M. W. Kinetic responses of β-catenin specify the sites of Wnt control.Science338,1337–1340 (2012).
24. Orsulic, S., Huber, O., Aberle, H., Arnold, S. & Kemler, R. E-cadherin binding prevents beta-catenin nuclear localization and beta-catenin/LEF-1-mediated transactivation.Journal of cell science112,1237–1245 (1999).
25. Nicolás, F. J., De Bosscher, K., Schmierer, B. & Hill, C. S. Analysis of Smad nucleocytoplasmic shuttling in living cells.Journal of cell science117,4113– 4125 (2004).
26. Brandl, M.et al.IKKαcontrols canonical TGFβ–SMAD signaling to regulate
genes expressing SNAIL and SLUG during EMT in Panc1 cells. J Cell Sci
123,4231–4239 (2010).
27. Chen, B.et al.Small molecule–mediated disruption of Wnt-dependent signal-ing in tissue regeneration and cancer.Nature chemical biology5,100 (2009).
28. Simpson, M. L., Cox, C. D. & Sayler, G. S. Frequency domain analysis of noise in autoregulated gene circuits.Proceedings of the National Academy of
29. Nunns, H. & Goentoro, L. Signaling pathways as linear transmitters.eLife 7,
e33617 (2018).
30. Davis, P. K., Ho, A. & Dowdy, S. F. Biological methods for cell-cycle syn-chronization of mammalian cells.Biotechniques30,1322–1331 (2001).
31. Kraeussling, M., Wagner, T. U. & Schartl, M. Highly asynchronous and asymmetric cleavage divisions accompany early transcriptional activity in pre-blastula medaka embryos.PloS one6,e21741 (2011).
32. Massagué, J., Blain, S. W. & Lo, R. S. TGFβ signaling in growth control, cancer, and heritable disorders.Cell103,295–309 (2000).
33. Davidson, G. & Niehrs, C. Emerging links between CDK cell cycle regulators and Wnt signaling.Trends in cell biology20,453–460 (2010).
34. Filvaroff, E. H., Ebner, R. & Derynck, R. Inhibition of myogenic differentiation in myoblasts expressing a truncated type II TGF-beta receptor.Development
120,1085–1095 (1994).
35. Budasz-Rwiderska, M., Jank, M. & Motyl, T. Transforming growth factor-beta1 upregulates myostatin expression in mouse C2C12 myoblasts. Journal of physiology and pharmacology: an official journal of the Polish Physiological
Society56,195–214 (2005).
36. Miettinen, P. J., Ebner, R., Lopez, A. R. & Derynck, R. TGF-beta induced transdifferentiation of mammary epithelial cells to mesenchymal cells: in-volvement of type I receptors. The Journal of cell biology 127, 2021–2036 (1994).
37. Piek, E., Moustakas, A., Kurisaki, A., Heldin, C.-H. & ten Dijke, P. TGF-(beta) type I receptor/ALK-5 and Smad proteins mediate epithelial to mesenchymal transdifferentiation in NMuMG breast epithelial cells. J cell Sci 112, 4557– 4568 (1999).
38. Stroschein, S. L., Wang, W., Zhou, S., Zhou, Q. & Luo, K. Negative feedback regulation of TGF-β signaling by the SnoN oncoprotein. Science 286, 771– 774 (1999).
39. Miyazono, K. Positive and negative regulation of TGF-beta signaling.J Cell Sci113,1101–1109 (2000).
40. Jho, E.-h.et al.Wnt/β-catenin/Tcf signaling induces the transcription of Axin2,
a negative regulator of the signaling pathway.Molecular and cellular biology
22,1172–1183 (2002).
41. Niida, A.et al.DKK1, a negative regulator of Wnt signaling, is a target of the β-catenin/TCF pathway.Oncogene23,8520 (2004).
42. Cong, L. et al. Multiplex genome engineering using CRISPR/Cas systems.
43. Waters, J. C.Accuracy and precision in quantitative fluorescence microscopy
2009.
44. Sommer, C., Straehle, C., Koethe, U. & Hamprecht, F. A.Ilastik: Interactive
learning and segmentation toolkitin2011 IEEE international symposium on
biomedical imaging: From nano to macro(2011), 230–233.
45. Efron, B. & Tibshirani, R. J. An Introduction to the Bootstrap (Chapman&
C h a p t e r 3
TWO ELEMENT TRANSCRIPTIONAL REGUATION IN THE
CANONICAL WNT PATHWAY
3.1 Introduction
An important step in a cell responding to signal is the conversion of intracellular signal into transcription of particular genes. In a signal transduction pathway, this step is typically mediated by a transcription factor recognizing a specific cis-element in the DNA and initiating transcription. A typical signaling pathway, however, functions in thousands of different processes. These diverse outcomes may partly be explained through multiple complexities that have emerged at the transcriptional regulation. For instance, transcriptional outcomes could be tuned by the presence of different co-factors, or different chromatin modifications, or other transcription factors induced by signaling cross-talk. Here, we present another layer of complexity in which a transcription factor of a signaling pathway utilizes two distinct cis-elements in a gene’s promoter.
The canonical Wnt pathway provides a representative model system to investigate how signal in converted into transcriptional response. The Wnt pathway regulates numerous fundamental processes throughout development and adult physiology, and is often disrupted in diseases [1–3]. Signal activation in the pathway is transduced by the β-catenin protein (Figure 3.1A). In the absence of Wnt stimulation, β-catenin is rapidly phosphorylated and degraded by a large destruction complex, built of multiple scaffolds (APC and Axin1) and kinases (GSK3βand CKIα). Wnt stimulation inhibits the destruction complex, leading to accumulation ofβ-catenin. Together with the Tcf/Lef transcription factors, β-catenin regulates a large cassette of genes by binding to a specific DNA sequence, CTTT GAWS [4]. This motif, known as the Wnt-Responsive Element (WRE), was identified through directed and random screen studies [5–8]. The prevalence of WRE in the Wnt target genes was observed in chromatin immunoprecipitation studies [9–12]. In some contexts, Tcf binding to WRE is potentiated by a nearby, within 10-bp proximity, Helper site, GCSGS [8].