LOCALIZATION OF SOURCES OF HUMAN EVOKED RESPONSES
Thesis by
Robert Nicholas Kavanagh
In Partial Fulfillment of the Requirements for the Degree of
Doctor of Philosophy
California Institute of Technology Pasadena, California
1972
ii
-ACKNOWLEDGEMENT
I would like to sincerely thank my advisor, Dr. Derek H. Fender for his guidance throughout this research. Besides being my tutor and source of inspiration, he also spent many hours helping me to make this thesis as readable as possible.
Fellow students are also to be relied upon for encouragement and technical assistance. I have been fortunate to know at least one physicist, Stewart Loken; one wizard of all things optical, Cary Lu; one healer of psychological lesions, Bill Dodson; and two gentlemen who were always willing to listen and suggest reasonable things, Bill Hill and Gaetan St-Cyr. I wish to give special thanks to Tony Goodwin, my office mate, who shared many technical discussions and also proofread the thesis.
Individual thanks also go to Dr. W. R. Smythe for his many helpful suggestions in developing the theoretical models; to Roberta Duffy and Dee Van Ingen who typed the final copy and finally to my wife Carol, who never complained about subordinating her needs to the production of this thesis.
This work was supported by NIH Grant GM 01335, which also provided a Traineeship for my own financial support during the
iii -ABSTRACT
The evoked response, a signal present in the electro-encephalogram when specific sense modalities are stimulated with brief sensory inputs, has not yet revealed as much about brain function as it apparently promised when first recorded in the late 1940' s. One of the problems has been to record the responses at a large number of points on the surface of the head; thus in order to achieve greater spatial resolution than previously attained, a 50-channel recording system was designed to monitor experiments with human visually evoked responses.
Conventional voltage versus time plots of the responses were found inadequate as a means of making qualitative studies of such a large data space. This problem was solved by creating a graphical display of the responses in the form of equipotential maps of the activity at successive instants during the complete response. In order to ascertain the necessary complexity of any models of the responses, factor analytic procedures were used to show that models characterized by only five or six independent parameters could
adequately represent the variability in all recording channels.
One type of equivalent source for the responses which nieets these specifications is the electrostatic dipole. Two different
dipole models were studied: the dipole in a homogeneous sphere and the dipole in a sphere comprised of two spherical shells (of
iv
-sphere of a third conductivity. These models were used to determine nonlinear least squares fits of dipole parameters to a given potential distribution on the surface of a spherical
approximation to the head. Numerous tests of the procedures were conducted with problems having known solutions. After these
theoretical studies demonstrated the applicability of the technique, the models were used to determine inverse solutions for the
evoked response potentials at various times throughout the
Chapter I II
III
IV
v
VI
v
-TABLE OF CONTENTS
Title Page
Introduction 1
Experimental Methods and Preliminary
Data Presentation 26
The Dimensionality of the Human Visual
Evoked Response 62
Models of Evoked Response Generators as Dipoles in Homogeneous and Non-homogeneous
Spheres 111
Equivalent Dipoles for Human Visually
Evoked Responses 155
Discussion 218
Appendices
A. The Dipole in a Homogeneous Sphere B. The Dipole in a Homogeneous Sphere Surrounded by Two Concentric Shells of Different Conductivities
C. Details of Preliminary Data Re-Formatting
239
253
1
-I. INTRODUCTION
As an undergraduate, the author once attended a physics lecture during which elementary electronics was discussed. During the lecture the instructor mentioned some of the more common electronic devices, including the capacitor. At this point one of the students raised his hand and said he had never seen nor heard of such a device, and could the instructor please describe one in more detail. The rather perplexed lecturer asked if it was really true that the student had no idea of the nature of a capacitor and was quite apparently disappointed when the student reaffirmed his lack of experience. Perhaps to recover his confidence by passing the whole affair off lightly, the instructor quickly drew the
standard representation of a capacitor, 2 parallel lines, on the blackboard and said as sincerely as was possible to the trouble-some student "If you have indeed never seen one before, THERE'S
ONE!"•
2
-the evoked response is in many ways only symbolic of processes and properties not at all revealed by the tracing of the response itself. The motivation for this thesis was to search out some of the hidden meaning; some of the generic make-up of the human visual evoked response. To begin, a brief outline of some of the neurophysiological milestones which led to the discovery of evoked responses is given.
1. The Beginnings of Recording Brain Activity
The study of neurophysiology in its broadest sense has a long history; excellent summaries have been written and are recommended reading for neophytes in almost all scientific
disciplines. Two articles by Brazier ( 1, 2) in particular, provide insight into some of the early concepts of neurological structures and processes.
3
-evoked responses, since he did excite the visual system with brief stimuli, in attempting to locate specific sensory areas.
Fifteen years later, in Krakow Poland, Adolf Beck (4) independently discovered spontaneous activity in dogs, apparently not knowing of the work of Caton in 1875. Along with other
investigators, Beck nurtured the growing science of brain wave recording into the twentieth century and beyond, but the literature was conspicuously quiescent for some thirty years.
In 1929 Hans Berger (5) became the first to record, from the intact skull, electroencephalographic potentials in normal man and gave the names alpha and beta to its two principal rhythms. His work began what is now called clinical electroencepholography.
4
-This is not to say that rigorous analyses have not been successfully attempted. Spectral analysis of the EEG has revealed much information about the basic rhythms pre sent. While there are some cautions to be observed concerning possible errors caused by inadequate sample length ( 18), it seens certain that this type of time series analysis will continue to be useful in EEG studies. Other analytical tools such as correlation theory and factor analysis have also been used, but most of these more
objective analyses of spontaneous activity are in their "formative" stages.
An example of spontaneous activity is shown in Figure 1-1. It is characterized by relatively large amplitude, low frequency activity when the attention of the subject is low, and lower
amplitude, higher frequency activity as the level of alertness increases. Recordings made from the scalp typically lie in the range
t
50 µ v, with very little measurable energy above 50 Hz in frequency.In this study no attempt will be made to analyze
spontaneous EEG, and in fact it will be regarded as "noise. " The focus of attention is rather on a particular event in the EEG which can be elicited in a relatively controlled fashion, the evoked
response.
IXCITEO
ACLAX[O
o"ow s'
&
I
ASLEtPa I a A
-I
OE[P SLCEP
I
J S[C . . - 10 }'Y•
Figure 1-1. Spontaneous EEG activity in the human at different levels of alertness. From Jaspar ( 13).
6
-· could say that an evoked potential, or evoked response, is that component of the EEG which can reliably be identified as the response to a brief stimulus to one of the sense modalities.
Further, this response is definitely time-locked to the occurence of the stimulus.
This definition says many things. Obviously it suggests that the evoked response is recorded with much the same equipment used to record spontaneous EEG. Secondly, one must emphasize the qualification regarding the cause and effect relationship with the stimulus. Successive presentations of a given stimulus should produce identical responses. It will be seen that in actual experi-mental conditions the average of many responses to the same
stimulus is in fact identified as the evoked response. Our
experience suggests that generally there is little difference between the average of the first half of say 100 responses and the average of the second half, hence this stimulus-response relationship seems to be an experimentally verified aspect of the definition.
Note that practically one can record evoked responses from only three sense modalities. Since it is difficult to arrange a
brief stimulus of either smell or taste, we are left with the
7
-The spontaneous activity constitutes the background from which the evoked response must be extracted. If a 2-3 tJ.Sec light flash is presented to a subject, an electrical event lasting some 300 ms occurs in the EEG. The detection problem is that evoked responses recorded from the scalp usually do not exceed
t
5 f.Lv, and hence are almost impossible to "see" because of the larger amplitude spontaneous activity. The responses are more easily seen of course when recordings are taken from exposed cortex, but detection through the intact skull has had to await the improve-ment of recording techniques, Dawson ( 7), in 194 7, was the first to use signal averaging techniques to improve the signal to noise ratio. His technique was to superimpose the activity immediately following several stimuli on an oscilloscope screen and thus achieve enhancement of the signal.Today the same principal is used in a slightly different manner. Many stimuli are presented and a trigger signal at
stimulus onset time is used to initiate the "sweep" of a small
computer specially designed to do signal averaging. The computer then samples the signal (spontaneous background activity plus
evoked response) at regular intervals (say one ms) for the expected duration of the evoked response (say 250 ms). The samples taken during the first sweep are stored in some digital storage medium and the sampled responses to successive stimuli are then summated with all previous samples. In this way activity which is correlated
8
-additively enhanced while non-correlated activity (the spontaneous EEG) averages to zero for a sufficiently large number of stimuli (usually 80 to 100 for visually evoked responses).
In order to see this, consider that the response recorded after a single stimulus is composed of two parts, the "signal" (the evoked response) and the "noise" {the background spontaneous activity); i.e., let
f{t) = s{t)
+
n(t)be the recorded signal, where s{t) is the evoked response and n{t) is the noise. The noise term can be considered to be Gaussian,
"th d . 2
w1 mean zero an variance er • After averaging the responses to several stimuli, however, consider the expected value of f{t):
E [f{t)]
=
E [s{t)+
n{t)] = E [s{t)]+
E [n(t)]It is assumed that the evoked response is constant over successive stimuli, hence, since E [n{t)]
=
0,E[f(t)] = s(t)
Moreover, define the signal to noise ratio to be the r. m. s. value of the signal divided by the r. m. s. value of the noise. For some sample time, say t., the r. m. s. value of the signal is
1
simply s(t.), while that for the noise is er. Therefore, at each point
1
t. of the response to a single stimulus, the signal to noise ratio is 1
s(t.)/
er •
After averaging say n responses, however, the noise 19
-value of the signal is still s(t.). Hence, the signal to noise ratio 1
after averaging is s(t.) •
"1D.!
CT , an improvement of ..fn.1
The spontaneous EEG is probably not Gaussian distributed over short intervals, but over several successive stimuli this assumption becomes more and more acceptable. Slight departures from these assumptions are not, however, sufficient to negate the validity of this averaging technique.
3. The Challenge of the Evoked Response
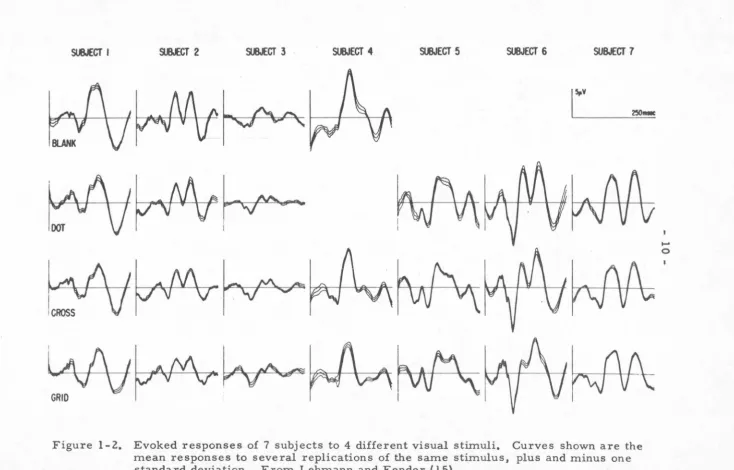
The above and similar techniques have led many· investigators, in the score of years since Dawson refined his techniques, to an exciting yet frustrating conclusion. Recordings on many human subjects have shown unquestionably that a given subject in a constant experimental condition will give evoked responses of high repeatability. Experiments repeated over a period of perhaps weeks show this enticing reliability of the response of a given subject to the same stimulus. Figure 1-2
exemplifies this fact: the responses for each subject are presented as the mean response over consecutive sessions closely bracketed
by the mean plus or minus one standard deviation. There is a
Sl.6.IECT I &&CT 2 Sl&ECT 3 Sl8JECT 4 SllJJECT 5 SlMJECT 6 SUBJECT 7
,~y
250-.... > • • • I .... ,
¥I#'~
i
""" I I I I I
pE~
I • \ A+
1>f-"'
A \ A~
ft I~
l I \ I \ I I - I I IFigure 1-2. Evoked responses of 7 subjects to 4 different visual stimuli. Curves shown are the mean responses to several replications of the same stimulus, plus and minus one standard deviation. From Lehmann and Fender ( 15).
[image:15.769.18.752.43.513.2]11
-certain peaks in the response are dependent upon decision-making by the subject ( 23); and even that the shape of the visual evoked response in cats is directly related to the probability of firing of single cells in the visual cortex (9). Despite these and other
valuable building blocks, however, a recent review by Lindsley ( 17) realistically admits that evoked response research has thus far failed to open any doors to great neurological insights.
There are many reasons for the slow advance of under-standing in this area. Some are technical in nature, such as the difficulty in comparing results from one experimenter with those of another. Many investigators still consider upward deflections on an oscilloscope to denote negativity, making it necessary to mentally "flip" their recording to agree with normal polarity conventions. In addition, it is very difficult to report precisely the locations of recording electrodes. The so-called 10-20
electrode system ( 12) is an attempt to produce a standard reference system, but it still remains for the experimenter to place his
electrodes accurately according to this or any other reference scheme. What is desired perhaps is some form of stereotaxic instrument for electrode placement. In short, variations in recording technique have somewhat confused the evoked response literature.
12
-given experiment. A human is such a profusion of neurological responses to his environment that obviously the psychological and neurological states of different subjects cannot be expected to be identical even in the same experimental environments. It would seem that very often the evoked response is as individual as the subject's signature, and these large differences between subjects could obscure any common facets of the response pattern.
There are thus a myriad of confusing features of an evoked response. Even after attempting to eliminate the spontaneous EEG from the recording, what remains is a very complex signal. In spite of the repeatability of the signal, there are today very few inferences that can be made concerning the relationship between the evoked response and the cortical processes underlying it. 4. Neuro-anatomical Origin of the Evoked Response
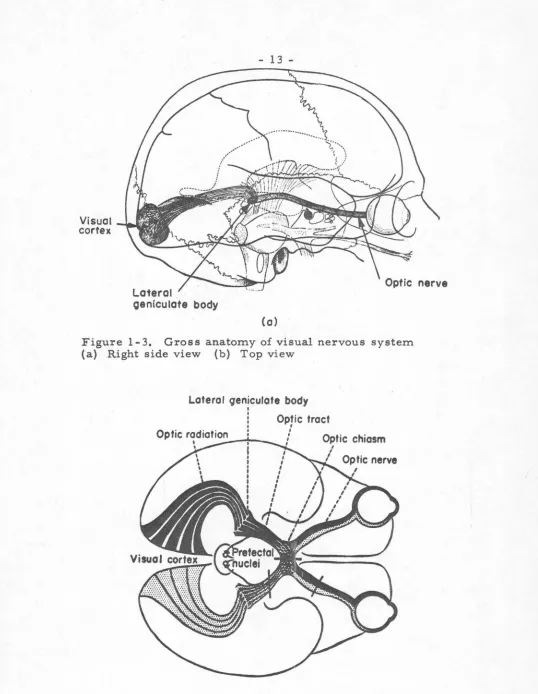
The gross features of the human visual nervous system are shown in Figure 1-3. Briefly, we see that afferent information passes from the retina to the primary visual cortex, passing on the way through a sub-cortical relay station, the lateral geniculate body. A partial bifurcation of the optic nerve occurs at the optic chiasm, where fibers originating from the nasal retinae cross one another, resulting in representation of the left visual field in the right half of the brain and vice-versa. This reversal of topology is common in many nervous systems.
Visual cortex
Lateral .
oeniculate body
13
-(o)
Figure 1-3. Gross anatomy of visual nervous system (a) Right side view (b) Top view
Lateral qeniculate body
Optic tract
,
(b)
,
f
Optic chiasm II I
[image:18.565.16.554.27.721.2]14
-does influence the "visual association areas"- --areas 18 and 19, but precise description of the spatial and temporal connections along this path are of course difficult to obtain. Similarly it seems certain that information is shared between the hemispheres across the corpus collosum, but again the histological tracing of this sensory route is slow to obtain.
In addition to not knowing the total spread of visually
excited pathways, the function of each site along the way will not be completely described until many more studies are done. The optic tracts quite apparently pass through the lateral geniculate bodies and make synaptic contacts there, but the role of this intermediate station is understood only up to the point of being some type of "relay" center.
Finally, the temporal course of events in the visual nervous system is again unclear. Studies of retinal delay time have shown that parameter to be dependent upon stimulus intensity, ranging from 20 to 35 ms at low stimulus levels to about 5 ms at higher levels ( 22). The overall delay time from stimulus to appearance of correlated activity in the cortex has been estimated at 35 - 40 ms (22). Beyond these gross features, however, the timing of events along the visual pathway also appeals to further experimentation.
Information 15 Information
-A
B
c
D
E
I
n
l
!
l
A '
• ! ...4
•
A
•
•
!
'
...
j'
j'
m
•
.
,
!
•
•
'
• 1
j ·•
~'
A
~N
v
[image:20.571.24.549.27.736.2]16
-carrying connections are niade both parallel to the axis of the
columns and transverse to it (parallel to the surface of the cortex). The problem at this stage of course is to adequately catalogue even a small number of neurones, complete with a careful mapping of their origins and destinations within the brain.
Thus there are two anatomical extremes presented by Figures 1-3 and 1-4. Neither level of organization is adequately understood, and of course knowledge of the neuronal level is precursory to filling in gaps at the gross level. On the one hand, studies of the properties of single neurones continue to define the basic properties of these fundamental neural building blocks. The
classic work of Hubel and Weisel (11) and Lettvin et al. (16) are good examples of this methodical study of single cells. Work on the gross features, on the other side of the problem, also continues with gross EEG recordings and similar studies. The conceptual problem is to be able to extrapolate gross behavior from single neurone properties or vice-versa. Certainly models of nervous networks, based on known cellular properties, have been made and are viable tools. These models, however, seldom include more than say 100 neurones, and it is difficult to imagine even the largest of computers being capable of extending these "synthetic"
studies to any reasonable fraction of the entire nervous system. Similarly, it is very unlikely that current studies of gross activity will shed very much more light on single cell properties. The
17
-the activity is -the averaged or lumped effects of so many cells, that it seems ludicrous to think of identifying the effect of any single neurone.
It is not the purpose of this thesis to demonstrate that these two approaches to studying the nervous system can be brought to collide head-on. Rather it is hoped that the studies here will suggest a method of bridging in some small part this gap in inter-pretation of available data. The method by which this will be attempted is to study the activity of some restricted but still large population of neurones. The visual evoked response is after all quite specific to visual activity. By studying this event at many more sites on the scalp than previously attempted it is hoped that
some new interpretive skills can be developed.
The difficulty in understanding the causal relationships
between complicated nervous structures and their external electrical manifestations cannot be overstated. The question is: what really is measured by a gross electrode which records transcranial
electrical activity? To be sure millions of individual neurones are active at any one time, and the manner in which the activity of each is combined, distorted, attenuated and otherwise manipulated before being sensed by a single electrode on the scalp is complex to say the least. There are many controversies which have sprung from this enormous interpretive difficulty. Space and time permit only those of direct significance to the present work to be
18
-Firstly, does the scalp EEG represent the summated effects of neuronal action potentials, or does it arise from the multitude of post-synaptic or generator potentials in the cortex? Observe that most arguments that support one of these two
hypotheses must also support the other - an increase in post synaptic potential activity must of necessity engender an increase in the number of action potentials and vice-versa. Even if influence in the brain is much more inhibitory than excitatory, a strong
19
-There are two observations which could perhaps buoy up the
idea that EEG activity comes from synaptic potentials. First it has already been mentioned that very little energy is found
above 50 Hz in a typical EEG. Since action potentials have rise times less than a millisecond long one could say that the very
absence of high frequency activity rules out the influence of single spike activity on EEG. Also it is said ( 21) that over 90 percent of the average neuronal surface area is dendritic, hence by virtue of such a large number of synaptic sites the greater component of the EEG must arise from these generator potentials.
Countering the idea that single spike activity is absent from the scalp activity is again the realization that millions of neurones
are likely to be firing closely upon one another. The human nervous system probably does not rely on smaller populations of
5
neurones than say 10 to process sensory inputs. No matter how
insignificant the stimulus, many thousands of neurones are likely to be regimented into activity. Hence, it is still perhaps the
"envelope" of all such action potentials that is recorded and it only remains for recording techniques to improve in order to resolve the
individual neural spikes omnipresent in the EEG.
The presence of dendritic contributions to the electric potentials measured on the scalp is almost inescapable. While
20
-however, a subject requiring further study. What is undertaken in
this thesis does not depend on the details of ascribing the makeup of the EEG signal to the two processes above. It is sufficient that in the case of the evoked response there is some repetitive, synchro-nized activation of a certain population or populations of neurons during the time following the stimulus. These features are sufficient to study the evoked response from the standpoint of localizing these neurone populations within the brain.
5. Attempts at Localization of EEG Generators
As will be seen, the principal thrust of this thesis is to develop some techniques to localize equivalent cortical sites of evoked response activity. This is one of the most tantalizing prospects in electroencephalographic research. Generators of both the spontaneous activity as well as evoked responses are
sought; clinical work has frequently been motivated in this direction and neurophysiologists in general have joined in the pursuit. Brazier ( 3} has made some attempts to locate sources of spontaneous EEG, and some tentative studies of localization of
evoked response activity have appeared (e.g. Paicer, Sances and Larson ( 19}}. These localization studies are not of course free of either conceptual or analytical problems.
One of the problems concerns the applicability of "volume conduction 11 to EEG phenomena. A very detailed and complete description of this theory - essentially a consideration of this
21
-in their normal environments - is available -in Plonsey ( 20). The
essence of the theory is very simple: even though the current
density associated with either an action potential or a synapse is
maximal close to the excited site on the neurone, the current must
be continuous throughout all conducting media enclosing the
activity. Hence, an electrode even remote from the neural event
can, by the properties of electromagnetic fields, be sensitive to
the event.
The validity of the theory of volume conduction for all types
of EEG activity has been questioned, as discussed in a recent
report by Vaughn (21). Specifically, it is said to be difficult to
apply the theory to localization of cortical generators when these
generators are large in number, as is apparently the case with
spontaneous activity. When study is confined to evoked responses,
however, the situation is described as much ameliorated, since
there is evidence { 14) to suggest that the scalp potentials recorded
at sites remote from primary projection areas arise from volume
conduction. The caution, as correctly stated, is not that increasing
the number of generators invalidates the theory of volume
conduction --- only that the interference between all these
generators clouds any attempts to localize any or all of these active
sites. In the extreme case of most spontaneous activity it seems
inescapable that the cortical generators are so profuse that no
22
-this thesis I am in fact dealing with only evoked response activity I embrace the applicability of the theory, along with certain other assumptions discussed in Chapter Four.
A very important instrumentation problem is apparent in localization studies. If one is to determine the most probable focus of activity giving rise to the scalp potentials it is important to record these scalp potentials over a large number of sites. In other words, one must be equipped to "map" the distribution of potentials on the head. This is not a trivial consideration by any means, and most laboratories are restricted in this regard by
recording systems capable of registering fewer than ten channels. Many more difficulties will be encountered as attempts to localize cortical generators become more and more refined, but it now appears that a certain momentum is developing toward discovering the elusive sources of EEG and evoked responses. 6. The Goals Set for this Research
In this chapter most of the salient obstacles to knowing the relationship between cortical activity and scalp EEG phenomena have been raised. In short, the neuroanatomical origin of most
such phenomena is unknown. The question of synaptic activity predominating over action potentials is unresolved and requires more extensive study. As to the localization of cortical generators, it seems that at present litUe can be done with spontaneous
activity, due to the predominantly intuitive idea that many
23
-seem to hold some promise. It will hopefully be shown that by
mapping the potential field on the head and applying the volume
conduction theory it is possible to locate equivalent generators for
visual evoked responses.
The point is well taken that this analysis is a formidable
task. This study was not undertaken in expectation of stumbling upon some chance correlation of the evoked response activity with
other neurophysiological evidence. At all times the author has
attempted to keep firmly in mind the actual physical constraints of
the problem. Certainly some simplifying assumptions will be
made, but these assumptions (concerning head shape, conductivity
discontinuities, etc.) are at least consistent with as much
available data as possible. The methodology is a compromise
between extending rigorous mathematical treatment of the
localization problem on the one hand and gathering meaningful
1. 2.
3.
4.
5.
6.
7.
8.
9.
10. 11. 12. 13.24
-REFERENCES FOR CHAPTER I
Brazier, M.A. B., "Rise of Neurophysiology in the 19th Century," J. Neurophysiol. 20(1957), pp. 212-226. Brazier, M.A. B., "The Historical Development of
Neurophysiology, 11 Handbook of Physiology, Sec. 1
Neuro-physiology
.!. (
19 59), pp. 1-58.Brazier, M. A. B. , ''A Study of the Electrical Fields at the Surface of the Head, 11 Electroenceph. clin. Neurophysiol.
Suppl.~(1949), pp. 38-52.
-Beck, A., "Die Bestimmung der Localisation der Gehirn und Ruchenmarksfunktionin vermittelst der elektrischen
Erscheinungen, 11 Centralbl. Physiol. 4 (1890), p. 473.
Berger, H., "Uber das Elektrekephalogramm des Menschen," Arch. Psychiat. Nervenkr., 87 ( 19 29), pp. 527-270.
Caton, R. , "The Electric Currents of the Brain, 11 Brit. Med.
J. ~ ( 1875), p. 278.
Dawson, G.D., "Cerebral Responses to Electrical Stimulation of Peripheral Nerve in Man, 11 J. Neurol.
Neurosurg. Psychiat.
_!£
(1947), pp. 134-140.Duke-Elder, S. (ed.) Sl,stem of O~thalmolo~ Vol. II The Anatomy of the Visual ystem,
C. •
Mosby o. , St. Louis, ( 1961), pp. 585-694.Fox, S.
s.
and O'Brien, I. H., "Duplication of Evoked Potential Waveform by Curve of Probability of Firing of a Single Cell, 11 Science 14 7 ( 1965~ pp. 888-890.Guyton, A. C., Textbook of Medical Ph;siology, W. B. Saunders Co., Philadelphia ( 1967), p. 46.
Hubel, D. H. and Wiesel, T. N., "Receptive Fields of Single Neurones in the Cat's Striate Cortex, 11 J. Physiol. 148
(1959), pp. 574-591. -
-Jasper, H. H., "Report of the Committee on Methods of Clinical Examination in Electroencephalography, "
Electroenceph. clin. Neurophysiol.
_!£
(1958), pp. 371-375. Jasper, H.H., in Penfield, W. and Erickson, T. C. (eds.),E~ilef sy and Cerebral Localization, Thomas Co. Springfield
25
-14. Kelley, D. L. , Goldring, S. and 0 'Leary J. L. , "Averaged Evoked Somatosensory Responses from Exposed Cortex in
Man," Arch. Neurol.
_!l
(1965), pp. 1-9.15. Lehmann, D. and Fender, D. H., "Component Analysis of Human Averaged Evoked Porentials: Dichoptic Stimuli Using Different Target Structure," Electroenceph. clin. Neuro-physiol., 24 (1968), pp. 542-553.
16. Lettvin, J. Y. , Maturana, H. R. , Pitts, W. H. and
McCulloch, W.S., "What the Frog's Eye Tells the Frog's Brain, 11 Proc. Inst. Radio Engrs. 47 (1959), pp. 1940-1951.
17. Lindsley, D.B., "Average Evoked Potentials - Achievements, Failures and Prospects," in Donchin, C. and Lindsley, D. B. (eds.} Average Evoked ~otentials -- Methods, Results, and Evaluations,
NASA
publ.SP-191
(1969), pp.1-43.
18. Meshalkin, L.D. andEfremova, T.M., 11Estimationofthe
Spectra of Physiological Processes over Short Intervals of Time," in Livanov, M. N. and Rusinov, V.S. (eds.)
Mathematical Anal sis of the Electrical Activity of the Brain,
am r1 g~ , pp.
19. Paicer, P. L., Sances, A. and Larson, S. J., "Theoretical Evaluation of Cerebral Evoked Potentials, 11 Proc. 20th Ann.
Conf. Engrg. in Med~ and Biol.'( 1967), p. 14. 1.
20. Plonsey, R., Bioelectric Phenomena, McGraw-Hill, New York ( 1969).
21. Vaughn, H. G., "The Relationship of Brain Activity to Scalp Recordings of Event-Related Potentials," in Donchin, D. and Lindsley, D. B. (eds.} Average Evoked Potentials -Methods, Results and Evaluations,
NASA
publ. SP-191( 1969),
pp.45-94.
22. D. and Parr. G. (eds)
-- AS osium on its Various
spects, • p
23. Walter, W. G., Cooper, R., Aldridge, V. J., McCallum,
w.
C. and Winter, A. L., "Contingent Negative Variation: And Electrical Sign of Sensorimotor Association and Expectancy in the Human Brain," Nature, 203 (1964),26
-II. EXPERIMENTAL METHODS AND
PRELIMINARY DATA PRESENTATION
1. An Overview of the Experimental Environment
The data analyzed in this study were recorded at the Smith-Kettlewell Institute of Visual Sciences, Pacific Medical Center, in San Francisco. Much specialized equipment is necessary to
record human visual evoked responses, and a cooperative effort with Dr. Dietrich Lehmann and Mr. Jules Madey at the institute was undertaken in order to acquire the necessary data.
Figure 2-1 shows the essential features of a typical experiment. The subject, stimulation apparatus and
pre-amplification equipment are all situated in a shielded, darkened, sound-attenuating chamber. A troposcope display device delivers visual stimuli binocularly to the subject, and in this way various combinations of steady illumination of one or both eyes, structured patterns ·shown to one or both eyes and light flashes shown to one or both eyes can be achieved. Light stimuli were derived from a Grass type PS-2 photostimulator, at an intensity setting of 8.
PHOTO STIMULATOR
TROPOSCOPE DISPLAY
SYSTEM
REFERENCE SIGNAL---'
27
-.
...
•
.
I50 CHANNEL AMPLIFIER
TRIGGER SIGNAL
ANALOG
MULTIPLEXER
t
0 0
7-TRACK FM TAPE RECORDER
DE-MULTIPLEXE
[image:32.570.17.551.33.747.2]28
-recorder. An entire experiment, consisting of perhaps several
replications of several experimental conditions, is recorded
continuously in the form of EEG data on the recorder. Also
retained are signals denoting stimulus onset times and other
timing information necessary to recover and average the responses
from individual channels. After the data have been recorded in
this way there follows a long process of averaging from stimulus
onset time, for a given channel, the responses to each of eighty to
one hundred flashes. This is derived by playing back the FM tape,
demultiplexing the data samples and averaging in a signal averager
(in this case a Computer of Average Transients, model 1000). The
CAT averages four channels at a time, sampling each channel every
one ms for a total of 256 ms. Finally the visual evoked responses,
now in digital form, are punched onto paper tape for analysis.
In the experiments used in this study, two subjects were
used: an adult male (KW) and an adult female (DALO). Both
subjects were normal. Data have been recorded from more
subjects (in the order of ten) than the two used here, but the results
from this larger group have not yet been analyzed.
The experimental conditions were very simple--unstructured
light flashes to left, right or both eyes. In the case of subject KW,
29
-used as reference, while the DALO data were derived from thirty-eight monopolar channels using a "phantom" reference electrode to be described later.
In chapter I it was mentioned that there are many sources of variability in evoked response experiments that can be identified with the psychic and physical states of the subjects. There are some steps to be taken to head off excessive problems in this respect (3). The subject should be comfortable in the apparatus; he should be well adapted to the low ambient illumination. Dilation of the pupils is desirable in order to standardize retinal illumination by the stimuli. Recording time should be both short and constant and some fixation procedure should be used to insure stimulating identical retinal areas.
There are also many instrumentation problems involved in this type of research. How many recording channels are necessary to characterize an evoked response? What can be used as the
reference or indifferent electrode for a given channel? Can all channels use the same indifferent electrode? In addition to these and other aspects of the recording environment, there are always the problems of deciding how the data can be summarized in the most meaningful manner. Some of these problems will be
30
-2. The Recording System Why fifty Channels?
Historically, EEG data have been recorded from a relatively small number of channels, usually twelve or fewer. The influence of clinical work is quite significant, since few diagnosticians can adequately analyze by eye a large number of channels.
During the study undertaken here, however, it was possible to record up to fifty channels inexpensively, and the question of ease of analysis was not a limiting factor since a large computer was available to do all of the drudgery.
Finding inexpensive systems to record up to fifty channels of EEG was not, however, the goal of this research. The real motivation for recording from so many channels was that it was necessary to accurately map out the potential distribution over the surface of the head in order to use the analytical techniques derived in this thesis. The visual evoked response desired was not just a
single channel nor even a small number of channels, but sufficient channels to define a "surface" of potential readings over a large portion of the skull.
31
-by Rush and Driscoll ( 10) it is stated that a spacing of five cm is
this lower limit, for a surface electrode. This conclusion came
about in a study of reciprocal relationships in the brain and its
surrounding tissues. Current was passed through surface
elec-trodes and fields were measured inside the skull. When the source
and sink electrodes were placed closer than five cm, the shunting
in the scalp between the electrodes caused very little current to
be passed through the low conductivity skull into the brain.
Ob-serve that this does not say that electrodes placed closer than five
cm and used to record EEG will measure the same signal strengths
--- the scalp does after all have a finite resistivity. A source
within the skull will produce a continuous voltage distribution on
the surface and electrodes at any spacing will still be sensitive to
differences between recording sites. Thus an average electrode
spacing was chosen which seemed reasonable both from the point
of view of placing the electrodes on the head of the subject and also
from considerations of resolution of the surface field. That spacing
is three cm, and one can empirically satisfy himself that in order
to place an electrode at a spacing of three cm over the area from
inion to just forward of the vertex and roughly from ear to ear of
an adult human, about fifty electrodes are required.
Clinical people will immediately realize the difficulty in
placing this number of electrodes on the subject. An experienced
32
-all electrodes on the head. Note also that the electrode placement scheme cannot possibly conform to the so-called 10-20 EEG
electrode scheme (2), offered as a standard system for describing electrode placement. These experiments, however, are a
considerable departure from the considerations which motivated the establishment of 10-20 system, since it was intended to be a clinical scheme.
Eventually it was decided that in order to alleviate the
problem of electrode placement, as well as to be able to accurately locate for later analysis the position of each electrode, a special recording helmet could be used. This helmet moulded to the head of a subject, would be lightly sucked onto the head with a vacuum system. The recording helmet, however, was still under development at the tilne the present results were taken. While the idea shows promise for future recordings, the data herein analyzed were recorded from electrodes attached in the normal manner. As closely as possible the electrodes were placed on the head of the subject in the pattern shown in Figure 2-2. In this way specifi-cation of a small number of parameters located the electrode array with satisfactory accuracy. The KW array was composed of six
3:3
-29
•
280
21
•
270
)(
13.
6
120
•
19
5.
0
18
II
'
10
0
0
2
•
I
•
'2 f
39 47
.;;J 0 0 0
230
15•
70
Figure 2-2 (a). Top and right side views of electrode placement for subject KW. Reference electrode was
[image:38.578.8.553.37.715.2]•61
0
11
•
•21
•62
12
<~6a 0
13
'22
63
~32
'14
023
'15
024
033
0
16
'25
034
043
'
26
"35
044
'36
•45
54
•
34
-'
41
'
42
•
~2
51
/
/
00
52
53
35
-3. The Problem of a True Reference Electrode
In the EEG literature today two problems still seem to be
given more attention than seems reasonable. Further, the diverse
opinions as to their solutions give rise in many cases to
observa-tions which cannot be compared with data from other experimenters
with different recording techniques.
The first problem is to find a truly indifferent electrode
for recording EEG data, and the second, really a variation of the
same problem, is whether monopolar or bipolar recordings should
be used.
Monopolar recordings are those in which the reference
inputs to all amplifiers are connected to a common point, most
likely some site on the head where EEG activity is expected to be
small (mastoid process, ear lobe etc.) Bipolar recordings on the
other hand are made with each amplifier connected to its own
"active" and "reference" electrodes.
Most clinical EEG recordings are made from bipolar leads,
that is, a differential amplifier is connected to two electrodes on
the head and thus measures the difference in voltage between this
pair of electrodes. Each amplifier is connected this way, and
thus if four channels are recorded, a total of four pairs of
elec-trodes :!.re used, either by placing eight elecelec-trodes on the head or
by placing fewer than eight and using some electrodes more than
36
-To an electrical engineer this is an extremely confusing method. The scheme is carried to its extreme as Grey- Walter ( 11), in a book on clinical methods, actually gives a formula for computing the nwnber of differential amplifiers "necessary" to "exploit" a given nwnber of electrodes!
One immediately recognizes that the formula is that for combinations of N things taken two at a time. The point is of
course that many of these "necessary" channels are derivable from combinations of others, and nothing is gained by adding more
amplifiers.
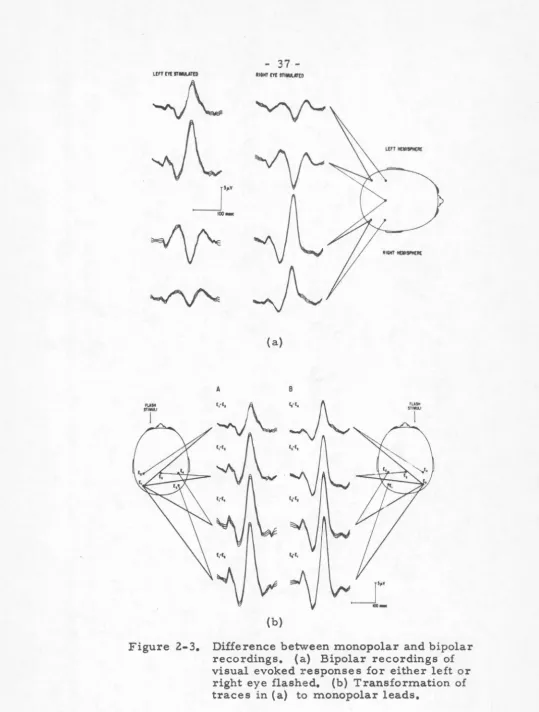
To illustrate the difference between monopolar and bipolar recordings, consider Figure 2-3. In (a) we see four bipolar leads and the responses therein to flashes in either the left or right eyes. Note that there is an apparent polarity reversal from homolateral to heterolateral hemispheres, a fact which many investigators would consider to be intrinsic to the response and probably
functionally meaningful. Inspection of the four bipolar leads shows that it is possible to derive monopolar leads from the same data, and thus refer four of the electrodes to one common reference. When the arithmetic is done, ie.
E
5-E1
=
(E5-E3)+
(E3-E1), etc.,we derive (b) in Figure 2-3. Now there is no polarity reversal across the mid-line, only a monotonic change in amplitude of the
LEn EYE sr..iu1t0
--A
~5~Y
100-~
,
...
STlllUU
I
A
- 37 -RllHT m STlllUlJr[O
~
~
(a)
B
{b)
L[FTHCM-11[
NIGllT--11[
'"'"'
SflWUl.1
I
Figure 2-3. Difference between monopolar and bipolar recordings. {a) Bipolar recordings of visual evoked responses for either left or
[image:42.571.11.550.26.737.2]38
-in a different manner. The apparently significant polarity reversal is merely the result of different reference systems!
Ideally one wants to measure monopolar potentials --- the activity of each electrode compared to some common, indifferent reference point. Should bipolar potentials be desired it is simple to find differences between pairs of monopolar potentials.
The problem is of course, where does one find an electrode truly indifferent to the EEG signals? Those authors who have attempted monopolar recordings have used many different sites: ear, vertex, mastoid process, etc. as the location of one electrode against which all others are compared. It is credible to say that these locations are usually relatively indifferent to EEG activity, but one can almost always demonstrate that some small potentials ascribed to the EEG are present even at these sites. It must also be pointed out that any single reference electrode must summate the ground return current from all active electrodes at that point. For a recording system such as is used here, however, the large number of electrodes spread over a considerabh portion of the head most probably carry signal currents whose ground returns
sum almost to zero.
39
-2
p
3
Figure 2-4. Sensitivity differences between electrode pairs. V
[image:44.576.9.551.27.726.2]40
-A voltmeter connected between electrodes 1 and 3 will measure
zero potential difference since these two electrodes lie on the
same equipotential line which would be caused by a dipole source
at the origin as shown. An instrument connected between
elec-trodes 1 and 2, however, will measure a deflection since electrode
2 is situated where the maximum potential will be attained. In
our recording system with a large number of electrodes, there
are electrodes which at some moment are at the same potential
as the reference site while others are not. A little reflection
should convince the reader that this is an acceptable and in fact
perfectly workable arrangement.
I
This author suggests that too many hours have been spent
in emotional support of one scheme or another, none of which
is really different from the others. Any single elect:t:"ode placed
on the body will be of necessity sensitive to line voltage
interfer-ence, muscle artifacts and EKG signals (whose magnitude is
roughly 1000 times that of the EEG). Furthermore the several
sites mentioned above are, for most purposes, electrically
equivalent. Think of the problem in a topographical manner:
at any point in time the voltages on the surface of the head trace
out some potential "surface", with peaks over the high amplitudes
and troughs over the low amplitudes. A "man" standing on this
surface somewhere can trace out the "shape" of the activity
relative to him no matter where he is on the surface. As long
41
-than the EEG signals, and in a way not equal to the influence at
other points (in other words, if some larger background activity
like the EKG shifts the entire surface up or down uniformly, the
relative shape is unchanged) ~is vantage is a viable one .
. We have found experimentally that placement of one
refer-ence electrode at a site even surrounded by the active monopolar
electrodes did not significantly change the shape of the responses
as compared vi th those using any other single reference point.
For subject KW this was the case; all forty-one electrodes
being measured relative to a forty-second electrode located at
the vertex.
As our theoretical work entered this area, however, we
arrived at a different system by the time data were taken for subject
DALO. For this subject and subjects following, a pseudo-electrode
was created and used as the reference point for all channels.
The creation of this electrode is dependent upon some
assumptions regarding the electromagnetic aspects of the system.
First, as is very lucidly discussed in Plonsey (8), the EEG signals
can be considered at each point in time as electrostatic in nature
-the recordings do not show large components at frequencies
suf-ficiently high to demand inclusion of electromagnetic effects
(the vector potential terms in Maxwells' equations can be ignored).
Treating the scalp potentials in this way leads to a second
42
-which gives rise to the potentials involves electronic charges -which
sum to zero (or at least a constant), the sum of the electrostatic
potentials measured over a closed surface bounding the charges
must also be zero or a constant.
Note that some portions of this supposed surface enclosing
the cortex are not normally recording sites (the face, frontal
surface, below the chin and ears, etc.). It is our observation
how-ever that these sites show little if any activity which can be
identi-fied with any portion of the evoked response recorded over the
more active areas of the skull. Therefore, to a first
approxima-tion, if the electrode array extends to those sites beyond which
the signal amplitude is below the system noise level, then the sum
of the potentials which exist over this unsampled area will be a
small and relatively constant level.
Thus it is reasonable to create a "phantom" reference
electrode by the scheme shown in Figure 2-5, due to Madey ( 5).
Each electrode is connected to a summing network which weighs
each channel equally in deriving an "average" electrode with
respect to which all channels are measured. The equivalent
local generators and their associated resistance are denoted
by the ek and R respectively. Assume R
< <
R< <
R. whereek e s i
R. represents the amplifier input impedance and is greater than l
43
[image:48.563.11.555.27.737.2]44
-1 n
e = A• ( ek - n- 'E ek)
Ok k=l
with small error. Thus if all Ak are assumed equal
n
L e
=
0k=l Ok
This idea is not new, since similar reference derivations
have been used in EKG recordings, and some systems even use
non-uniform weighting in the summing network to achieve electrode
sensitivities to certain cardiac events ( 6). In fact it is interesting
to note that Offner (7), who has had considerable influence in the
design of EEG recordimg systems, proposed such a scheme in
1950. Perhaps the fact that large numbers of electrodes are re-I
quired has slowed acceptance of the principle.
Before leaving this discussion, observe an opportunity
exists to test the validity of the "phantom" reference electrode
with the KW data. If ~he assumptions are correct, then the sum
of the forty-one potentials at each sample time, weighted equally
to produce the equivalent of the summing network shown in
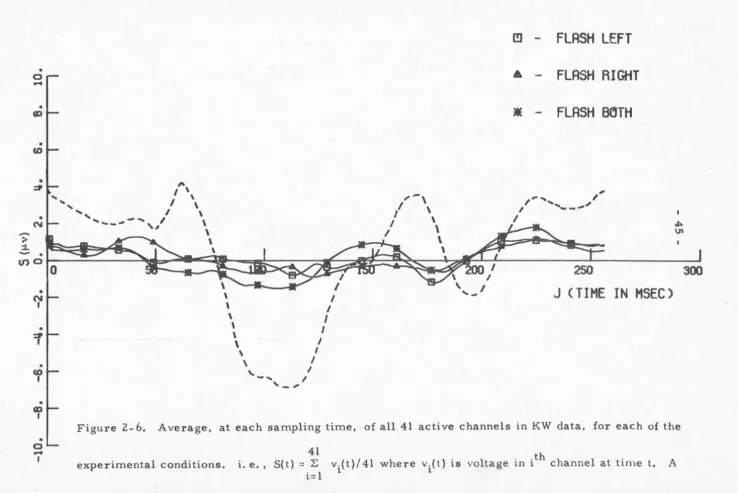
Figure 2-5, should be a small number. The results of performing
this operation are shown in Figure 2-6. Over the duration of the
response we see that the assumptions are reasonably justified
the sum is small if only piecewise constant.
One can test the hypothesis that the phantom electrodes
[image:49.569.8.554.36.720.2]C!l -
FLASH LEFT
•
0
• -
FLASH RIGHT
-•CID
• -
FLASH B6TH
•
co
r,
,-,
'
\' , I \ I \
' , I \ I \
•
~,,.
...
,,
,
...
___
,,
I •N , __ ... - .... , I \ I \ ~
U1
1.
-~
~
, \\
I \'
_,if=&'),,
~
~~
I
"'°F~
~1~~
250
300
•
N I • ~'
• co I •,
•
0-
I\ I
\ I
\ I
\ I
\ I
\ I
\ I
\ I
"'-....
"
-
,
...
J (
TIHE IN HSEC)
Figure 2-6. Average, at each sampling time, of all 41 active channels in KW data, for each of the
experimental conditions.
41
i. e. , S( t )
=
:Ei= 1
v.(t)/ 41 where v.(t) is voltage in ith channel at time t.
1 1
typical evoked response is shown as dotted.
[image:50.770.11.749.36.529.2]46
-electrode recordings. The average correlation (by the Pearson
product-moment method} among all channels for all three
condi-tions is O. 573. The average correlation between active channels
and the phantom channels of Figure 2-6 is O. 526 and the average
correlation between the phantom channels is O. 732. At the 5%
significance level the critical level of the correlation coefficients
is approximately O. 304, hence all correlations are significant.
Moreover, there is a higher correlation between the three traces
(. 732) of Figure 2-6 than would seem apparent by eye.
These high correlations do not condemn the use of the
averaged reference electrode. One would in fact anticipate a
certain degree of significant correlation by virtue of the fact that
this average electrode is a linear combination of the active channels,
hence it must be related to them. The high correlation between
the three averaged electrodes is perhaps only a further indication
of something which can be seen in the data - - the responses to
the three different stimuli are very similar.
This process would only have an adverse effect on the
recordings if the averaged traces of Figure 2-6 were highly
oscillatory. This would mean that at one point all potential
readings would be elevated and then shortly thereafter all would
be depressed. This would of course alter the shape of the evoked
responses obtained. It would appear that this would not have been
47
-considerable portion, from about 50 ms to 130 ms (a very
significant interval, as will be seen) and again relatively flat
from about 130 ms to 170 ms (another interesting interval).
In any event, the magnitudes of the averaged reference
potentials for the most part lie within the standard errors of most
of the evoked responses. It may be that further investigation
will demonstrate how to more closely approach an average level
of zero or a small constant, but in the aggregate, this one test
of the scheme seems to support its continued use.
4. Data Reduction and Display Methods
The paper tape records produced by the laboratory in
San Francisco were removed to Caltech for all subsequent analysis.
Figure 2-7 shows an outline of the preliminary data re-formatting
done. Each of the three stimulus conditions reported here was
presented a total of three times for each subject, allowing
extrac-tion of a mean response for each condiextrac-tion. The data were then
smoothed to remove any maverick sample' errors. The final
tape containing the "raw" data contains the mean responses,
standard deviations, smoothed mean response and first time
derivative of the mean response for each channel for each
condi-tion. Details of this process can be found in the appendix.
It would be an understatement to say that the experimenter
[image:52.571.7.554.33.730.2]48
-DECODE PAPER
TAPE
INTERMEDIATE
Q
MAGNETIC TAPE
CALIBRATE AND EDIT
PUNCHED PAPER TAPE
Q
INTERMEDIATEMAGNETIC TAPE
SMOOTH AVERAGED RESPONSES
AVERAGE RESPONSES OVER
----t
REPLICATIONS ~--.OF SAME EXPERIMENT
FINAL
DATA TAPE
Q
TAKE TIME DERIVATIVE OF
AVERAGED RESPONSES
Figure 2-7. Outline of preliminary data reformatting from paper
tape records of each replication of each condition to
[image:53.567.16.549.23.737.2]49
-only as numbers on computer tape. Consider -only the response
to one condition: there are as many as fifty channels and 256
samples per channel, giving approximately 12, 500 data points to
confuse the observer.
It seems obvious that even plotting out each channel for
each condition for each subject still falls short of allowing some
reasonable visualization of the data, since that process would
yield in this case some 300 responses. Even if one could arrange
these plots on the walls of his room it is doubtful any real insight
coul~ yet be achieved. What is necessary is a visual
summariza-tion of the data which affords discovery of the salient similarities
or differences from experiment to experiment. This visual "aid11
can be very valuable in quickly examining the large amount of
data recorded.
Figure 2-8. shows a sequence of tracings of evoked responses
for ea.ch subject and each experimental condition. Only a small
number of the actual 40-odd channels are shown for illustrative
purposes. The only facts really apparent from these records are
that the respon~es to all three stimuli are quite similar, that
there appears to be a polarity reversal between the two subjects,
and that there is for each subject a polarity reversal from anterior
to posterior regions of the skull. The reader will probably concur
that this graphical technique is not adequate to show the complete
KW RIGHT
~- ~311
·-:=
~
~
.:~~.
-!~ ~ I
·-
:i-
~-
·--~ ~:.
,.~-:..
KW RIGHT
DAHL~
4.-;. - "\ ...! ;J7</ .! ~·c:;.g ...! ... !""'"
!
-..
"
;~;t
~[I
KW RIGHT
DAHL 6
KW RIGHT
DAHL '
KW RIGHT IJfNEL 2
'· ..: ~\..! . ..! /19 _! :-i} q· - -.:
;
r
~~~._
Figure 2-8 (a). Typical evoked responses for flash to right eye, subject KW. Traces shown are
mean of 3 replications of experiment and mean plus and minus one standard
deviation.
1.11
·-"
·
..,
I'
_JDALO RIGHT
•r
OftrKl 21)L
,
~
.
. · 7"'·
-'!~ ' ~i
....
~-- DRl.0 RIGHT
!- . , _ , 23
,;
:'
..
~- ' ~
-:?~~
....
•t--~
~-- !-
•r-DALO RIQiT
.,_,"
:i
~
~-~
.
.,_,~;
".::::/'~~
'-..::::,;,..
!-"
..
Figure 2-8 (d). Same as for (a) but subject is DALO, stimulus is flash
to right eye.
DRLO RIGHT
CtfMEL 111
ORO RIGHT
OIMEL 113
IJRLO RIGHT
o-AIEL 115
\J1
[image:58.768.15.758.18.530.2]DALO LEFT
!; CtfNIEL 21
....
• L'
.;~
~~~ ~
:~
·
~~
·~
"' -...
--'-~ ,
...
~-!,.. I •:-
·-...
DALO LEFT
~L23
!•::.
,,A~
I~::~~--
-+
r
...
·~
~~
DALO LEFT
~ .... ~L2S
·-·-
.;L / '/ / '.' .---. --~
·
.·
-
.
~
~
·
~~
.·> . £.:: .. -~"'
.:~',- ""'''"" . ;~
·
-·
-..
DALO LEFT
OfNllEL "I
DRLO LEFT
~Liil
~-r. ~~
-:t
~•r
.L
·
r
IDALO LEFT OffO£\. •S
·~
,;~ ~
·.~ v~y,~
.
~
~
...
ri-
·-Figure 2-8 { e). Same as for { d} but stimulus is flash to left eye.
01
[image:59.766.14.762.25.530.2]56
-The solution offered here largely springs from the original
motivation for the large electrode array in order to define a
poten-tial surface on the head. It seemed reasonable to show the data
in exactly that form, as equipotential lines sketched on an
anima-tion of the head. At each of the 256 sample times a picture was
made of the head. In order to compare the responses to different
conditions, the results for each are shown simultaneously as in
Figure 2-9.
In order to orient the viewer to the drawing, some artwork
has been added to the outline of the head. Ears and a neck have
been appended, and the elliptical shape is intended to be an
imaginary circle which circumscribes the vertex --- this to
determine the line of sight the viewer has. The contour lines which
of course actually lie on a three-dimensional surface, the head,
are shown in orthographic projection. This is not only easy to
implement in a computer algorithm but affo