Nanostructure and paramagnetic centres in diamond-like carbon: effect of Ar dilution in PECVD process
BJ Jones 1*, S Wright 2, RC Barklie 2, J Tyas 3, J Franks 4, AJ Reynolds 1
1. Experimental Techniques Centre, Brunel University, Uxbridge, UB8 3PH, UK
2. School of Physics, Trinity College, Dublin 2, Ireland
3. Diameter Ltd, Brunel University, Uxbridge, UB8 3PH, UK
4. School of Engineering and Design, Brunel University, Uxbridge, UB8 3PH, UK
Abstract
Diamond-like carbon (DLC) films were deposited utilising plasma enhanced chemical
vapour deposition (PECVD) with acetylene precursor, diluted with 0 – 45% argon.
Electron paramagnetic resonance (EPR) measurements show the presence of one
paramagnetic centre with no change in spin population over the range of film
deposition conditions. However, the EPR linewidth decreases with increasing argon
content of the precursor mix, suggesting an enhancement of motional narrowing due
to an increase in electron delocalization, related to an increase in the sp2 cluster size. Atomic force microscopy (AFM) measurements indicate the surface of the DLC is
formed of nanoscale asperities of material. With radii of tens of nanometres for films
deposited with zero argon, the size of the features increases with the argon dilution of
the acetylene. Energy dispersive x-ray analysis and electrical measurements further
elucidate the changes in film structure.
1. Introduction
Plasma enhanced chemical vapour deposition, PECVD, is one of the most highly used
laboratory methods for production of diamond-like carbon, DLC, and other
amorphous hydrogenated carbons, a-C:H. The process enables film deposition over a
large area, combined with easily adjusted deposition parameters to facilitate
The dilution of the PECVD precursor gases with argon [2, 3] is one of many
parameters, which also include bias voltage, process temperatures and post-deposition
annealing, that can be used to adjust the sp2 / sp3 ratio, hydrogen content,
microstructure and properties of amorphous hydrogenated carbon films. Early work
shows that clustering of the sp2 regions, which may be in the form of olefinic chains or aromatic rings, is a crucial factor in determining the optical and physical properties
of the amorphous carbon films [4, 5, 6].
Electron paramagnetic resonance (EPR) is a powerful tool to investigate the defects,
such as dangling bonds, in carbon films, interfaces and substrates. The technique
provides information on the spin-density, nature of defects and their interactions with
the lattice [7], and can be related to the film microstructure and electron delocalization
[8, 9]. A recent review [10] summarises previous work correlating the variation of
paramagnetic spin density, linewidth and relaxation times, with a-C(:H) deposition
conditions such as substrate temperature and bias voltage, as well as the relation to
other properties including the optical band gap. EPR has also been utilised to show
variation in electronic structure with the incorporation of additional elements, such as
N, B, or W into amorphous carbons, either during deposition or through
post-deposition ion implantation [9, 11, 12].
In addition to the electronic properties and chemical composition, the surface
structure of DLC is important in a wide range of applications, for example in coating
machine tools for use in dry, near-dry and oil-lubricated drilling [2, 13, 14]. In
biomedical applications, the topography, composition and electrical properties are all
of importance, in devices from sensors to hip joints, where DLC has been used as a
diffusion barrier and to inhibit adhesion of bacteria such as Staphylococcus
epidermidis [15].
In this article we investigate the variation of the argon content of the PECVD
precursor gases and the effect on film micro- and nano-structure, surface and EPR
2. Experimental
DLC films were deposited on high resitivity silicon by RF PECVD process in
Diameter Ltd. The precursor gas was a mixture of acetylene, argon and
tetramethylsilane (TMS). The ratio of argon to acetylene was adjusted by controlling
flow rate of these gases individually. Substrates of (100)Si, measuring approximately
10mm × 5mm, were ultrasonically cleaned with acetone for 15 min and mounted on
an electrode to which the negative bias voltage was applied. Prior to deposition, the
chamber was evacuated to a background pressure below 8×10⁻⁵ torr. Substrates were sputter-cleaned for 15 minutes in an argon plasma with flow rate of 30 sccm, pressure
of 8×10⁻² torr and a bias voltage of 300 V. This reduces impurities on the substrates, through energetic argon ion bombardment. Subsequently, the bias voltage was
adjusted to 450V and an interfacial layer was formed by adjusting argon flow rate to
that used for the film deposition and introducing TMS with flow rate of 25 sccm.
This layer enhances the adhesion of the film to the substrate. Once the interfacial
layer was formed, the TMS gas flowing into the system was cut off, and acetylene gas
at 60 sccm was introduced into the chamber. The argon flow rate and bias were
maintained for film deposition.
The DLC films were deposited from argon diluted acetylene gas, the flow rate of
argon was varied in different runs from 0 to 50 sccm with a constant rate of 60 sccm
for acetylene. The deposition time was kept the same for all runs, to produce films
approximately two micrometres in thickness; secondary ion mass spectrometry
(SIMS) measurements and previous work on this system [2] show that the increase in
argon concentration at this bias voltage may cause the film thickness to be decreased
by up to 10% from the thickness deposited with zero argon dilution of the precursor.
EPR measurements were made at room temperature on a Bruker EMX machine, using
100kHz field modulation, a microwave frequency of approximately 9.9GHz (X-band)
and a TM011 mode cavity. To avoid distorting the signal, measurements were
conducted at a non-saturating power and the modulation field kept well below one
Each g value was calculated by comparing the field position of the resonance with
that of a resonance of known g value, in this case F+ centres in MgO, with g=2.0023. The field range was calibrated with a proton NMR probe that also gave absolute field
values. Spin populations were found by comparing the integrated area of the signal
with that of a standard Varian sample of pitch in KCl; the absolute spin populations
and average spin densities are estimated to be correct to within a factor of two, but
their relative values are correct to within approximately 10%.
A Digital Instruments Dimension 3100 scanning probe microscope (SPM), operating
in tapping mode with Veeco silicon probe and cantilever resonant at approximately
260kHz, was used to examine the surface topography of the DLC coating.
Simple resistance measurements were conducted using a Fluke 1520 mega-ohm
meter; although this is a coarse evaluation method, with errors related to the probe
contact and film thickness (reflected in the tabulated uncertainties), this is
nevertheless a useful tool for initial appraisal.
Measurements of composition were conducted within a Zeiss Supra 35 VP field
emission scanning electron microscope (FE-SEM) equipped with an Oxford
Instruments Inca energy dispersive x-ray analyser (EDX). The SEM / EDX
quantified elemental concentration values will depend on the calibration, which is
complex for Ar; however, the relative values are correct to a greater level of certainty.
The electron accelerating voltage was decreased to bring the silicon EDX signal to
zero to ensure that the penetration depth and depth of analysis were less than or equal
to the film thickness. Thus the measurement of argon incorporation is only examining
the film, not the substrate (which may well contain incorporated argon due to the
cleaning process).
3. Results and Discussion
SEM EDX shows incorporation of Ar into the films varying from 0 to 0.44 at. %. The
depth is approximately 1.5 to 2 microns, and as the Si signal has been reduced to zero
by controlling the accelerating voltage, the analysis depth is entirely within the film
thickness – this also demonstrates negligible deviation from nominal thickness. The
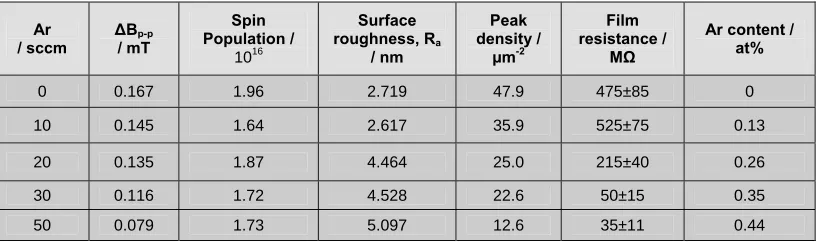
levels of argon incorporated into the DLC films are detailed in table 1. This also
shows the decrease in resistance of the films as argon dilution of precursor is
increased. Ar / sccm ∆Bp-p / mT Spin Population / 1016 Surface roughness, Ra / nm Peak density / µm-2 Film resistance / MΩ
Ar content / at%
0 0.167 1.96 2.719 47.9 475±85 0
10 0.145 1.64 2.617 35.9 525±75 0.13
20 0.135 1.87 4.464 25.0 215±40 0.26
30 0.116 1.72 4.528 22.6 50±15 0.35
[image:5.595.95.505.237.358.2]50 0.079 1.73 5.097 12.6 35±11 0.44
Table 1. Film structure, surface and properties as a function of argon content of precursor gas mix.
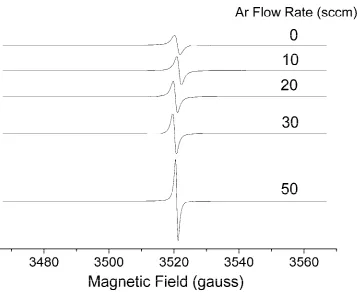
The electron paramagnetic resonance (EPR) spectra, as shown in figure 1, show a
single Lorentzian line at g = 2.0026. This is characteristic of defects in carbon, and
there is no contribution from the silicon substrate [8, 17, 18]. Earlier work has shown
this line does not contain unresolved multiple elements [7, 19], and the g value and
Lorentzian shape imply that the deposition process has not produced macroscopic
graphitic regions; if randomly orientated graphite microcrystals had formed, the
resonance line would be asymmetric and consist of a superposition of lines ranging in
g value from 2.0026 to 2.0495 [20], very different from the single Lorentzian line
observed.
This is in contrast to other ways of increasing the conductivity of DLC, for example
with high doses of implanted ions [21, 22]. Assuming nominal thickness and uniform
distribution of defects throughout the film [23] leads to a spin concentration of
Figure 1. EPR signal variation with increased argon dilution of precursor.
The observed EPR linewidth of the film deposited with zero argon is considerably
less than the linewidth of 1.6 mT that may be expected d ue to dipolar broadening
from this spin density [16]; the linewidth further decreases with increased argon
content of the precursor gas, as detailed in table 1, reaching 0.079 mT with 50 sccm of
argon in the precursor gas mix. This reduction in linewidth may be attributed to
motional or exchange narrowing, related to increased wavefunction overlap, due to
increased size of sp2 clusters. This is similar to the effect seen in DLC or polymer-like amorphous hydrogenated carbon, implanted with boron, nitrogen or carbon ions
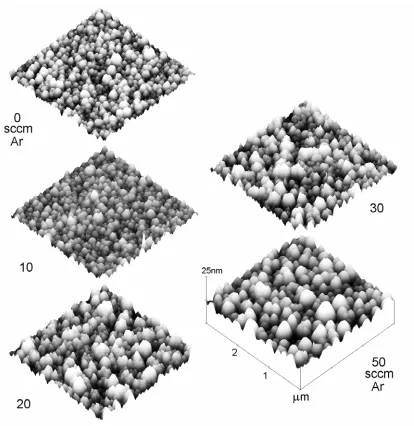
Figure 2. AFM images showing variation in surface topography with argon dilution of
precursor.
This hypothesis is consistent with the decrease in film resistance, and with the
analysis work of Valentini [3] who observed decreasing diamond-like properties in
DLC films produced with increased argon dilution of methane precursor. The
observed effects of varying argon content of precursor mix may be related to the
process of incorporation of argon into the film, or to the variation in preferential
deposition species as theorised by Riccardi [24] who showed preferential deposition
of C2 with increased Ar dilution of precursor gas, rather than hydrocarbons that are
the deposited film would be consistent with an increase in sp2 regions, as hydrogen acts to alleviate internal stresses inherent with sp3 structure in a-C:H films.
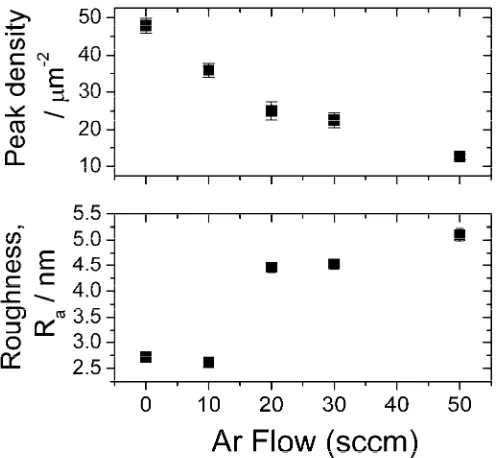
Figure 3. Variation in surface roughness and peak density with Ar dilution of precursor. The decrease in peak density indicates an increase in peak size.
The increase in argon concentration also results in changes to the physical structure of
the film, as shown in the atomic force microscopy (AFM) images in figure 2. The
film deposited with zero argon has a structure consisting of nanoscale asperities, with
features of approximate size a few tens of nanometres. As the argon concentration of
the precursor is increased, the average diameter of the features increases, indicated by
an approximately linear decrease in the density of peaks per unit area, from ~50 to
~12 peaks per square micron. The surface roughness, measured as Ra, the mean
z-direction deviation from the mean line, is also increased with increasing Ar; however,
this appears as almost a step change at 20 sccm Ar, with Ra increasing from 2.6 nm
for films deposited with zero and 10 sccm argon, to 4.5 – 5.0 nm for 20 – 50 sccm
argon, as shown in figure 3. The minimal change in Ra seen above 20 sccm Ar,
coupled with the continued decrease in peak density is consistent with the coalescence
that might be expected from variation of sp2 clustering of the films, this may explain the findings of Zolgharni [2] that there is a low optimum level of Ar in the PECVD
precursor mix to produce films with decreased friction for drilling applications.
4. Conclusions
The electronic and surface structure of amorphous carbon films can be controlled by
varying the argon content of the PECVD process precursor gas mix. DLC films
produced with increasing argon dilution of the precursor mix lead to some
incorporation of Ar into the DLC film, a narrowing of the EPR line, and an associated
decrease in film resistance. This is consistent with motional narrowing of the EPR
signal, resulting from increased wavefunction overlap, due to increased electron
delocalization, in turn caused by increased clustering of the sp2 structure. This is similar to that seen in observations of EPR linewidth in ion implanted a-C:H, [8, 9]
but does not lead to the associated increase in defect concentration observed in these
systems.
Simultaneously, the increased argon concentration in the precursor mix leads to an
increase in roughness of the surface and increase in diameter of topographical
features. This leads to a low optimum level of Ar in precursor mix for applications
dependent on low friction surfaces, as observed by Zolgharni et al. [2] in dry drilling
applications.
Acknowledgements
This work is part funded by Diameter Ltd and ETCbrunel, the Experimental
Techniques Centre at Brunel University. Grateful thanks to Dr N Montgomery at
References
[1] J. Robertson Mat. Sci. Eng: R 37 (2002) 129
[2] M. Zolgharni, B.J. Jones, R. Bulpett, A.W. Anson, J. Franks Diamond Relat.
Mater. doi:10.1016/j.diamond.2007.11.012
[3] L. Valentini, J.M. Kenny, G. Mariotto, P. Tosi, G. Carlotti, D. Fioretto, L.
Lozzi, S. Santucci, Diamond Relat. Mater. 10 (2001) 1088
[4] J. Robertson and E. P. O’Reilly, Phys. Rev. B 35 (1987) 2946
[5] J. Robertson, Adv. Phys. 35 (1986) 317
[6] D. Dasgupta, F. Demichelis and A. Tagliaferro, Philos. Mag. B 63 (1991)
1255
[7] B.J. Jones, R.C. Barklie, G. Smith, H. El Mkami, J.D. Carey and S.R.P. Silva
Diamond Relat. Mater. 12 (2003) 116
[8] B.J. Jones, R.C. Barklie, R.U.A. Khan, J.D. Carey and S.R.P. Silva Diamond
Relat. Mater. 10 (2001) 993
[9] R.U.A. Khan, J.D. Carey, S.R.P. Silva, B.J. Jones and R.C. Barklie Phys. Rev.
B 63 (2001) 121201(R)
[10] R.C. Barklie Diamond Relat. Mater. 12 (2003) 1427
[11] A. A. Konchits, M. Ya. Valakh, B. D. Shanina, S. P. Kolesnik, I. B. Yanchuk
J. D. Carey and S. R. P. Silva J. Appl. Phys 93 (2003) 5905
[12] M. Lacerda, M. Lejeune, B.J. Jones, R.C. Barklie, R. Bouzerar, K. Zellama,
N.M.J. Conway and C. Godet Journal of Non-Crystalline Solids 299-302
(2002) 907
[13] H. Yoshimura, Y. Toda, T. Moriwaki, T. Shibasaka and J. Okida Machining
Science and Technology, 10 (2006) 289
[14] M. Kalin, J. Vižintin, K. Vercammen, J. Barriga, A. Arnšek Surf. Coat.
Technol.200 (2006) 4515
[15] M. Katsikogianni, I. Spiliopoulou, D. P. Dowling, Y. F. Missirlis J Mater Sci:
Mater Med 17 (2006) 679
[16] R.C. Barklie, M. Collins, S.R.P. Silva Phys Rev B 61 (2000) 3546
[17] M. Collins, R.C. Barklie, J.V. Anguita, J.D. Carey, S.R.P. Silva Diamond
[18] B.J. Jones, R.C. Barklie J. Phys. D: Appl. Phys. 38 (2005) 1178
[19] M. Hoinkis, E.D. Tober, R.L. White, M.S. Crowder, Appl. Phys.Lett. 61
(1992) 2653
[20] G. Wagoner, Phys. Rev. 118 (1960) 647
[21] D. G. McCulloch, E. G. Gerstner, D. R. McKenzie, S. Prawer and R. Kalish,
Phys. Rev. B 52 (1995) 850
[22] S. Prawer, R. Kalish, M. E. Adel, and V. Richter, J. Appl. Phys. 61 (1987)
4492
[23] B.J. Jones PhD thesis, University of Dublin (2003)
[24] C. Riccardi, R. Barni, M. Fontanesi, P. Tosi Chem. Phys. Lett. 329 (2000) 66