Hussein, Hawre and Mishra, Rakesh
A LabVIEWbased PI controller for controlling CE 105 coupled Tank System
Original Citation
Hussein, Hawre and Mishra, Rakesh (2014) A LabVIEWbased PI controller for controlling CE 105
coupled Tank System. In: CONTROL 2014 10th International Conference of Control, 911 July
2014, Loughborough University.
This version is available at http://eprints.hud.ac.uk/id/eprint/21416/
The University Repository is a digital collection of the research output of the
University, available on Open Access. Copyright and Moral Rights for the items
on this site are retained by the individual author and/or other copyright owners.
Users may access full items free of charge; copies of full text items generally
can be reproduced, displayed or performed and given to third parties in any
format or medium for personal research or study, educational or notforprofit
purposes without prior permission or charge, provided:
•
The authors, title and full bibliographic details is credited in any copy;
•
A hyperlink and/or URL is included for the original metadata page; and
•
The content is not changed in any way.
For more information, including our policy and submission procedure, please
contact the Repository Team at: [email protected].
A LabVIEW-based PI controller for controlling CE
105 coupled Tank System
Hawre Hussein
University of Huddersfield
Huddersfield, Uk
[email protected]
Rakesh Mishra
University of Huddersfield
Huddersfield, Uk
[email protected]
Abstract— In this paper, use of Proportional-Integral (PI) controller to monitor and control liquid level in an interconnected CE 105 model coupled tank is investigated. To achieve a system which can instantaneously and accurately control the liquid level in a coupled tank, two different PI controllers have been tested. The LabVIEW library for the PI controller is used to measure liquid levels in the coupled tank. The PI SubVI already exists in the LabVIEW library that gives reasonable performance but to get a better system performance and monitor the liquid levels more accurately another SubVI is derived from the PI controller mathematical equations. The practical results and the system performance of the second SubVI show a faster response and more accurate instantaneous data which minimises the error in the measurements to ±1 mm. Furthermore, the robustness of the controller to change in the system’s parameters is also investigated and established.
Keywords—Coupled Tank System; Level Control; PI controller;
LabVIEW program.
I. INTRODUCTION
The work is based on designing the computer based digital control system to control liquid level in a coupled tank system. The other elements of the work include modelling and analysis of the control system using Proportional Integral (PI) controller in order to obtain the desirable performances as well as the acceptable response with the inlet and outlet valves.
The LabVIEW program is used to implement a control algorithm for controlling the liquid level with respect to inlet and output flow rate of the tanks. The control algorithm is used to send a specific voltage to the pump in the range of 0 to 10 volts by reading the rate of level drop caused by the rates of inlet and outlet flow via both inlet and outlet valves.
II. CE105COUPLED TANK SYSTEM
This plant is developed by the TQ Education and Training Ltd, 2001. The schematic diagram of the couple tank system is shown in fig.1. This system has two types of transducers which are liquid level sensors which work based on pressure measurement and the flow transducer. The specifications of the sensors are shown in TABLE 1 [1].
This apparatus has become a standard system among control system educators due to availability of most important features of level control. The features of simplicity and flexibility in
[image:2.595.308.569.260.424.2]design made CE105 coupled tank very convenient in different researches for all academic levels.
Fig. 1. Schematic Functional Detail of CE 105 [2]
TABLE I. The Specifications of CE105 Coupled Tank [2]
Tank A Cross Sectional Area = 9350 mm2
Tank B Cross Sectional Area = 9350 mm2
Valve A,B,C
10 mm Valve Orifice
Cross Sectional Area = 78.5 mm 2
Liquid Level Sensors
0 to 10 V DC Output Corresponding to 0 to 250 mm As indicated on the front panel water level scales
Pump Flow Sensors
0 to 10 VDC Output Corresponding to 0 to 4400 mm As indicated on the front panel flow meter
The apparatus consists of two separate vertical tanks connected by a flow valve (A) and both tanks (tank A and tank B) have drain valves (B and C) respectively. The flow characteristics of the coupled tank system can be controlled and changed to a wide range of physical characteristics by changing the cross sectional area of valve (A, B and C), which can be varied over five grades i.e. from 0 to 4.
[image:2.595.314.551.480.641.2]The inlet channel is connected with variable speed electrical pump which works with different voltages in the range from 0 to 10V. CE 105 coupled tank is considered as a Single Input Multi Output (SIMO) system where the inlet flow enters directly to tank A only as a single input to the system with separate drains for each tank (Valve B and C). The tank B in right hand side can be filled via tank A via valve (A). The figure also shows the variable DC motor control voltage plug for connecting power to the pump. The transducer signal conditioning circuit (flow and level) are also located in the top unit of the CE 105. Electrical connections between the individual transducers, the pump drive circuit and the top unit are made with the relevant plugs and sockets being correctly fitted at the time of installation. The level sensor gives output signals proportional to the water level in each tank. The tanks can be calibrated by comparing the level sensor measurements, by using MATLAB or LabVIEW software, with the actual liquid level by using the available scale on each tank. The Labjack U12, CIB, NI cDAQ 9178, NI 9253 and NI 9201 can be used as an interface between the Couple Tank System and the Matlab and LabVIEW software. [1][2][3].
III. COMPUTER INTERFACE BOARD (CIB)
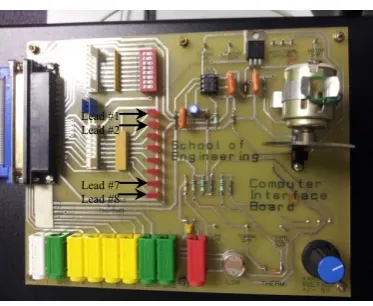
Computer interface board, as shown in fig. 2, is available in the laboratory of the technology building, University of Huddersfield. This board is used to interface between LabVIEW program and CE105 coupled tank and for many other purposes. The output port 1 (the white port) is used to send 0 to 10 voltages to the pump according to the PI controller output, and the input ports (4, 5 and 6) are used to return the feedback signals about the water levels of both the tanks and the flow rate of the pump. One of the available ground ports (Green ports) should connect with the ground port on the coupled tank system. LabVIEW program can distinguish all the signals easily and the designed program converts these signals to visible graphs and numeric data.
[image:3.595.330.542.354.541.2]The I/P motor working with a quarter of actual pump voltages and the leads (No 1,2,7 and 8) are connected to turn on the motor in the case of High level of tank 1, high level of tank 2, low level of tank 1 and low level of tank 2 respectively.
Fig. 2. Computer Interface Board
IV. LABVIEW
According to National Instrumentation, “LabVIEW is a graphical programming platform that helps engineers scale from design to test and from small to large systems”. It offers matchless integration with existing tradition software, IP, and hardware while capitalizing on the latest computing technologies. This program offers different tools to solve today’s problems. It integrates all the tools that engineers and scientists need to build a wide range of applications in dramatically less time and has the capacity for continual future innovations faster and more effectively. For these reasons, LabVIEW is considered as ideal software for any measurement or control system, and is at the heart of the NI design platform [2].
V. HARDWARE CONNECTION
As shown in fig. 3, the level sensors of Tank A and tank B are connected with yellow ports no.4 and no.5 respectively and the white port is connected with the pump port. Connecting both the ground ports of CIB and coupled tank is unnecessary because CIB is the power source and external power sources are not available.
Fig. 3. Hardware Connections
VI. FRONT PANEL DESIGN
Front Panel is considered as a control and feedback panel of the program. Through this panel, the input parameters can be updated, and the output of the system can be displayed graphically and numerically. The ingenuity in designing the front panel makes the design user friendly and enables the inexperienced user to use the system easily.
As shown in fig. 4, a picture of CE105 coupled tanks is inserted and rectangular and circular lids pasted on it. As shown, the system is running in Single Tank System (S.T.S) mode, in which the system behaves as single tank and the second tank is totally neglected.
Lead #1 Lead #2
[image:3.595.60.247.546.699.2]Fig. 4. Front Panel of the Program (C.T.S Mode)
[image:4.595.84.254.319.494.2]Fig. 5 shows the operation of the system in Coupled Tank System (C.T.S) mode. In this mode, the system takes the status of both tanks into consideration. The system operation in both modes (S.T.S) and (C.T.S) are explained in detail in the next sections.
Fig. 5. Front Panel of the Program (S.T.S Mode)
VII. BLOCK DIAGRAM DESIGN
The block diagram design includes interfacing the level sensors to have the status of water level in both the tanks, and interfacing the pump to send the proper voltage to run the system. In order to design a system that meets the requirements, a PI controller function is designed and used. All calculations and case structures are wired together in a while loop to have an integrated system with fast response and high accuracy [4][5][6].
VIII. INTERFACING THE LEVEL SENSOR
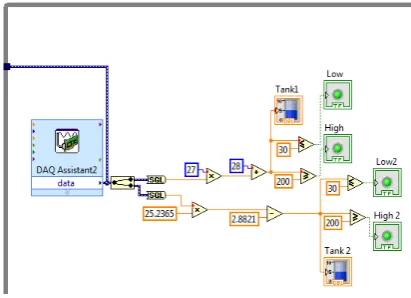
After connecting the hardware properly, the input DAQ has been set up. As shown in Fig. 6, the DAQ with bi-channel is used to cover the liquid level feedback for both tanks. The signal input range is fixed on (0 – 10) volts to match with operating voltage range of CE105 coupled tank system. The received feedback signal of Tank A and Tank B are connected with the calibration equations of each tank separately to convert the range of (0 – 10) volts to (0 – 250)
mm as actual height of each tank as shown in fig. 7. Level indicator leads are connected to alert the user in the case of High level and Low level of the liquid in the tanks separately.
Fig. 6. Input DAQ for Interfacing Level Sensors
Fig. 7. Diagram of Input DAQ and Calibration Procedure of Level Sensors
IX. INTERFACING THE WATER PUMP
Output DAQ is used to interface the water pump as shown in fig. 8. The voltage range is fixed on (0 – 10) volts which is the operational voltage range of the water pump.
The block diagram of fig. 9 shows two nested case structures to achieve running the system in both (S.T.S) and (C.T.S) modes and safety switch, called ‘pump’, is connected to shut down the pump for safety and in emergency cases. Another DAQ is set up for running the small motor on the CIB by quarter amount of operating voltage of the pump. The reason of connecting this motor is to indicate the user about the status of the pump (On/Off).
[image:4.595.307.513.358.507.2]Fig. 8. Output DAQ for Interfacing the Water Pump
Fig. 9. Diagram and Calculation of Output DAQ
X. BUILDING PICONTROLLER
PI controller can be used either by using PID function that available in program platter with zero D parameter or by designing new SubVI, pi(SubVI).vi, by using PI mathematical equations.
A. Using PID function in LabVIEW palettes with Zero D-parameter
As shown in fig. 10, PID function with zero D parameter is used. The coupled tank system connected with the program and controlled as previously explained.
B. Designing New Sub-VI (pi.vi)
Due to erratic behavior in pump operation, a new SubVI called pi(SubVI).vi was designed according to the mathematical equations of PI controller. As shown in Figure 13, the SubVI diagram connected with PI controller variables. All variables can be updated from the front panel even during running the program as shown in fig. 11.
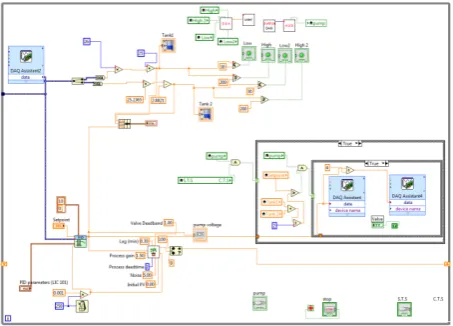
Fig. 12 shows the final block diagram of using the new PI controller that is explained in the previous section. This controller enables the pump to operate smoothly with different voltages (0 – 10) volts according to the PI controller calculations. The system response is very fast and the levels in both modes, S.T.S and C.T.S, are controlled accurately within the requirements.
Fig. 10. Using LabVIEW PID function with zero D parameter
[image:5.595.309.545.283.673.2]
Fig. 11. pi(SubVI).vi
Fig. 12. The Block Diagram by Using pi(SubVI).vi (
[image:5.595.335.531.286.465.2] [image:5.595.52.256.289.370.2]Fig. 13. PI Controller Variables and Result
XI. BUILDING WAVEFORM GRAPHS
To present the system response clearly, waveform graphs have been used that give the instantaneous charts for liquid levels in both the tanks and the required set point as shown in figure (4) and (5). The waveform function is wired with the feedback data, Tank1 and Tank2, and the set point that set by the user. This graph function enables the user to clear the chart at any time or to save the chart data in excel file for further calculation and analysis [4][5][7].
XII. DATA ANALYSIS
[image:6.595.332.533.99.190.2]The design is tested for both single and coupled tank modes by using two different methods (Method A and Method B) as illustrated previously. For each method (A and B), two samples of the waveform graphs are imported to image files in both cases of single tank and coupled tank modes. The data represents liquid level in millimetre and time in second. The systems are tested when the tanks are empty and different set points are applied.
[image:6.595.321.551.275.415.2]Fig. 14 and the data analysis in Table II show the response of the system in single tank system (STS) mode using Method A. The tank is controlled according to the set point with maximum overshoot of (≈ -2 mm). The erratic behavior in pump operation is noticed during testing the system.
Fig. 14. STS Real-time Plot (Method A)
TABLE II Performance Parameters for Figure 14
System Response Value
Average Rise Time ≈ 30 seconds
Average Settling Time ≈ 50 seconds Steady State Error ≈ 1 mm
Time constant ≈ 30 seconds Maximum Overshoot ≈ -2 mm
Fig. 15 and the data analysis in Table III show the response of the system in coupled tank system (CTS) mode using Method A. The tank is controlled according to the set point with maximum overshoot of (≈ 5 mm) which is not met with the requirement. Same as STS mode, the unsmooth of pump operation is commented during testing the system.
Fig. 15. CTS Real-time Plot (Method B)
TABLE III Performance Parameters for Figure 15
System Response Tank 1 Tank 2
Average Rise Time ≈ 44 seconds ≈ 55 seconds Settling Time ≈ 75 seconds ≈ 80 seconds
Steady State Error ≈ 0.5 mm ≈ 0.5 mm Time constant ≈ 30 seconds ≈ 45 seconds
Maximum Overshoot ≈ 5 mm ≈ 1 mm
Fig. 16 and the data analysis in TABLE IV show the response of the system in STS mode using Method B. The tank is controlled according to the set point with maximum overshoot of (≈ 1 mm). The erratic behavior in pump operation is completely disappeared during testing the system.
mSec
mm
H
eight
m
m
H
ei
gh
t
[image:6.595.330.542.461.553.2] [image:6.595.49.249.536.674.2]Fig. 16. Real-time Plot for 50mm Set Points (STS)
TABLE IV Performance Parameters for Figure 16
System Response Value
Average Rise Time ≈ 24 seconds Average Settling Time ≈ 40 seconds
Steady State Error ≈ 0.2 mm Time constant ≈ 28 seconds Maximum Overshoot ≈ 1 mm
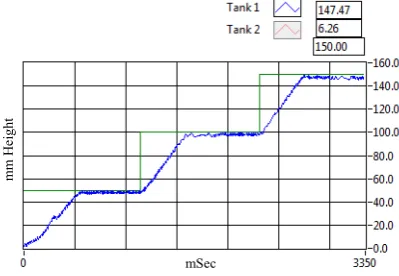
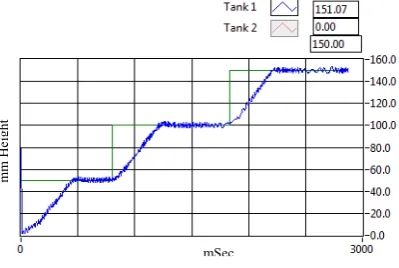
Fig. 17 and the data analysis in TABLE V show the response of the system in CTS mode using Method B. The tank is controlled according to the set point with maximum overshoot of (≈ 1 mm). Same as STS mode, the pump is operated during testing the system.
Fig. 17. Real-time Plot for 40mm Set Points (CTS)
TABLE. V Performance Parameters for Figure 17
System Response Tank 1 Tank 2
Average Rise Time ≈ 35 seconds ≈ 50 seconds Settling Time ≈ 55 seconds ≈ 80 seconds
Steady State Error ≈ 0.2 mm ≈ 0.3 mm
Time constant ≈ 37 seconds ≈ 50 seconds Maximum Overshoot ≈ 1 mm ≈ 1 mm
XIII. CONCLUSION
To conclude, liquid levels in CE105 coupled tank system have been successfully controlled by using PI controller and through LabVIEW program. The PI controller has been effectively used to control the liquid level in both single tank and coupled tank systems. The controller is provided a comprehensive and intelligent system by having feedbacks from both tanks through connecting both level control sensors. The ability of CIB for reading both sensors in the same time was the key point for getting higher accuracy results by eliminating the backflow effect of Tank B to Tank A and decreasing the effect of high inflow discharge of the pump on Tank B considerably.
In single STS mode, two methods are applied (Method A and Method B). In both cases, the system was able to respond quickly to tuning and changing the set point with reasonable overshoot and fluctuation around the set point line. Furthermore, the system is considered stable with low steady state errors regardless the erratic behavior in pump operation using Method A.
Method A was unsuccessful in controlling CTS. Maximum of 5mm of overshoot is recorded. The unsmooth operation of the pump is also the negative point of using Method A. By using new subVI in the Method B, the operation of the pump is controlled accurately and better results recorded in CTS mode as shown in Fig. 17.
Finally, the results show the low performance of the controller that used in the Method A in coupled tank system mode. Method B can considered as more effective than Method A as lower overshoots are recorded with higher performance in pump operation
References
[1] Technical teaching equipment for engineering. Coupled Tanks Apparatus. [online] 2014 [cited 2014 10th April]; Available at: http://www.tecquipment.com/Datasheets/ce105_0213.pdf
[2] National Instruments (2013). [online] Available at: www.ni.com [3] LabJack Corporation [online] Available at: http://labjack.com/ [Accessed
07 September 2013].
[4] Travis, J. 2002, LabVIEW for everyone, Prentice Hall PTR, Upper Saddle River, N.J.
[5] Essick, J. 2013, Hands-on introduction to LabVIEW for scientists and engineers, Oxford University Press, Oxford.
[6] Isen, F.W. 2009, DSP for MATLAB and LabVIEW, Morgan & Claypool, San Rafael, Calif.
[7] Bishop, R.H. 2007, LabVIEW 8 student edition, Pearson Prentice Hall, Upper Saddle River, NJ.
mm
H
eight
[image:7.595.58.257.263.352.2] [image:7.595.40.261.429.590.2] [image:7.595.68.271.635.702.2]![TABLE I. The Specifications of CE105 Coupled Tank [2]](https://thumb-us.123doks.com/thumbv2/123dok_us/324592.1033537/2.595.308.569.260.424/table-i-specifications-ce-coupled-tank.webp)