2017 2nd International Conference on Artificial Intelligence: Techniques and Applications (AITA 2017) ISBN: 978-1-60595-491-2
Analysis of TCM Data Based on Partial Least Squares within
Random Forest
Fang YU
1, Jian-qiang DU
1,*, Bin NIE
1, Zhu-lin HAO
2,
Qing-xia ZENG
1and Ri-yue YU
31School of Computer, Jiangxi University of Traditional Chinese Medicine, Nanchang, 330004, China
2
Shanghai Chongyu Intelligence Information Technology Company, Shanghai 200082, China 3
College of Pharmacy, Jiangxi University of Traditional Chinese Medicine, Nanchang, 330004, China
*Corresponding author
Keywords: Random forest, Partial least square, Nonlinear, TCM data.
Abstract. Partial Least Square (PLS) seems hard to adapt to the characteristics of the nonlinear data due to its own linear feature. However, Random Forest Algorithm(RFA), which is assembled by several classifiers, is adaptive and suitable to nonlinear data. Based on this, a new method fusing RF into PLS is proposed, which build Random Forest through the principal components and the dependent variable extracted from PLS, and use the residual information to build Random Forest recursively until accuracy conditions are met. Using the data of the maxingshigan decoction of the monarch drug to treat the asthma or cough and some datasets in the UCI Machine Learning Repository, the results show that the improved algorithm has a certain degree of correctness and validity.
Introduction
TCM [1] treating diseases, taking the dose-effect relationship of drugs as an example, chemical drug has clear and fixed structure. For that drug can only treat one diseases, the concepts, principles, methods and applications for dose-effect relationship has formed a relatively perfect system, such as Linear Regression (LR), Classification and Regression Tree(CART), Support Vector Machine(SVM), and Artificial Neural Network(ANN) [2].
However, Traditional Chinese medicine herbs present features of more compositions, more targets and more efficacies deciding that the Traditional Chinese medicine data present multiple variables, multiple dependent variables and nonlinear characteristics [3]. In paper [4], a feature extraction algorithm based on AutoEncoder is proposed, the results show it can get features well representative the image. Nevertheless, the algorithm requires large-scale training data, TCM data is usually small sample size owing to experimental factors, so it’s not appropriate to use the very method for TCM data. It results in linearly non-separable for high dimensional data in SVM[5] when the kernel function is inappropriate. As for Linear Regression(LR), although the model is simple and easy to explain, it is hard to express the nonlinear characteristic of TCM data.
Partial Least Squares(PLS) [6,7] can well explain the data with the characteristic of multi-independent variables and multiple dependent variables, but the principal components extract from PLS is linear combination of the independent variables’ column vector, apparently, the model is still linear relationship essentially when using such principal component and dependent variables for Multiply Linear Regression(MLR), therefore, PLS will not present good effects for raw TCM data directly.
modeling building and nearly non-overfitting and its own well ability to analyze and predict nonlinear data.
Based on this, a new method that fusing Random Forest into PLS has been introduced, through experimental analysis, the results seem to outperform than PLS and RF in the correctness and effectiveness of the algorithm.
Algorithm Introduction
Partial Least Squares
Partial Least Squares can not only do regression for data with multiply-independent variables and multi-dependent variables, but also can build model when even on small-scale data [10]. The main idea of Partial Least Squares is as followed:
Given the independent variables set X=( ,x x1 2,, ,xi,xp) and dependent variables
1 2 q
( , , , j, , )
Y= y y y y . t,u is the linear weight combination respectively, and the two need to meet the
conditions below.
1 They both two must carry the variation information to the maximum extent.
2 The correlation between the two is also as large as possible
1
tand 1
u is the first principal component extracted from X, Y. we uset1and
1
u for multiply linear regression, and judge the residual information satisfying the pre-defined conditions or not , if meets requirements , then terminate the calculating, otherwise, continue to extract the second principal componentt2,u2 from the residual information till satisfying result is obtained.
Random Forest Regression Algorithm (RFRA)
Random Forest regression [11] is adaptive and suitable for linear and nonlinear regression. It achieves excellent performance by an ensemble of multiple weak learning (simple regression tree). Each of the regression tree is built using a bootstrap sample of the data (the data not sampled is called OOB, as testing data), and in terms of attribute division, we randomly chooser_n
(r_n= p or int(1 l+ og2p),p is the number of the variables) attributes instead of selecting all of the original feature attributes to build a tree.
The main idea of how to build a Random Forest has been descripted briefly in paper [12].
Fusing Random Forest into Partial Least Squares Method
An Algorithm for Constructing Random Forest of Principal Components
A method of constructing Random Forest of Principal Components uses the PLS to extract principal componentst1, and utilize Bootstrap to resample randomly from raw data to generate several
sub-sample set d ii
(
=1, 2, 3…n_C)
(has the same size of t1). Then build a regression tree bydiand dependent variableY. Becausei
d is continuous, we adopt the sum of square error minimum criterion to find the best splitting point, according to which divided di into two subsets.
Under the aforementioned pattern, continue to recursively divide these two subsets until the number of leaf nodes is less than predetermined threshold or the error is reduced un-apparently.
The process of the method of constructing Random Forest of Principal Components(CRFPC) is as follows:
Step01 using Bootstrap to resample for _r mtimes from ti, to get the sample setdi, (Given we divide tiinto
K cells(R R1, 2,Rk),and each of the units there is a fixed output value asck)
Step02 building the basic CART ( ^
1
( ) ( )
K
k
i x c Ik k
e x
r R
RT e
=
=
∑
∈ ) by di and attributeListYStep03 looking for the splitting attributes
adopt the sum of the squared errors minimum criterion to search for the splitting attribute node of the subtree (including the current node) for the internal node in RTreei, then merge all of the
splitting attributes. The merged set is called regression attributes Step04 handling for the internal node
Choose the part of or all regression attributes of the sample data in the current node to execute regression operation, and traversal all the regression model further, we pick the model that owns the sum of the squared errors least as the regression model of current node
end
return
_
1
/ _
n C
i i
RTree RTess n C
=
=
∑
Fusing Random Forest into Partial Least Squares (RFR-PLS)
The main steps of RF-PLS are as follows:
Extract first principle component information from X, Y ast1,u1, then, we make theXandt1,Yand 1
u execute Random Forest regression, and judge the residual information further ,if the residual accuracy satisfy the meets, then terminate the process, else continue to extract principle component information from the residual information of regression result ofXandt1,Y andu1, the above
procedure continues until satisfactory accuracy is achieved. Finally, we extract themprincipal component
{
t1,,tm}
fromX, and utilize the method of Random Forest Embedded into Partial LeastSquares Regression to conduct regression ofykfort1,,tm,furthermore, we get the expression ofyk for raw independent variables{x1,...,xm}(wherek∈{1, 2,,q})
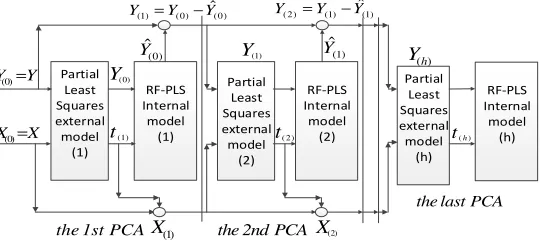
The Schematic diagram of RF-PLS is as shown in Figure 1. In the figure, Xdenotes the
independent variable data matrix, Y is the observation variable data matrix, t( )i (the value i begins with 1) denotes the main components of X,Xi,Yi(the value i between 0 and n)are the residual matrix of Xand Y respectively. Yˆ( )i is the predictive value (the value i begins with 0). The evaluation criteria, which adopts the residual sum of squares ( 2
RF
R ) of predictive value in OOB data, is as followed
(
)
21
1 n ˆ
OOB
OOB i i
MSE Y Y
n
=
∑
−2
2
1 ˆ
OOB RF
Y MSE R
σ
= −
i
Yis the real value of dependent variables in OOB, ˆOOB(( ))
i i
Y Y is the predictive value of OOB data
with RF method, ˆ2
Y
Partial Least Squares external model (1) RF-PLS Internal model (1) Partial Least Squares external model (2) Partial Least Squares external model (h) RF-PLS Internal model (2) RF-PLS Internal model (h) (0)
Y =Y
(0)
X =X
(0)
Y
(1)
t
(1)
X X(2)
(0) ˆ
Y
(1) (0) ˆ(0)
Y =Y −Y
(1) ˆ Y ( 2) t (1) Y
( )h
Y
( )h t
the 1st PCA the 2nd PCA
the last PCA
( 2) (1) ˆ(1)
[image:4.612.173.443.70.192.2]Y =Y −Y
Figure 1. Schematic diagram of the improved algorithm.
The main algorithm is below:
Algorithm 2. Fusing Random Forest into Partial Least Squares
Input: raw data set: Dataset(D); independent variables attributes list: attributeListX, dimension: p; dependent variables attributes list: attributeListY,dimension: q; total number of Learner: n_C; resample times: r_m; size of random input vector: r_n
Output: the predictive value R(X)
Step01 Extract the attributeListX, attributeListY as ( , )X Y from the original data, and normalize the ( , )X Y as(E F0, 0)
Step02 partial least squares regression(PLSR)
while judge the number i of the principal component satisfying the requirements or not
Based on the Lagrange principle to get weight coefficientwi, vi
Calculate the maximum eigenvector , corresponding to the maximum
eigenvalue of matrix ' ' 1 1 1 1 i i i i
F E− −E− F− and
' ' 1 1 1 1 i i i i
F E− −E−F−
Calculate the score vector and get the RF output values
i-1 , _ , _ , ( _ , ) a i
E =RF t n C r m r n E , Fb=RF , _(ti n C r, _m r, _n F, i−1)
Regression equationEi−1=Ea+EiandFi-1=Fi+Fa Get the residual information matrix and
1
i= +i
end
Step03
Integration the equation of RF-PLS
_ _
t _
1 1
/ _ , ,
ij
r n n C
m 1 2 r n
i j
F (t) RTess n C (t = (t ,t , t ))
= =
=
∑ ∑
Anti-standardized to the coefficient of the equation, and get the equation of theYand
X
Step04 end
The RF X n C r m r n Y( , _ , _ , _ , ) mentioned above is: Algorithm3: Random_ForestRF X n C r m r n Y( , _ , _ , _ , )
, _ , _ , _ ,
( )
RF X n C r m r n Y
for i=1 to n_C
using Bootstrap to resample from D for r_m times to get a sub-training set di
randomly select input vectors of size r_n without replacement in the independent attributes set of di, to
1
i=
i
w vi
1
i i i
t =E w−
i
Experimental Analysis
The experimental data is from the key laboratory of Modern Preparation of TCM, Ministry of Education in Jiangxi University of Traditional Chinese medicine, which supports us with the precious data of maxingshigan decoction of the monarch drug to treat the asthma or cough. It still choose another two sample sets in the UCI Machine Learning Repository, namely Slump and CCPP_Folds5x2_pp[14] to testify the improved algorithm.
The Explaining about the Experimental Data
The part of data about maxingshigan decoction of the monarch drug to treat the asthma(MXSGPC) showed in Table 1, has a total of 46 samples. it is about the impact of pharmacological indicators about the blood medicine composition in rats under 10 distinct dosage of herbal ephedra respectively. There are five compositions about the blood medicine composition in rats and two pharmacological indicators namely, incubation period (Unit: s) and cough duration (Unit: min). The first five compositions are the independent variable, the rest two is dependent variable.
[image:5.612.91.523.312.469.2]As for the data of maxingshigan decoction of the monarch drug to treat the cough(MXSGZK), it has the same independent variables with MXSGPC, the difference is that the dependent variable is only one target - cough duration. That’s why we didn’t show the data in this paper.
Table 1. The data of maxingshigan decoction of the monarch drug to treat the asthma.
ephedrine pseudoephedrine methyl ephedrine
wild black cherry glycosides
licorice glycosides
incubation period(s)
cough duration(min)
0.93 0.52 0.14 0.00 0.51 79 8
0.97 0.48 0.16 0.34 0.53 51 18
0.95 0.53 0.17 1.67 0.48 44 22
0.92 0.59 0.39 0.00 0.57 66 9
1.09 0.43 0.41 0.00 0.42 71 19
… … … …
The description of Slump and CCPP_Folds5x2_pp(CCPP) shows in
http://archive.ics.uci.edu/ml/.
Analysis of the Procedure and Result of the Experimental
In order to verify the effectiveness of the improved algorithm, we adopt several traditional methods to compare in four datasets showed in 3.1. In this paper, it randomly divided the raw data with the ratio of 7: 3, the 70% as the training dataset, the remained as the test sample.
For the data of the maxingshigan decoction of the monarch drug to treat the asthma (MXSGPC), there were 46 samples, 5 independent variables, 2 dependent variables, 32 training samples and 14 test sets. As for the data of maxingshigan decoction of the monarch drug to treat the cough(MXSGZK), there were 63 samples, 5 independent variables, 1 dependent variables, 44 training samples and 19 test sets.
For Slump, it has 103 samples, 7 independent variables, 3dependent variables, 72 training samples and 31 test sets. CCPP_Folds5x2_pp has a total of 9568 samples, 4 independent variables, 1dependent variables, 6698 training samples and2870 test sets.
0 0.5 1 1.5 2 2.5 SSETEST
PLS RFR-PLS RFR MT-PLS
MXSGPC MXSGZK CCPP_Folds5x2_pp Slump
0 0.2 0.4 0.6 0.8 1 1.2 SSETRAI N
PLS RFR-PLS RFR MT-PLS MXSGPC MXSGZK CCPP_Folds5x2_pp Slump
[image:6.612.124.488.67.180.2]The SSETrain in different Dataset The SSETest in different Dataset
Figure 2. The results of PLS, RFR and MPT-PLS, RFR-PLS.
We compared our improved algorithm (RFR-PLS) to the other three methods, which is the classic Partial Least Squares(PLS), Random Forest(RF) and the method of Fusing Model Tree into Partial Least Squares(MT-PLS). The results in the Figure 2 show: the improved algorithm has obvious applicability on the four datasets.
To make the data fluctuation clear, we centralizer the SSETrain and SSETest to the same level, Table 2. The different algorithm’SSTrain and SSTest under each data set.
MXSGPC
SSETrain SSETest
PLS 20580.6507 30434.7553
RFR-PL S
7265.4268 10855.0917
RFR 2184.2919 21114.3382
MT-PLS 7485.3271 14618.4831
MXSGZK
SSETrain SSETest
PLS 3841.8357 1761.1864
RFR-PLS 781.8543 1544.3966
RFR 3558.0025 1777.0677
MT-PLS 1568.5878 1653.9989
CCPP_Folds5x2_pp
SSETrain SSETest
PLS 161316.0535 70113.7642
RFR-PLS 141386.5010 58291.7624
RFR 145551.7916 64731.8109
MT-PLS 128136.5498 59418.3421
Slump
SSETrain SSETest
PLS 15994.1733 7729.8852
RFR-PLS 8785.6886 5553.6601
RFR 20649.4744 11250.2986
MT-PLS 8888.8669 9629.1733
From the table 2 and Figure 2, compared to PLS and RFR, the SSTrain and SSTest of the improved algorithm has different degree of decreasing. Briefly to say:
(1) For MXSGPC, it manifests a distinct non-linear characteristic, that’s why has good performance in RFR, MT-PLS, and RFR-PLS. However, compared to the improved algorithm(RFR-PLS), the generalization ability of RFR and MT-PLS seems poor.
(2) For MXSGZK, RFR-PLS seems to show a clear advantage with respect to the explainable and generalization of the model than the other three prediction models.
[image:6.612.78.536.300.491.2]The Algorithm’s Time Complexity
For the PLS, the time complexity is mainly in the process of principal component extraction. Since the eigenvalues and eigenvectors can be solved by the singular value matrix, only the covariance matrix exists in the time complexity, and the time complexity is 2
(n)
Ο . For the Random Forest, the time complexity is mainly reflected in the part of the tree built and the number of trees, given the number of trees is k, Random Forest’s time complexity is ( 2)
kn
Ο . For the improved algorithm, it is
assumed that the number of the principal components extracted is m, and one tree is built when extracting a principal component, so the time complexity of the improved algorithm is 2
(kmn )
Ο k m,
are the constant.
Conclusion
Focus on the unfitting of PLS for the nonlinear data, a new method fusing Random Forest into PLS is proposed, which can ensemble multi-learning machine and make full use of the random selecting of feature and sample, the new algorithm can well explain the nonlinear data and has a strong adaptive ability. For experiments on several TCM data and two regression data sets in the UCI Machine Learning Repository, the result show: the improved algorithm has better generalization accuracy and stronger classification prediction ability, and has a certain practical significance for the guidance of clinical medication. However, the number of the weak Learners directly decide the robustness of the model, what we do next is to find suitable learner’s number.
Acknowledgement
This work is supported by the Key Laboratory of modern preparation of Traditional Chinese Medicine (TCM), Ministry of Education and two National Natural Science Foundations (61363042 & 61562045). This research also is supported by a major project of Jiangxi Natural Science Foundation (20152ACB20007) and the Postgraduate innovation fund of Jiangxi University of Traditional Chinese Medicine(JZYC16S05). Jiangxi Province key research and development program key projects (20171ACE50021). Jiangxi Province undergraduate colleges and universities in the young teachers’ visiting fund.
References
[1] Zhang Boli, Wang Yongyan. Theory and Practice of Modern Traditional Chinese Medicine by Combining Components - Basic Research on Key Scientific Problems of Prescriptions[M]. Shenyang: Liaoning Science and Technology Press, 2010.
[2] Gao Yuming, Zhang Renjin. Analysis of House Price Prediction Based on Genetic Algorithm and BP Neural Network[J]. Computer Engineering, 2014, (04):187-191.
[3] Zhu Mingfeng, Du Jianqiang, Zhang Kang, Ding Chenghua. A Novel Approach for Automatic Tongue Deviation Analysis with Auto-correction. International Conference on Advanced Materials and Computer Science 2011, Chengdu. Key Engineering Materials, 2011, Vol.474-476, pp. 69-74. [4] Tang Chaohui, Zhu Qingxin, Hong Chaoqun, Zhu Feng. Multi-label Feature Selection with Autoencoders and Hypergraph Learning[J]. Acta Automatica Sinica, 2016, (07):1014-1021.
[5] Wang Dingcheng, Zhao Youzhi, et al. Journal of Computer Applications, 2017, 37(3):747-749. [6] Zhu EY, et al. Technology and Application of Chemometrics[M]. Beijing: science press, 2001, 100-107.
[8] Breiman L. Random forests[J]. Machine learning, 2001, 45(1): 5-32.
[9] Pal M. Random forest classifier for remote sensing classification[J]. International Journal of Remote Sensing, 2005, 26(1): 217-222.
[10] Wold S, Sjöström M, Eriksson L. PLS-regression: a basic tool of chemometrics[J]. Chemometrics & Intelligent Laboratory Systems, 2001, 58(2):109-130.
[11] Shreyas R, Akshata D M, Mahanand B S, et al. Predicting popularity of online articles using Random Forest regression[C]//International Conference on Cognitive Computing & Information Processing. IEEE, 2017.
[12] Li Hang. Statistical learning method[M]. Beijing: Tsinghua University Press, 2012. [13] UCI Machine Learning Repository[Z],[ 2009-04-30].
http://archive.ics.uci.edu/ml/datasets/Concrete+Slump+Test [14] UCI Machine Learning Repository[Z],[2014-03-26].