Combustion and Performance Characteristics of CI Engine
Running with Biodiesel
B. Tesfa1, R. Mishra, C. Zhang, F. Gu, A.D.Ball
Computing and Engineering, University of Huddersfield, Queensgate, Huddersfield, HD1 3DH, UK
Abstract
Biodiesel is one of the alternative fuels which is renewable and environmentally friendly and can be used in diesel engines with little or no modifications. In the present study, experimental investigations were carried out on the effects of biodiesel types, biodiesel fraction and physical properties on the combustion and performance characteristics of a compression ignition (CI) engine. The experimental work was conducted on a four-cylinder, four -stroke, direct injection (DI) and turbocharged diesel engine by using biodiesel of waste oil, rapeseed oil and corn oil and normal diesel. Based on the measured parameters, detailed analyses were carried out on cylinder pressure, heat release rate and brake specific fuel consumption (BSFC). It has been seen that the biodiesel types do not result in any significant differences in peak cylinder pressure and BSFC. The results also clearly indicate that the engine running with biodiesel have slightly higher in-cylinder pressure and heat release rate than the engine running with normal diesel. The BSFC for the engine running with neat biodiesel was higher than the engine running with normal diesel by up to 15%. It is also noticed that the physical properties of the biodiesel affects significantly the performance of the engine.
Key words: Physical properties of biodiesel, Brake specific fuel consumption, In-cylinder pressure, Heat release rate
1.
Introduction
The invention of CI engines and subsequent developments in engine technology has led to extensive exploitation of the petroleum reserves [1],[2] which are being depleted at a rapid rate [3],[4]. Currently, biofuels are being investigated in detail for application in CI engine with exciting potential opportunities to increase energy security and reduce gas emissions [5], [6]. This could have significant effects on economic development and poverty reduction programmes throughout the world [7]. The main findings from the literature reviewed indicate that biodiesels, when used in engines, have comparable power, BSFC and brake thermal efficiency, as compared to engines running with diesel. Biodiesel also offers significant advantages of significant portability and although there is not at overwhelming agreement many studies have reported higher combustion efficiency with the Bio-diesel use [8], [9], [10]. Furthermore bio-Bio-diesel offers lower sulphur and aromatic content, a higher cetane number and higher lubrication effects [11]. Moreover, it has unique advantage of being available around the world [5],[12]. Currently, the biodiesel production processes have also been improved to increase the bio-diesel yield to have continuous supply from process plants [13], [14]. The performance of an IC engine is represented by a number of different parameters. Some of the important parameters includes: brake specific fuel consumption, brake effective power, thermal efficiency, in-cylinder pressure and heat release rate. Many researchers have investigated the performance characteristics of engines running with biodiesel and its blends and compared it against its performance when running with normal diesel[15], [16], [17], [18], [19]. In the following sections some important works have been reviewed to identify gaps in the knowledge in combustion and performance characteristics of the CI engine running with biodiesel blends to justify the present work.
1 Corresponding author: Belachew Tesfa, b.c.tesfa@hud.ac.uk/belachewmu@yahoo.com ,
1.1
Combustion characteristics
Combustion of fuels is one of the most important processes which affect the performance and emission characteristics as well as the engine durability [20]. The important parameters that signify the combustion process effectiveness are in-cylinder pressure, ignition delay, combustion duration, heat release and cumulative heat release rate [21], [22]. In-cylinder pressure can be measured directly from the engine and the other combustion parameters can be calculated from the in-cylinder pressure. The heat release rate is estimated from the first law of thermodynamics as given in equation (1) and (2) using the in-cylinder pressure and the geometry of crank and rod. The other important combustion parameters can be easily estimated from the heat release rate (HRR) variation over an engine cycle.
= .
+
(1)
=
+
[ + 1 − −
− /] (2)
Where, dQ/dθ is rate of heat release (kJ/deg), P is the in-cylinder gas pressure (kPa), V is the in-cylinder volume (m3),
γ is the ratio of specific heats, Vd is the engine displacement (m3), θ is crank angle (deg) and R is the ratio of connecting rod length (m) to crank radius (m).
Furthermore, the cumulative heat release (Qcum) is calculated by the equation (3):
!"= # $ = # & $ + $& (3)
Most of the researchers have reported that the engines running with biodiesel blends result in an hydraulic advancement in injection timing and the start of combustion as the biodiesel content in the blends increases[12],[23],[21], [24–27]. Gao et.al [25] investigated the spray penetration, spray cone angle and spray tip speed characteristics using a high-speed camera for different biodiesel blends. The experimental result showed that as the ratio of biodiesel in the blends increased, the spray penetration and spray speed increased. They however observed that the spray cone angle decreased. They also reported that the Sauter mean diameter of blended fuels was observed to be greater than that of diesel under similar operating conditions. Furthermore, Zhang and Van Gerpen investigated the effects of blends of methyl esters of soya bean oil and diesel in a turbo-charged, four-cylinder and direct injection diesel engine. They found that these blends gave a shorter ignition delay and similar combustion characteristics [28]. Yusuf and Milford [28] studied the in-cylinder pressure and heat release rate characteristics of a six-cylinder, direct injection 306kW diesel engine with blends of esters of methyl as a fuel. The peak rate of heat release, peak cylinder pressure, indicated mean effective pressure (IMEP) and charge of temperature for this blend were found to be lower than that of diesel. The combustion characteristics of a single cylinder, four stroke which is running with waste cooking biodiesel were investigated by Muralidharan et al [29]. They found that the combustion characteristics of waste cooking oil methyl ester and its diesel blends closely followed those of standard diesel.
1.2
Brake specific fuel consumption
BSFC is the ratio of the engine fuel consumption to the engine power output, as measured at the flywheel. Lapuerta et al.[30] and Xue et al.[19]carried out an extensive review of publications on the
BSFC of engines using biodiesel and its blends. It is shown in Table 1 that from total reviewed papers on the engine running with biodiesel, 98% and 87.1% of them agreed that the engine running with biodiesel resulted in higher BSFC as per Lapuerta et al. [30] and Xue et al. [19] reports respectively. Chauhan et al [31] carried out extensive tests on a Kirloskar make, single cylinder, air cooled, direct injection, DAF 8 model diesel engine, to quantify performance and emission characteristics when running with Jatropha biodiesel, under steady state operating conditions. The brake thermal efficiency of Jatropha methyl ester and its blends with diesel were lower than diesel and brake specific energy consumption was found to be higher.
Dorado et al. [32] used transesterfied waste olive oil on a 3-cylinder, 4-stroke, water-cooled and direct
injection diesel engine. Their results revealed a slight increase in BSFC. Monyem and Gerpen [33] also tested several fuels including neat biodiesel, 20% blend, and a base diesel fuel on a John Deere 4276T turbo-charged DI diesel engine at a single speed of 1400 rpm, with 100% and 20% loads. The biodiesels used were both oxidised and un-oxidised. They reported that the oxidised and un-oxidised neat biodiesels resulted in 15.1% and 13.8% higher BSFC than the diesel fuel, respectively.
[image:3.595.68.527.505.613.2]Ramadhas et al. [34] tested rubber seed oil on a four-stroke direct injection, naturally aspirated single cylinder diesel engine at a speed of 1500 rpm under various loads. They reported that when the applied load increased, the BSFC decreased until the engine attained a 60–70 % load condition. In the same analysis, it was seen that as the percentage of biodiesel increased the BSFC of the engine also increased. Lin C and Lin H [35] reported that the BSFC of fuels decreased with increasing speeds of the engine under a constant engine torque. It can be concluded from the reviewed literature that engines running with biodiesel result in a higher BSFC than when running with diesel, as the former has lower heating value and hence higher amount of fuel is consumed in order to maintain the same brake power [32], [36]. These studies indicate that the fuel consumption is, on average, proportional to the loss of heating values, irrespective of whether heavy-duty or light-duty engines were tested. For example, Hasimoglu et al. [37] obtained 13% higher BSFC with a biodiesel having LHV 13.8% lower as compared to diesel on a 4-cylinder, TU and DI diesel engine.
Table 1 Estimated share of literature (in percentage of publications) on effect of pure biodiesel on engine performance and emission in comparison with Diesel [30],[19].
Parameters Increasing trend number of papers
(%)
Similar trend number of papers
(%)
Decreasing trend
number of papers (%)
Lapuerta et al
Xue
etal.
Lapuerta et al
Xue et al.
Lapuerta et al
Xue et al.
Power performance 0 7.4 2 22.2 96 70.4
BSFC 98 87.1 2 3.2 0 9.7
Thermal efficiency 8 NR 80 NR 4 NR
NR: not reported
Armas et al. [38] found that the BSFC of B100 biodiesel, with a low heating value, 12.9% lower than that of diesel, had increased approximately by 12%, compared to the diesel on a 2.5L, DI and TU, common-rail diesel engine operating at 2400rpm and 64Nm. Furthermore, Lin et al. [39] investigated the BSFC of eight different types of biodiesel on a single-cylinder, 4-stroke, DI diesel engine and found the diesel engine had a higher BSFC within the range of 9.45–14.65% than that of diesel which had (12.9–16%) higher value of LHV as compared to the biodiesels.
44] decrease in fuel consumption when biodiesel and its blends were used as a fuel, in comparison to diesel. For instance, Ulusoy et al. [41] observed that the fuel consumption of frying oil biodiesel was 2.43% less than that of diesel on a 4-cylinder, 4-stroke 46kW diesel engine under similar operating conditions. Other than the effects of heating value on BSFC, some researchers have also reported that the BSFC of biodiesel could be affected by the biodiesel content [45–48] biodiesel physical properties [36], engine type and operating conditions [47] and additives [49], [50]. In addition, some researchers have reported that the BSFC may increase due to changes in combustion timing caused by biodiesel’s higher cetane number, as well as the injection timing [33].
As the aforementioned review highlights, the studies in combustion characteristics and performance of CI engine running on biodiesel blends are fairly inconsistent. More investigations are required in order to understand the phenomena of combustion and performance characteristics of engines running with biodiesel blends for range variation of biodiesel types, blend ratio and physical properties. Based on the review, in this paper three research problem areas were identified:
The effects of biodiesel types on the CI engine combustion and performance characteristics. The effects of biodiesel blends on the CI engine combustion and performance characteristics. The effects of the biodiesel physical properties (density, viscosity and lower heating value) on
the performance of the CI engine.
Therefore, the objective of this study is to investigate the combustion and performance characteristics of CI engine running with biodiesel blend by varying biodiesel types, blends and physical properties. To achieve the objective, experimental investigations were carried out using cylinder, four-stroke, turbo-charged, water-cooled and direct-injection CI engine. In the following sections the experimental facilities and test procedures have been explained.
2.
Experimental Facilities and Test Procedures
[image:4.595.158.478.496.748.2]In this study the combustion characteristics and performance of a CI engine running with biodiesel was investigated using a four-cylinder, four-stroke, turbo-charged, water-cooled and direct-injection CI engine. The details of the engine are presented in Table 2. The engine was loaded by a 200kW AC Dynamometer 4-Quadrant regenerative drive with motoring and absorbing capability for both steady and transient conditions. The picture of the engine test and layout of the experimental facilities is described in Figure 1 and Figure 2.
Table 2 Characteristics of engine
Technical parameters Technical data
Engine type Turbo charged diesel engine
Number of cylinders 4
Bore 103mm
Stroke 132mm
Compression ratio 18.3:1
Number of valves 16
Injection system Direct injection
Displacement 4.399 litre
Cooling system Water
Nominal Idling speed 800 rpm
Maximum rating gross intermittent 74.2 @ 2200rpm
In order to acquire accurate and repeatable engine test data for diesel engine combustion and performance characteristics, the engine test bed was instrumented with speed sensors, pressure transducers, fuel flow metres and in-line torque meter. A Hengler RS58 speed sensor was used to measure the speed of the engine. Fuel flow was measured by a FMS-1000 gravimetric fuel measuring system which was controlled and monitored by CADETV12 software. The cylinder pressure was measured using a Kistler 6125A11 piezo-quartz pressure sensor which was mounted in cylinder one. The output of pressure sensor was amplified through a B & K 2635 charge amplifier. The crankshaft position was obtained using a crank angle sensor to determine the cylinder pressure as a function of the crank angle. The measuring range and accuracy of these instruments are presented in Table 3. Table 3 Measuring instruments specifications
Instruments Type Range Accuracy
Fuel flow meter FMS-1000 gravimetric 0 - 300Kg/hr ±0.05% of reading
Speed sensor Hengstler RS58 0 - 10000rpm -
In-cylinder pressure Kistler 6125A11 piezo-quartz
0 - 25MPa ≤ 0.4 % FSO
Load cell T10FS 0 - 1000Nm 0.006 to 0.002% of reading
Figure 1 Experimental engine facilities
All the signals collected from the test rig needed to be converted from an original analogue form into a digital form. This was achieved by using a CED Power 1401 Analogue to Digital Converter (ADC) interface between the transducers and a host computer. The power CED 1401 is able to record waveform data at 16-bit and 400kHz for 16 channels. It can also generate waveform and digital output simultaneously for real-time, multi-tasking experimental system using its own processor, clocks and memory, under the control of the host computer. The fuel from biodiesel tank was pumped to a fuel meter and, then it passes through a fuel pump to fuel injectors. The normal diesel was pumped from the main reservoir.
Air intake
Dynamometer
Biodiesel tank
4-Cylinder engine Fuel meter
Cooling system
100
75
50
25
L
oa
d,
[image:6.595.50.522.82.305.2]%
Figure 2 Engine test facilities lay out
During the testing process the engine was run for 10 minutes to enable it to come to steady state before any measurements were carried out. On the day prior to the actual test day and also when fuel was changed, a preconditioning procedure at high speed and high load was implemented to purge any of the remaining effects from previous tests in the engine fuel system and also to remove the deposited hydrocarbon on the sample line. The maximum rated speed and maximum torque of the test engine is 2200rpm and 425Nm respectively. The test operation speed and torque which have been shown in Figure 3 are based on the rated engine speed and maximum load.
In this study, three common types of commercially available biodiesels (corn oil biodiesel (COB), rapeseed oil biodiesel (ROB), and waste oil biodiesel (WOB)), obtained from a local company, had been used for analysis. The corn oil biodiesel and rapeseed oil biodiesel were produced by the transesterfication process from ‘virgin’ oil using methanol. The waste oil biodiesel was produced by the same process, although the raw feed was from cooking oil waste. Normal diesel fuel was obtained from a local fuel supplier. The red diesel, which is exactly the same as regular diesel by its combustion, performance and emission behaviour, was used in all tests. It is produced by adding colour additives on normal diesel. The red diesel was selected due to its low fuel tax for off-road engines.
Figure 3 Range of engine speeds and engine loads for steady state testing cycle 25 50 75 100
Engine speed (%)
Dynamometer
ADC host PC
Control host PC
Diesel tank
Turbocharger Exhaust gas
4 cylinder engine
Load cell
Pressure sensor Fuel pump
E
nc
od
er
Biodiesel tank
Fuel flow meter
Fresh air
CED 1401 ADC
Charge Amplifier
Control unit
Temp. & pressure sensors
[image:6.595.67.453.544.739.2]To establish quantitative dependence of fuel type on combustion and performance of engines four different fuels namely ROB, COB, WOB and diesel were used. However, to establish blending and physical properties effects, the blended fuels were prepared by mixing ROB and diesel in different proportions using in tank blending method [37]. Blended fuel has percentage volumetric fraction of 0%, 10%, 20%, 50%, 75% and 100% of Biodiesel and named B0, B10, B20, B50, B75 and B100 respectively.
[image:7.595.75.542.204.356.2]The main physical properties such as composition, density, lower heating value (LHV) and viscosity of the rapeseed oil biodiesel were measured according to the official test standards in EU and the results were published by this paper authors [51]. The blends properties are presented in Table 4. Table 4 Physical and Chemical properties of rapeseed biodiesel and its blends [51]
Property Accuracy Diesel(B0) B10 B20 B50 B75 B100
C 87 86 85 82 79.5 77
Composition (%) H 13 12.9 12.8 12.5 12.25 12
O 0 1.1 2.2 5.5 8.25 11
Density (kg/m3) ±0.05kg/m3 853.36 859.00 865.00 871.76 872.50 879.30 LHV (MJ/kg) ±0.01MJ/kg 42.67 42.26 41.84 40.58 39.54 38.50 Viscosity (mm2/s) ±0.02mm2/s 3.55 3.91 4.28 4.68 4.74 5.13
3.
Results and Discussion
As per the review in section 1, a number of researches have been carried out on the use of biodiesel in CI engines during steady state conditions. However, there is limited information available on effects of physical properties of biodiesel on both combustion and performance characteristics. Based on the experimental results, the effects of blend fraction, density, viscosity and lower heating value on combustion and performance characteristics of CI engine are analysed and reported in this section.
3.1
Effects of biodiesel types and blends fraction on combustion
characteristics
The overall scope of biodiesel sources for biodiesel production becomes much broader over time. The most common biodiesel sources are edible oil such as rapeseed oil, corn oil, palm oil, and soybean oil [52]. In this study, two categories of biodiesel were investigated: biodiesel from ‘virgin’ vegetable (rapeseed oil (ROB) and corn oil biodiesel (COB) oil, and waste cooked oil (waste oil biodiesel (WOB)). The combustion characteristics parameters such as in-cylinder pressure, the heat release rate and cumulative heat release behaviour of the three biodiesels and their blends are presented here. The in-cylinder pressure measurement is considered to be a very valuable source of information during the development and calibration stages of the engine. The in-cylinder pressure signal can provide vital information such as peak pressure, P-V diagram, indicated mean effective pressure, fuel supply effective pressure, heat release rate, combustion duration, ignition delay and so on [53], [54]. Moreover, based on ideal gas and first law of thermodynamics it can be used in more complex calculations for example in air mass flow estimation, combustion diagnosis and NOx prediction [53], [55].
The peak in-cylinder pressure of a CI engine running on diesel, ROB, COB and WOB, at a load of 420Nm and over a wide range of engine speeds, is shown in Figure 4(a). It can be seen that the in-cylinder pressure increased slightly with increasing engine speed. This is due to an increase in air/fuel ratio with engine speed increment [21],[24].
show any significant difference in peak in–cylinder pressure values. However, the engine running on WOB showed an inconsistent variation of in-cylinder pressure across the range of engine speeds. This is thought to be due to the variations of fatty acids methyl esters in WOB which have non-uniform combustion characteristics at various engine operating conditions [56].
Figure 4 Variation of peak in-cylinder pressure with engine speed for CI engine running with ROB, COB, WOB and diesel at load of 420Nm
Figure 5 presents the peak in-cylinder pressure of the CI engine fuelled with the biodiesel blends at 420Nm over a wide range of engine speeds. It can be seen that the peak in-cylinder pressure increases consistently with increasing engine speeds. The peak in-cylinder pressure also increases with increasing biodiesel fraction. The neat biodiesel resulted in a maximum in-cylinder pressure (2.7% more than diesel). The main reason for a higher peak in-cylinder pressure in the CI engine running with biodiesel is due to the advanced combustion process being initiated by the easy flow-ability of biodiesel and its other relevant physical properties of biodiesel as claimed by Qi et al.[3].
1000 1200 1400 1600 1800
5 10 15
Speed(rpm)
P
e
a
k
P
re
s
s
u
re
(M
p
a
)
(a) 420Nm
Diesel ROB COB WOB
1000 1200 1400 1600 1800
0 1 2 3 4
Speed(rpm)
P
re
s
s
u
re
i
n
c
re
m
e
n
t(
%
)
(b) 420Nm
Figure 5 Variation of peak pressure with speed of CI engine running with biodiesel blends at load of 420Nm
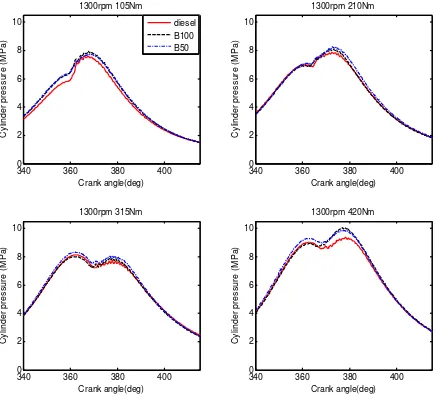
Figure 6 shows the variation of in-cylinder pressure within the combustion chamber of the test CI engine with crank angle when running with B50, B100 and normal diesel fuels at a speed of 1300 rpm and at different engine loads of 105Nm, 210Nm, 315Nm and 420Nm. To highlight the combustion process only, the figure shows only the part of combustion or power stroke section in the engine cycles. Figure 6 depicts that the peak cylinder pressures obtained for the engine running with B50 and B100 are higher than the engine running with diesel by 4.5% and 3.4% at 420Nm respectively. For the rest of the load conditions, the difference is found to be below 3%. The higher in-cylinder pressure of CI engine running with biodiesel blends may be attributed to the advanced combustion process initiated by the physical properties such as higher cetane number, viscosity, density and bulk modulus. The same phenomena were reported by Qi et al.[3] and Muralidharan et al [29]. However, in recent publication Jaiichander et al. [56] reported that the peak pressure is slightly lower for B20 when compared to that of diesel and they explained this might be due to improper mixing of B20 with air due to higher viscosity and lower calorific value for B20.
The cumulative effects of these properties result in a short ignition delay and advanced injection timing for biodiesel. Furthermore, due to the presence of oxygen molecules in the biodiesel, the hydrocarbons achieve complete combustion [57] resulting in a higher in-cylinder pressure. Gumus [21] however reported that the engine running with diesel resulted in higher in-cylinder pressure than that of biodiesel blends due to high viscosity and low volatility of the biodiesel which leads to poor atomization during the ignition delay period. Qi et al. [3] have argued that the higher viscosity and lower volatility can be compensated by the complex and rapid pre-flame chemical reactions at higher temperatures which result in cracking and creation of lighter biodiesel compounds. These compounds can result in earlier ignition.
900 1100 1300 1500
5 6 7 8 9 10
Speed(rpm)
P
e
a
k
P
re
s
s
u
re
(M
p
a
)
(a) 420Nm Diesel
B10 B20 B50 B100
900 1100 1300 1500
0 5 10 15 20 25 30 35
Speed(rpm)
P
re
s
s
u
re
i
n
c
re
m
e
n
t(
%
)
(b) 420Nm B10
Figure 6 Variation of in-cylinder pressure with crank angel for CI engine running with B50, B100 and diesel at 1300rpm and different loads
To obtain more in-depth information the variation in the rate of pressure rise with crank angle for diesel and biodiesel blends at differnet engine loads are shown in Figure 7. It can be seen that at a lower engine load the rate of pressure rise for diesel is slightly higher than that of the biodiesel fuel. The reason for this observation may be because at lower load, a very small quantity of fuel is injected into the combustion chamber and combustion starts after TDC. However, the rate of pressure rise is higher for biodiesel at higher engine loads. This is due to the higher rate of heat release during premixed combustion phase as explained in the next section.
Heat release rate is one of the most important parameters to characterise the combustion process in compression ignition engine. Using the heat release rate diagram, it is possible to determine the ignition delay time, start of ignition and the peak heat release. The heat release can be computed by using first law of thermodynamics and ideal gas laws as described in section 1.
Figure 8 depicts the heat release rates for different biodiesel blends and normal diesel at a speed of 1300 rpm and at different load values of 105Nm, 210Nm, 315Nm and 420Nm. The engine running with diesel and biodiesel blends slight variation of the peak heat release rate and ignition delay. It can also be observed from the Figure 8 that the ignition of the biodiesel fuel starts earlier than the diesel fuel by 0.8deg, 1deg, 1.5deg and 1.2deg for 105Nm, 210Nm, 315Nm and 420Nm load conditions respectively. Gumus [10] also reported that the start of ignition for biodiesel was advanced by up to 1.65deg. The advanced start of ignition is occurred due to
340 360 380 400
0 2 4 6 8 10 Crank angle(deg) C y lin d e r p re s s u re ( M P a ) 1300rpm 105Nm
340 360 380 400
0 2 4 6 8 10 Crank angle(deg) C y lin d e r p re s s u re ( M P a ) 1300rpm 210Nm
340 360 380 400
0 2 4 6 8 10 Crank angle(deg) C y lin d e r p re s s u re ( M P a ) 1300rpm 315Nm
340 360 380 400
the physical properties of the biodiesel such as higher bulk modulus [14], [46] higher viscosity [41], [45] and higher cetane number [47],[16]. It is well documented from previous reports that biodiesel cetane number is higher than diesel which mainly causes for start of early ignition for engine running with biodiesel [33],[58–60]. Further it can be seen that at lower load conditions the test CI engine running on diesel has a higher peak heat release rate than the biodiesel by 4%. At higher load conditions the engine running on biodiesel blends have slight higher heat release rates than that running on diesel. This phenomenon is attributed to the presence of additional oxygen molecules in biodiesel fuel [47–49] which results in the air-mixed fuel in the cylinder burning completely and increasing the heat release rate.
Figure 7 Variation of rate of in-cylinder pressure rising r with B50, B100 and diesel at speed of 1300rpm and different loads
The cumulative heat values obtained from the experiments on engine running with diesel, B50 and B100 are shown in Figure 9. It can be seen that B50 resulted in higher cumulative heat release, as compared to the diesel, by 4%, 3%, 2.5% and 3.5% for different load values of 105Nm, 210Nm, 315Nm and 420Nm respectively. This is due to the dual effects of the complete combustion because of presence of the oxygen molecules in biodiesel and the higher heating value of 50% diesel as compared to B100 [7]. Because of the vaporization of the fuel accumulated during ignition delay, at the beginning the curve a negative cumulative heat release is observed after combustion is initiated, the heat release values become positive.
340 360 380 400 420
-0.2 0 0.2 0.4 Crank angle(deg) R a te o f p re s s u re r is e (M P a /d e g
) 105Nm, 1300rpm
340 360 380 400 420
-0.2 0 0.2 0.4 Crank angle(deg) R a te o f p re s s u re r is e (M P a /d e g
) 210Nm, 1300rpm
340 360 380 400 420
-0.2 0 0.2 0.4 Crank angle(deg) R a te o f p re s s u re r is e (M P a /d e g
) 315Nm, 1300rpm
340 360 380 400 420
-0.2 0 0.2 0.4 Crank angle(deg) R a te o f p re s s u re r is e (M P a /d e g
) 420Nm, 1300rpm
Figure 8 Variation of heat release rate with crank angle for CI engine running with B50, B100 and diesel at engine speed of 1300rpm and range of engine loads
350 355 360 365 370 375 380 385 390 395 400
0 5 10 15 Crank angle(deg) H e a t re le a s e r a te ( k J /d e g ) (a)1300rpm 105Nm
350 355 360 365 370 375 380 385 390 395 400
0 5 10 15 Crank angle(deg) H e a t re le a s e r a te ( k J /d e g ) (b)1300rpm 210Nm Diesel B100 B50
Ignition delay change =1.0deg Ignition delay change =0.8deg
350 355 360 365 370 375 380 385 390 395 400
0 5 10 15 Crank angle(deg) H e a t re le a s e r a te ( k J /d e g ) (c)1300rpm 315Nm
350 355 360 365 370 375 380 385 390 395 400
0 5 10 15 Crank angle(deg) H e a t re le a s e r a te ( k J /d e g ) (d)1300rpm 420Nm
Ignition delay change=1.5deg
Figure 9 Variation of cumulative heat release rate with crank angle of CI engine running with B50, B100 and diesel at engine speed of 1300rpm and range of engine loads.
350 360 370 380 390 400 410 420 430 440
-200 -100 0 100 Crank angle(deg) C u m u la tiv e h e a t re le a s e ( k J
) (b)1300rpm 210Nm
350 360 370 380 390 400 410 420 430 440
-200 -100 0 100 Crank angle(deg) C u m u la tiv e h e a t re le a s e ( k J
) (a)1300rpm 105Nm
Diesel B100 B50
350 360 370 380 390 400 410 420 430
-50 0 50 100 150 200 250 Crank angle(deg) C u m u la tiv e h e a t re le a s e ( k J
) (c)1300rpm 315Nm
350 360 370 380 390 400 410 420 430
0 100 200 300 400 Crank angle(deg) C u m u la tiv e h e a t re le a s e ( k J
3.2
Effects of biodiesel types on the BSFC
[image:14.595.74.503.204.562.2]To investigate the effects of biodiesel source types on BSFC, experimental investigations were conducted by using ROB, WOB, COB and normal diesel for range of engine speed and at loads of 105Nm and 420Nm. Figure 10 shows the variation in the brake specific fuel consumption (BSFC) of the engine running on ROB, WOB, COB and normal diesel against engine speeds at two different loads of 105Nm and 420Nm. The BSFC has been estimated from the brake power output of the engine and the mass flow rate of the fuel. At both load conditions, the BSFC has been seen to be higher at lower engine speeds. It then decreases with engine speed to a minimum value, eventually increasing again with engine speed.
Figure 10 Variation of brake specific fuel consumption (BSFC) with engine speed of CI engine running with ROB, COB, WOB and diesel at load of 105Nm and 420Nm.
This may be explained on the basis that, at low speeds, heat loss from the combustion chambers walls is proportionately greater and combustion efficiency is poorer, resulting in higher fuel consumption for the power produced. At higher speeds, the friction power increases at a rapid rate, resulting in a slower increase in power than in fuel consumption with a consequent increase in BSFC [47]. Pal et al. [30] and Hazar [40] also reported similar trends for BSFC and engine speed dependence. At a lower load (105Nm), the engine achieved its minimum BSFC between 1000-1200rpm. However, at the maximum load (420Nm), the engine reached its minimum BSFC between 1200-1400 rpm for all fuel types.
Figure 10 also depicts the comparison of the engine’s BSFC when fuelled with biodiesels and normal diesel. It can be seen that the BSFC of the biodiesel was higher than the diesel by up to 15% at lower engine load and up to 7% at the higher engine load. Lapuerta et al. [17] have also reported that, the BSFC of the engine running with neat biodiesel was higher than that of engine running with diesel by up to 18%. The increment of BSFC of the biodiesel compared to diesel is mainly due to the low
1000 1200 1400 1600 1800 2000 200 220 240 260 280 300 speed(rpm) B S F C (g /k W h )) (a) 105Nm Min BSFC
900 1100 1300 1500 1700 1900 0 5 10 15 20 B S F C c h a n g e ( % ) speed(rpm) (b) 105Nm
1000 1200 1400 1600
200 220 240 260 280 300 speed(rpm) B S F C (g /k W h )) (c)420Nm Min BSFC Diesel ROB WOB COB
900 1100 1300 1500
heating value of the biodiesel as claimed by previous authors [20], [21], [23], [25] discovered by the author in this study. Some authors have also explained the increase in the BSFC in relation to the higher density and viscosity of the biodiesel [28], [29], [31]. In the lower heating value analysis, the heating value of the biodiesel was lower than the diesel by 11.1%. The BSFC of the engine running on ROB, COB and WOB did not show any significant differences in BSFC values. The maximum difference in BSFC values corresponding to ROB, COB and WOB was limited to 1.25% for an engine speed of 1900rpm and load of 105Nm.
As it is mentioned in section 2, the three biodiesels were produced by the same transestrification process. However, the biodiesel source was varied by source location (soil type and climate variation). The biodiesel production processes, however, were controlled and identical. As per this particular study, the three biodiesels have almost similar density, viscosity and heating values [38] with differences limited to 5%. It can be concluded from this study that the biodiesel type does not have significant impact on the BSFC of the engine.
3.3
Effects of biodiesel blend fraction on BSFC
Currently, biodiesel is used as a fuel in different proportions (as neat biodiesel (B100) and different blends). In this study, diesel, 10B, 20B, B50 and B100 blends have been used for analysis. Considering the wide application of ROB biodiesel in European countries, detailed investigation has been carried out on the performance and emission characteristics of the test CI engine running with various ROB blends. The in-cylinder pressure, brake specific fuel consumption and thermal efficiency of the CI engine have been evaluated when running with different biodiesel blends at various operating conditions.
Figure 11 shows the BSFC obtained for different biodiesel blends over a range of engine speeds and at two engine loads of 105Nm and 420Nm. It can be clearly seen that at lower engine speeds, the BSFC is higher which then decreases to a minimum point, and increases again with the engine speeds (see Figure 11(a)). The reasons were explained in section 3.2 (Figure 10).
Figure 11(b) depicts that when the biodiesel blend percentages increase, the BSFC values also increase. The BSFC of the engine fuelled with 10B, 20B, B50 and B100 blends increased by 2.5%, 5%, 10% and 15% respectively, at a load of 105Nm as compared to BSFC when fuelled with Diesel only. However, at a higher load (420Nm), the difference between the BSFC of biodiesel blends and diesel is narrowed, as depicted in Figure 11(c-d), which shows a maximum BSFC increment of 5%. The same phenomena were reported by Lin et al [61] for B5, B10, B20 and B30. Contrary to this trend, Muralidharan et al [29] were reported that biodiesel blends resulted in inconsistent trends.
Figure 11(a,c) Variation of BSFC with engine speed for different biodiesel blends at 105Nm and 420Nm (b,d) Variation of BSFC increment with engine speed for biodiesel blends at load of 105 and 420Nm
900 1000 1100 1200 1300 1400 1500 1600 1700 1800 1900 220
240 260 280 300 320 340
speed(rpm)
B
S
F
C
(g
/K
w
h
))
(a) 105Nm
Diesel B10 B20 B50 B100
900 1100 1300 1500 1700 1900
0 5 10 15 20 25
B
S
F
C
in
c
re
m
e
n
t
(%
)
speed(rpm) (b) 105Nm
B10 B20 B50 B100
900 1000 1100 1200 1300 1400 1500 1600
200 220 240 260 280 300
speed(rpm)
B
S
F
C
(g
/k
W
h
))
(c)420Nm
900 1100 1300 1500 1600
0 5 10 15
B
S
F
C
c
h
a
n
g
e
(
%
)
[image:16.595.121.471.78.657.2]Figure 12 (a) Variation of BSFC with biodiesel fraction at engine speed of 1500rpm and various engine loads (b) Variation of BSFC percentage increment with biodiesel fraction at engine speed of 1500rpm and at various engine loads
It is also seen that the BSFC of the engine at a low load (105Nm) increased linearly with increase in the biodiesel fraction values. In general, it can be seen that at lower loads, the BSFC of the CI engine is higher and then decreases before increasing again very slowly. Similar trends in BSFC were reported by Gumus and Kasifoglu [40] and [62] for all blends investigated (B10, B20, B50, B100 and diesel) at different load conditions. One of the explanations for a decreasing BSFC with an increase in load is because of a higher increase in brake power, as compared to fuel consumption [19].
3.4
Effects of physical properties of biodiesel on BSFC
The physical properties of a fuel such as density, viscosity and lower heating value affect the engine performance and emission characteristics. The uncertainties of the physical properties measurements presented in Table 4 have not shown in the figures. The effects of the fuel density on the BSFC of the CI engine running at 900 rpm and 1500rpm are presented in Figure 13. For easy comparison, tests have been conducted at same load and speed conditions.
It was noticed, that increasing the fuel density increased the BSFC at all the load conditions investigated. This can be due to the fuel meter delivering fuel on a volumetric basis and the density being higher for biodiesel than for diesel resulting in fuel injection pump discharging more biodiesel mass as compared to that of diesel mass [24], [63]. This causes higher fuel consumption for almost the same power output. It is also seen that at load conditions of 105Nm and 210Nm, the engine running at 1500rpm resulted in a higher BSFC by approximately 5% and 3%, than at a speed of 900rpm respectively. At higher engine loads i.e. 315Nm and 420Nm, the engine running at a speed of 1500 rpm resulted in a lower BSFC by approximately 3% and 6%, than the engine running at a speed of 900 rpm.
0 10 20 50 100
200 220 240 260 280 300
Biodiesel fraction(%)
B
S
F
C
(g
/k
W
h
))
(a) BSFC at 1500rpm
105Nm 210Nm 315Nm 420Nm
0 10 20 50 100
0 5 10 15 20
Biodiesel fraction(%)
B
S
F
C
c
h
a
n
g
e
(%
)
(b) BSFC increment at 1500rpm
[image:17.595.99.498.88.420.2]Figure 13 Variation of BSFC with density of biodiesel at engine speed of 900rpm and 1500rpm and various engine loads
Figure 14 presents the effects of the kinematic viscosity of the fuels on the BSFC in the test CI engine at operating speeds of 900 rpm and 1500 rpm and at various engine loads. It can be seen that when the kinematic viscosity of fuel increases the BSFC also increases. The effects of viscosity on the BSFC of the test engine can be explained on the basis that as the fuel viscosity increases, the fuel injection atomisation is affected and this leads to poor combustion and lower power for the same volume of fuel [64]. Some authors argue that the higher viscosity of biodiesel enhances the fuel spray penetration and improves air-fuel mixing [19].
The effect of lower heating values of the fuels used on CI engines’ BSFC at various engine loads and at speeds 900 rpm and 1500 rpm are shown in Figure 15. It can be seen that at all operating conditions, as the lower heating value increases the BSFC decreases. Biodiesel’s heating value is lower than diesel by about 11.09% as presented in Table 4. The BSFC of biodiesel is found to be higher than diesel by 15% and 7% at lower load and higher load conditions, respectively.
850 860 870 880
220 240 260 280
ρ(kg/m3)
B
S
F
C
(g
/k
W
h
))
(a) 105Nm
900rpm 1500rpm
850 860 870 880
220 240 260 280
ρ(kg/m3)
B
S
F
C
(g
/k
W
h
))
(b) 210Nm
850 860 870 880
220 240 260 280
ρ(kg/m3)
B
S
F
C
(g
/k
W
h
))
(c) 315Nm
850 860 870 880
220 240 260 280
ρ(kg/m3)
B
S
F
C
(g
/k
W
h
))
Figure 14 Variation of BSFC with viscosity of biodiesel at engine speed of 900rpm and 1500rpm and various engine loads
Figure 15 Variation of BSFC with density of biodiesel at engine speed of 900rpm and 1500rpm and various engine loads
3.5 4 4.5 5 5.5
220 240 260 280
µ(mm2/s)
B S F C (g /k W h )) (a) 105Nm 900rpm 1500rpm
3.5 4 4.5 5 5.5
220 240 260 280
µ(mm2/s)
B S F C (g /k W h )) (b) 210Nm
3.5 4 4.5 5 5.5
220 240 260 280
µ(mm2/s)
B S F C (g /k W h )) (c) 315Nm
3.5 4 4.5 5 5.5
220 240 260 280
µ(mm2/s)
B S F C (g /k W h )) (d) 420Nm
38.27 40.08 41.36 42.2 42.5 220 240 260 280 LHV(MJ/kg) B S F C (g /k W h )) (a) 105Nm 900rpm 1500rpm
38.27 40.08 41.36 42.2 42.5 220 240 260 280 LHV(MJ/kg) B S F C (g /k W h )) (b) 210Nm
38.27 40.08 41.36 42.2 42.5 220 240 260 280 LHV(MJ/kg) B S F C (g /k W h )) (c) 315Nm
[image:19.595.121.471.431.730.2]4.
Conclusions
The effects of biodiesel types, blend fraction values and physical properties on the CI engine’s in-cylinder pressure, heat release rate and brake specific fuel consumption were investigated in detail for steady state operation conditions. The following summary are drawn:
In this study for the fuels used and engine configurations the biodiesel types do not result in any significant differences in the engine CI engine’s in-cylinder pressure, heat release rate and brake specific fuel consumption.
The peak cylinder pressure of the engine running with biodiesel blends is slightly higher than the engine running with diesel. The main reason for a higher in-cylinder pressure in the CI engine running with biodiesel could be due to the advanced combustion process being initiated by the higher lubrication effect of biodiesel and its other relevant physical properties such as viscosity, density and bulk modulus.
The engine running with diesel and biodiesel blends show the same combustion stages at all load conditions except for the slight variation in peak heat release rate and ignition delay. When using biodiesel, the ignition is seen to be advanced when compared to diesel fuel by crank angles of 0.8o, 1o, 1.5o and 1.2o for load values of 105Nm, 210Nm, 315Nm and 420Nm respectively.
It was noticed that when the density and viscosity of biodiesel is increased an increase in BSFC of CI engine is observed at all load conditions investigated.
The use of biodiesel has been seen to increase the brake specific fuel consumption up to 15% of the CI engine due to its low heating value, higher density and viscosity. However, this trend is seen to weaken as the proportion of biodiesel reduces in the blend.
References
[1] D. C. Rakopoulos, C. D. Rakopoulos, E. G. Giakoumis, and A. M. Dimaratos, “Characteristics of performance and emissions in high-speed direct injection diesel engine fueled with diethyl
ether/diesel fuel blends,” Energy, vol. 43, no. 1, pp. 214–224, Jul. 2012.
[2] P. Tan, Z. Hu, D. Lou, and Z. Li, “Exhaust emissions from a light-duty diesel engine with Jatropha biodiesel fuel,” Energy, vol. 39, no. 1, pp. 356–362, Mar. 2012.
[3] D. H. Qi, L. M. Geng, H. Chen, Y. Z. Bian, J. Liu, and X. C. Ren, “Combustion and performance evaluation of a diesel engine fueled with biodiesel produced from soybean crude oil,” Renewable Energy, vol. 34, no. 12, pp. 2706–2713, Dec. 2009.
[4] D. B. Hulwan and S. V. Joshi, “Performance, emission and combustion characteristic of a multicylinder DI diesel engine running on diesel–ethanol–biodiesel blends of high ethanol content,” Applied Energy, vol. 88, no. 12, pp. 5042–5055, Dec. 2011.
[5] C. Carraretto, A. Macor, A. Mirandola, A. Stoppato, and S. Tonon, “Biodiesel as alternative fuel: Experimental analysis and energetic evaluations,” Energy, vol. 29, no. 12–15, pp. 2195–2211,
Oct. 2004.
[6] B. Tesfa, R. Mishra, F. Gu, and O. Gilkes, “Emission Behavior of a CI Engine Running by Biodiesel under Transient Conditions,” SAE International, Warrendale, PA, 2010-01-1280, Apr. 2010.
[7] L. M. V. Serrano, R. M. O. Câmara, V. J. R. Carreira, and M. C. Gameiro da Silva,
“Performance study about biodiesel impact on buses engines using dynamometer tests and fleet consumption data,” Energy Conversion and Management, vol. 60, no. 0, pp. 2–9, Aug. 2012.
[8] K. Sivaramakrishnan and P. Ravikumar, “Determination of higher heating value of biodiesels,”
International Journal of Engineering Science and Technology (IJEST), vol. 3, no. 11, pp. 7981–
87, Nov. 2011.
[9] A. Demirbas, Biodiesel: A Realistic Fuel Alternative for Diesel Engines. Springer, 2008.
[10] S. Saravanan, G. Nagarajan, G. Lakshmi Narayana Rao, and S. Sampath, “Combustion
characteristics of a stationary diesel engine fuelled with a blend of crude rice bran oil methyl ester and diesel,” Energy, vol. 35, no. 1, pp. 94–100, Jan. 2010.
[12] A. Macor and P. Pavanello, “Performance and emissions of biodiesel in a boiler for residential heating,” Energy, vol. 34, no. 12, pp. 2025–2032, Dec. 2009.
[13] J. F. Puna, J. F. Gomes, M. J. N. Correia, A. P. Soares Dias, and J. C. Bordado, “Advances on the development of novel heterogeneous catalysts for transesterification of triglycerides in biodiesel,” Fuel, vol. 89, no. 11, pp. 3602–3606, Nov. 2010.
[14] J. F. P. Gomes, J. F. B. Puna, L. M. Gonçalves, and J. C. M. Bordado, “Study on the use of MgAl hydrotalcites as solid heterogeneous catalysts for biodiesel production,” Energy, vol. 36, no. 12, pp. 6770–6778, Dec. 2011.
[15] T. K. Gogoi and D. C. Baruah, “A cycle simulation model for predicting the performance of a diesel engine fuelled by diesel and biodiesel blends,” Energy, vol. 35, no. 3, pp. 1317–1323, Mar. 2010.
[16] B. S. Chauhan, N. Kumar, and H. M. Cho, “A study on the performance and emission of a diesel engine fueled with Jatropha biodiesel oil and its blends,” Energy, vol. 37, no. 1, pp. 616–622, Jan. 2012.
[17] L. A. H. Nogueira, “Does biodiesel make sense?,” Energy, vol. 36, no. 6, pp. 3659–3666, Jun. 2011.
[18] M. Lapuerta, O. Armas, and J. Rodríguez-Fernández, “Effect of biodiesel fuels on diesel engine emissions,” Progress in Energy and Combustion Science, vol. 34, no. 2, pp. 198–223, Apr. 2008. [19] J. Xue, T. E. Grift, and A. C. Hansen, “Effect of biodiesel on engine performances and
emissions,” Renewable and Sustainable Energy Reviews, vol. 15, no. 2, pp. 1098–1116, Feb. 2011.
[20] B. Tesfa, R. Mishra, F. Gu, and A. Ball, “Combustion characteristics of CI engine running with biodiesel blends.” presented at the European Association for the Development of Renewable Energies, Environment and Power Quality, Canaria, Spain, 2011.
[21] M. Gumus, “A comprehensive experimental investigation of combustion and heat release
characteristics of a biodiesel (hazelnut kernel oil methyl ester) fueled direct injection compression ignition engine,” Fuel, vol. 89, no. 10, pp. 2802–2814, Oct. 2010.
[22] P. Benjumea, J. Agudelo, and A. Agudelo, “Effect of altitude and palm oil biodiesel fuelling on the performance and combustion characteristics of a HSDI diesel engine,” Fuel, vol. 88, no. 4, pp.
725–731, Apr. 2009.
[23] Y. Haik, M. Y. E. Selim, and T. Abdulrehman, “Combustion of algae oil methyl ester in an indirect injection diesel engine,” Energy, vol. 36, no. 3, pp. 1827–1835, Mar. 2011.
[24] K. Yamane, A. Ueta, and Y. Shimamoto, “Influence of Physical and Chemical Properties of Biodiesel Fuels on Injection, Combustin and Exhaust Emission Characteristics in a Direct Injection Compression Ignition Engine,” International Journal of Engine Research, vol. 2, no. 4,
pp. 249–261, Aug. 2001.
[25] Y. Gao, J. Deng, C. Li, F. Dang, Z. Liao, Z. Wu, and L. Li, “Experimental study of the spray characteristics of biodiesel based on inedible oil,” Biotechnol. Adv., vol. 27, no. 5, pp. 616–624,
Oct. 2009.
[26] B. Kegl and A. Hribernik, “Experimental Analysis of Injection Characteristics Using Biodiesel Fuel,” Energy Fuels, vol. 20, no. 5, pp. 2239–2248, 2006.
[27] J. P. Szybist, J. Song, M. Alam, and A. L. Boehman, “Biodiesel combustion, emissions and emission control,” Fuel Processing Technology, vol. 88, no. 7, pp. 679–691, Jul. 2007. [28] Y. Ali and M. A. Hanna, “In-Cylinder Pressure Characteristics of a D.I. Heavy Duty Diesel
Engine on Biodiesel Fuel,” SAE International, Warrendale, PA, 971683, May 1997.
[29] K. Muralidharan, D. Vasudevan, and K. N. Sheeba, “Performance, emission and combustion characteristics of biodiesel fuelled variable compression ratio engine,” Energy, vol. 36, no. 8, pp. 5385–5393, Aug. 2011.
[30] M. Lapuerta, O. Armas, and J. Rodríguez-Fernández, “Effect of biodiesel fuels on diesel engine emissions,” Progress in Energy and Combustion Science, vol. 34, no. 2, pp. 198–223, Apr. 2008. [31] B. S. Chauhan, N. Kumar, and H. M. Cho, “A study on the performance and emission of a diesel
[32] M. P. Dorado, E. Ballesteros, J. M. Arnal, J. Gomez, and F. J. Lopez, “Exhaust emissions from a Diesel engine fueled with transesterified waste olive oil[small star, filled],” Fuel, vol. 82, no. 11,
pp. 1311–1315, Jul. 2003.
[33] A. Monyem and J. H. Van Gerpen, “The effect of biodiesel oxidation on engine performance and emissions,” Biomass and Bioenergy, vol. 20, no. 4, pp. 317–325, Apr. 2001.
[34] A. S. Ramadhas, C. Muraleedharan, and S. Jayaraj, “Performance and emission evaluation of a diesel engine fueled with methyl esters of rubber seed oil,” Renewable Energy, vol. 30, no. 12, pp. 1789–1800, Oct. 2005.
[35] C.-Y. Lin and H.-A. Lin, “Diesel engine performance and emission characteristics of biodiesel produced by the peroxidation process,” Fuel, vol. 85, no. 3, pp. 298–305, Feb. 2006.
[36] M. Canakci, “Performance and emissions characteristics of biodiesel from soybean oil,”
Proceedings of the Institution of Mechanical Engineers, Part D: Journal of Automobile Engineering, vol. 219, no. 7, pp. 915–922, Jul. 2005.
[37] C. Haşimoğlu, M. Ciniviz, İ. Özsert, Y. İçingür, A. Parlak, and M. Sahir Salman, “Performance characteristics of a low heat rejection diesel engine operating with biodiesel,” Renewable Energy, vol. 33, no. 7, pp. 1709–1715, Jul. 2008.
[38] O. Armas, K. Yehliu, and A. L. Boehman, “Effect of alternative fuels on exhaust emissions during diesel engine operation with matched combustion phasing,” Fuel, vol. 89, no. 2, pp. 438– 456, Feb. 2010.
[39] B.-F. Lin, J.-H. Huang, and D.-Y. Huang, “Experimental study of the effects of vegetable oil methyl ester on DI diesel engine performance characteristics and pollutant emissions,” Fuel, vol. 88, no. 9, pp. 1779–1785, Sep. 2009.
[40] M. Gumus and S. Kasifoglu, “Performance and emission evaluation of a compression ignition engine using a biodiesel (apricot seed kernel oil methyl ester) and its blends with diesel fuel,”
Biomass and Bioenergy, vol. 34, no. 1, pp. 134–139, Jan. 2010.
[41] Y. ULUSOY, Y. TEKIN, M. CETINKAYA, and F. KARAOSMANOGLU, “The Engine Tests of Biodiesel from Used Frying Oil,” Energy Sources, vol. 26, no. 10, pp. 927–932, 2004. [42] Z. Utlu and M. S. Kocak, “The effect of biodiesel fuel obtained from waste frying oil on direct
injection diesel engine performance and exhaust emissions,” Renewable Energy, vol. 33, no. 8,
pp. 1936–1941, Aug. 2008.
[43] J.-T. Song and C.-H. Zhang, “An Experimental Study on the Performance and Exhaust Emissions of a Diesel Engine Fuelled with Soybean Oil Methyl Ester,” Proceedings of the Institution of Mechanical Engineers, Part D: Journal of Automobile Engineering, vol. 222, no.
12, pp. 2487–2496, Dec. 2008.
[44] A. Pal, A. Verma, S. S. Kachhwaha, and S. Maji, “Biodiesel production through hydrodynamic cavitation and performance testing,” Renewable Energy, vol. 35, no. 3, pp. 619–624, Mar. 2010.
[45] C. Carraretto, A. Macor, A. Mirandola, A. Stoppato, and S. Tonon, “Biodiesel as alternative fuel: Experimental analysis and energetic evaluations,” Energy, vol. 29, no. 12–15, pp. 2195–2211,
Oct. 2004.
[46] H. Raheman and A. G. Phadatare, “Diesel engine emissions and performance from blends of karanja methyl ester and diesel,” Biomass and Bioenergy, vol. 27, no. 4, pp. 393–397, Oct. 2004.
[47] X. Meng, G. Chen, and Y. Wang, “Biodiesel production from waste cooking oil via alkali catalyst and its engine test,” Fuel Processing Technology, vol. 89, no. 9, pp. 851–857, Sep. 2008. [48] J. F. Reyes and M. A. Sepúlveda, “PM-10 emissions and power of a Diesel engine fueled with
crude and refined Biodiesel from salmon oil,” Fuel, vol. 85, no. 12–13, pp. 1714–1719, Sep. 2006.
[49] K. Ryu, “The characteristics of performance and exhaust emissions of a diesel engine using a biodiesel with antioxidants,” Bioresource Technology, vol. 101, no. 1, Supplement, pp. S78–S82, Jan. 2010.
[50] M. A. Kalam and H. H. Masjuki, “Testing palm biodiesel and NPAA additives to control NOx and CO while improving efficiency in diesel engines,” Biomass and Bioenergy, vol. 32, no. 12, pp. 1116–1122, Dec. 2008.
[52] M. Balat, “Potential alternatives to edible oils for biodiesel production – A review of current work,” Energy Conversion and Management, vol. 52, no. 2, pp. 1479–1492, Feb. 2011.
[53] M. F. J. Brunt, H. Rai, and A. L. Emtage, “The Calculation of Heat Release Energy from Engine Cylinder Pressure Data,” SAE International, Warrendale, PA, 981052, Feb. 1998.
[54] F. Payri, J. M. Luján, J. Martín, and A. Abbad, “Digital signal processing of in-cylinder pressure for combustion diagnosis of internal combustion engines,” Mechanical Systems and Signal Processing, vol. 24, no. 6, pp. 1767–1784, Aug. 2010.
[55] J. M. Desantes, J. Galindo, C. Guardiola, and V. Dolz, “Air mass flow estimation in
turbocharged diesel engines from in-cylinder pressure measurement,” Experimental Thermal and Fluid Science, vol. 34, no. 1, pp. 37–47, Jan. 2010.
[56] S. Jaichandar, P. Senthil Kumar, and K. Annamalai, “Combined effect of injection timing and combustion chamber geometry on the performance of a biodiesel fueled diesel engine,” Energy, vol. 47, no. 1, pp. 388–394, Nov. 2012.
[57] M. Gumus, C. Sayin, and M. Canakci, “Effect of Fuel Injection Timing on the Injection, Combustion, and Performance Characteristics of a Direct-Injection (DI) Diesel Engine Fueled with Canola Oil Methyl Ester-Diesel Fuel Blends,” Energy & fuels, vol. 24, no. MAIJUN, pp. 3199–3213.
[58] G. Knothe, A. C. Matheaus, and T. W. Ryan III, “Cetane numbers of branched and straight-chain fatty esters determined in an ignition quality tester☆,” Fuel, vol. 82, no. 8, pp. 971–975, May
2003.
[59] R. P. Rodríguez, R. Sierens, and S. Verhelst, “Ignition delay in a palm oil and rapeseed oil biodiesel fuelled engine and predictive correlations for the ignition delay period,” Fuel, vol. 90, no. 2, pp. 766–772, Feb. 2011.
[60] N. Bezaire, K. Wadumesthrige, K. Y. Simon Ng, and S. O. Salley, “Limitations of the use of cetane index for alternative compression ignition engine fuels,” Fuel, vol. 89, no. 12, pp. 3807– 3813, Dec. 2010.
[61] Y.-C. Lin, K.-H. Hsu, and C.-B. Chen, “Experimental investigation of the performance and emissions of a heavy-duty diesel engine fueled with waste cooking oil biodiesel/ultra-low sulfur diesel blends,” Energy, vol. 36, no. 1, pp. 241–248, Jan. 2011.
[62] A. V. Bueno, J. A. Velásquez, and L. F. Milanez, “Heat release and engine performance effects of soybean oil ethyl ester blending into diesel fuel,” Energy, vol. 36, no. 6, pp. 3907–3916, Jun. 2011.
[63] G. Labeckas and S. Slavinskas, “The effect of rapeseed oil methyl ester on direct injection Diesel engine performance and exhaust emissions,” Energy Conversion and Management, vol. 47, no. 13–14, pp. 1954–1967, Aug. 2006.
![Table 1 Estimated share of literature (in percentage of publications) on effect of pure biodiesel on engine performance and emission in comparison with Diesel [30],[19]](https://thumb-us.123doks.com/thumbv2/123dok_us/349645.1036004/3.595.68.527.505.613/estimated-literature-percentage-publications-biodiesel-performance-emission-comparison.webp)


![Table 4 Physical and Chemical properties of rapeseed biodiesel and its blends [51]](https://thumb-us.123doks.com/thumbv2/123dok_us/349645.1036004/7.595.75.542.204.356/table-physical-chemical-properties-rapeseed-biodiesel-blends.webp)