R E S E A R C H A R T I C L E
Open Access
Functional abnormalities in the cortical
processing of sound complexity and musical
consonance in schizophrenia: evidence from an
evoked potential study
Kuan-Yi Wu
1, Ching-Wen Chao
2, Ching-I Hung
1, Wei-Hong Chen
3, Yung-Ting Chen
3and Sheng-Fu Liang
3*Abstract
Background:Previous studies have demonstrated functional and structural temporal lobe abnormalities located close to the auditory cortical regions in schizophrenia. The goal of this study was to determine whether functional abnormalities exist in the cortical processing of musical sound in schizophrenia.
Methods:Twelve schizophrenic patients and twelve age- and sex-matched healthy controls were recruited, and participants listened to a random sequence of two kinds of sonic entities, intervals (tritones and perfect fifths) and chords (atonal chords, diminished chords, and major triads), of varying degrees of complexity and consonance. The perception of musical sound was investigated by the auditory evoked potentials technique.
Results:Our results showed that schizophrenic patients exhibited significant reductions in the amplitudes of the N1 and P2 components elicited by musical stimuli, to which consonant sounds contributed more significantly than dissonant sounds. Schizophrenic patients could not perceive the dissimilarity between interval and chord stimuli based on the evoked potentials responses as compared with the healthy controls.
Conclusion:This study provided electrophysiological evidence of functional abnormalities in the cortical processing of sound complexity and music consonance in schizophrenia. The preliminary findings warrant further
investigations for the underlying mechanisms.
Keywords:Music perception, Auditory evoked potential, Event-related potential, Schizophrenia
Background
Schizophrenia is a catastrophic psychiatric disorder that is characterized by positive (hallucinations or delusions) and negative symptoms (apathy or anhedonia), cognitive impairment, and mood or anxiety symptoms. It is com-monly associated with impairments in social and occupa-tional functioning. The characteristics of psychopathology in schizophrenia are suggestive of functional and struc-tural temporal lobe abnormalities [1-4], some of which have been found to be located in the superior temporal gyrus, close to the auditory cortical regions of the brain [3-6]. Considering the interaction between temporal lobe
abnormalities and auditory neurophysiology in schizo-phrenia [3,7], it is intriguing to explore whether the central processing of musical sound in patients with schizophre-nia differs from that in healthy people.
A number of researchers have demonstrated abnormal auditory processing in schizophrenia by evoked potential studies. The most replicated findings include a reduction in the amplitude of the P3 component (P300) [8,9], fail-ure to inhibit the second response to paired-click stimuli (p50) [10,11] and a gating deficit in N1(N100) and P2 component (P200) [12-14]; however, most prior research was limited by a reliance on simple oddball tasks, which requested that subjects detect auditory targets in a string of pure tonal stimuli [7]. These abnormal auditory pro-cessing results cannot demonstrate deficits in the per-ceptive processing of musical sound [3]. Therefore, the * Correspondence:[email protected]
3
Department of Computer Science and Information Engineering & Institute of Medical Informatics, National Cheng Kung University, Tainan, Taiwan Full list of author information is available at the end of the article
pitches are used to construct varying degrees of com-plexity and consonance. These degrees can be perceived due to the related frequency ratios: the simpler ratios, the more consonant. Therefore, the complexity and con-sonance of sound are key features in experiencing music [15]. Use of the auditory evoked potentials (AEPs) tech-nique has proved a powerful tool for comparing music processing in the brain [16,17].
The present study explored this interesting phenome-non through analysis of responses to the features of sound complexity and music consonance. The musical sounds used in this study as the acoustic stimuli consisted of two kinds of newly-created sonic entities, (1) intervals (dyads, combinations of two pitches) and (2) chords (triads, com-binations of three pitches), of varying degrees of conson-ance. The aim of this study was to investigate whether deficits in the central perception of musical sounds are present in patients with schizophrenia.
Methods Subjects
Twelve medicated day-hospital patients with schizophre-nia from the Department of Psychiatry of Chang Gung Memorial Hospital and twelve age- and sex-matched healthy controls were recruited to this study. All subjects were right-handed, reported normal hearing, and had not received any formal music training. Each of the two groups comprised 8 females and 4 males who ranged in age from 20 to 29 years, with a mean (SD) age of 24.7 (2.8) years. Schizophrenia diagnoses were confirmed according to the DSM-IV criteria on the basis of a clin-ical interview and a review of the case files, and degrees of psychopathological symptoms were evaluated by a semi-structured interview using the Positive and Nega-tive Syndrome Scale (PANSS) [18]. Control-group par-ticipants were excluded if they had a current or past history of any psychiatric illness based on screening using the Mini-International Neuropsychiatric Interview (MINI) [19]. All participants were also screened to ex-clude those with a history of seizure, other neurological insult or illness, or a history of substance abuse. The pa-tient group consisted of papa-tients with schizophrenia with a mean duration of illness (SD) of 6.1 (2.5) years prior to testing. The mean (SD) PANSS score in the patient group was 59.5 (8.0), and the mean (SD) scores in the three subscales, the Positive, Negative and General Psy-chopathology scales, were 13.6 (2.4), 16.1 (3.7) and 29.8
43.75 mg, range 37.5–50 mg every two weeks) and one
with Zotepine (400 mg/d). One of the two patients being treated with Clozapine was also receiving combination therapy consisting of Sulpride (100 mg/d); one of the three being treated with oral Risperidone was receiving Haloperidone (7.5 mg/d) in combination and another a 20 mg Flupenthixol decanoate injection every week; two patients were taking mood stabilizers (Lithium, Sodium valproate) and another two were taking an anti-depressant (Fluoxetine). This study was approved by the Institutional Review Board of Chang Gung Memorial Hospital. All subjects had given written informed con-sent for the procedures to be carried out before AEP testing.
Acoustic stimuli and experimental design
The stimuli consisted of two types of sonic structure, in-tervals (2 tones) and chords (3 tones), created with si-nusoidal tones. The tones (350 ms in duration with a 100 ms fade-out time), tuned to the equal-tempered chromatic scale in the range of G# (104 Hz) to E5 (659 Hz), 16 bit, 44.1 kHz, were first created at a fixed amplitude.
In the interval group, tones were paired at pitch inter-vals of 6 (tritone) and 7 (perfect fifth) semitones to pro-duce 24 different dyads, 12 dyads per kind. The perfect fifth (e.g., 220:330hz) is considered more consonant than the tritone (e.g., 220:311hz) because its frequencies are related by simpler ratios. In the chord group, 3 tones were chosen to construct major triads (consonance), di-minished triads (dissonance), and atonal chords (lack of a tonal center) to generate 36 different chords, 12 per kind. The major triad is considered more consonant than the diminished triad or atonal chord because it comprises tones with fundamentals that are related by simple frequency ratios. Each of 5 kinds of sonorities (intervals/chords) was constructed so that the constitu-ent simple tones of the 12 dyads/chords were evenly dis-tributed within the above-defined frequency range, which ensured that the overall frequency characteristics were comparable under all conditions (Figure 1).
In each session, the stimuli (120 trials; a total of 60 different-pitched dyads/chords, each appearing twice) were presented randomly with an inter-stimulus interval
(ISI) randomized in the range of 2–4 seconds to
with a short rest in-between. Professional earphones (Audio-Technica Ath-Pro5) were utilized for binaural stimulus presentation and the intensity was controlled at 65 dB. Subjects were instructed to listen attentively to the acoustic stimuli with closed eyes.
EEG recording
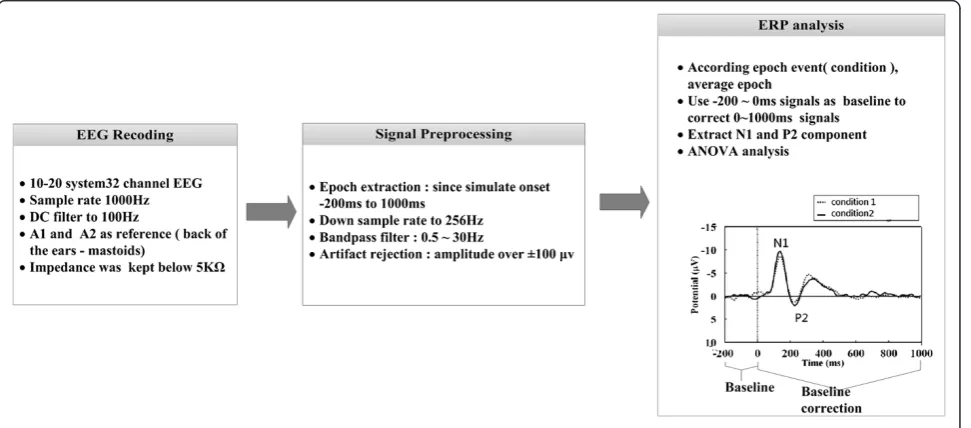
EEG recording and signal processing were shown in Figure 2. EEGs were continuously recorded in DC mode at a sampling rate of 1000Hz using 32 electrodes mounted in elastic caps and referenced to A1–A2, in accordance
with the 10–20 international system. The impedance at
each scalp electrode was kept below 5KΩ. The electrode positions, physical landmarks, and head shape were digi-tized using a Polhemus Fastrak digitizer and the 3D spaceDx software in the Neuroscan SCAN package. The EEG was amplified using a Neuroscan NuAmp and the fil-ter setting was DC to 100Hz, 6 dB/octave attenuation. The digitized EEG data were passed through a digital
band-pass filter of 0.5–30 Hz (EEGLAB, FIR filter) to
eliminate slow drifts and muscular artifacts.
EEG data from 200 ms prior to and 1000 ms following the onset of each stimuli were segmented. To reduce the
differences of component amplitudes in computation and prevent the baseline drift, -200 ~ 0 ms signals were used as baseline to correct 0 ~ 1000 ms signals in each epoch. A typical adult human EEG signals are about
10μV to 100μV in amplitude when measured from the
scalp [20]. Based on EEG signal standardized processing method [21], we set 100 μv as the rejection level to de-tect eye artifacts (including eye blinks, eye movements and extra-ocular muscle activity) and removed the trials which exceed that level. After the removal, there were 5467 trails preserved in the healthy controls, 5729 trails in the schizophrenic patients, both over 70% of the total number of 7500 trials. Generally, N1 and P2 represent the first large negative amplitude and second large posi-tive amplitude after onset of stimulus. In this study we
found N1 and P2 latency were located in 100–150 ms
and 180– 250 ms; therefore, peak amplitudes of the N1
[image:3.595.59.539.90.179.2]and P2 components were determined as the peak rever-sals during the time intervals of 100–150 ms and 180– 250 ms after stimulus onset, respectively. Topographic maps were generated using EEGLAB to define the spatial distributions and dynamics of the activity on the scalp surface [22].
[image:3.595.58.544.506.720.2]Figure 1The auditory stimuli consisting of 2 types of interval and 3 types of chord, of which 12 different transpositions were evenly distributed within the range of G# (104 Hz) to E5 (659 Hz)-a total of 60 different-pitched intervals/chords.
gate the modulation of potentials evoked by acoustic stimuli of varying degrees of consonance consisting of chords (atonal chords, diminished chords, and major tri-ads) and intervals (tritones and perfect fifths). Pearson correlations were performed to examine the relationship between the amplitudes of the AEPs and the psy-chopathological ratings. Significant correlations were validated using non-parametric Spearman rank-order correlations. In all analyses, statistical significance was set at the level ofp< 0.05.
Results
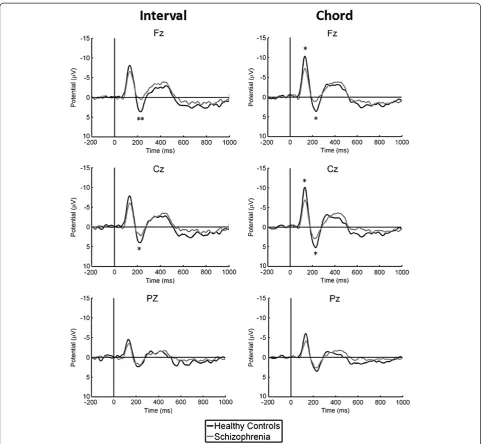
Components N1 and P2 were observed within several hundred milliseconds of stimulus presentation. The la-tency range and topographic distribution did not differ between the schizophrenic patients and the healthy con-trols. Based on topographical analysis, the N1 and P2 amplitudes presented the largest values at the fronto-central sites and appeared equally present at electrode sites over each hemisphere. Repeated-measures ANOVA was performed for the anterior (Fz electrode), central (Cz), and posterior (Pz) sites to analyze the effects of chord and interval stimuli on the amplitudes of the N1 and P2 components.
Sound complexity
Significant reductions in the amplitudes of the N1 and P2 components elicited by both chord and interval stim-uli were observed in the schizophrenic patients (Figure 3). In addition, the N1 amplitudes elicited by chords were found to be significantly greater than those elicited by intervals in the control group; however, this phenome-non was not observed in the schizophrenic patients (Figure 4).
Music consonance
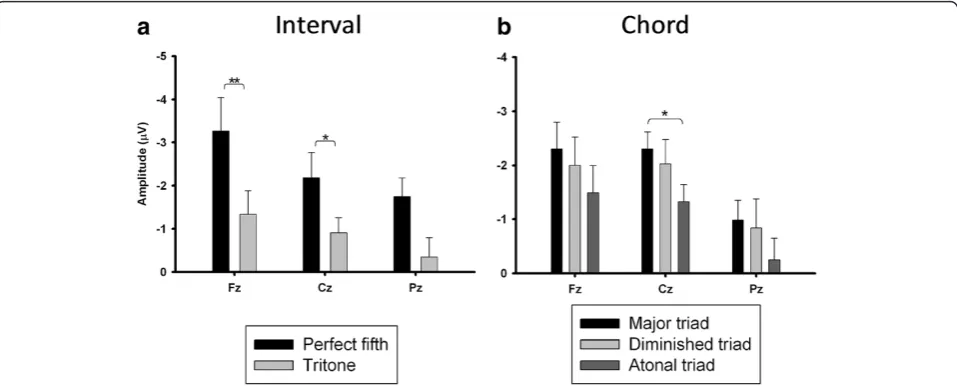
Schizophrenic patients showed reduced N1 and P2 com-ponents elicited by both chord and interval stimuli. We further conducted separate analyses of reductions in am-plitudes for different intervals (perfect fifth and tritone) and chords (major triads, diminished triads and atonal chords) respectively. The results showed schizophrenic patients had greater P2 reductions elicited by perfect fifth than tritons. The reduction in the N1 and P2 ampli-tudes elicited by chords was observed to be the greatest in major triads and the lowest in atonal triads. The sig-nificant differences in the reduction of the P2 amplitude
PANSS score (the range of correlation coefficients 0.21 to 0.48) or the scores of the three subscales (positive subscale−0.43 to−0.05; negative subscale−0.44 to 0.03; somatic subscale 0.003 to 0.22); similarly, correlations between the P2 amplitude and PANSS scores remained statistically non-significant (total score −0.15 to 0.40; positive subscale −0.27 to 0.23; negative subscale 0.13 to 0.56; somatic subscale−0.24 to 0.18). These results were all validated using the non-significant Spearman’s rank correlation coefficient.
Discussion
Our results showed that the N1 and P2 amplitudes were reduced in the schizophrenic patients as compared with the healthy controls. The reduced N1 component has been replicated in a large number of previous studies [23-25], but the P2 response is relatively understudied [26,27]. Most studies have relied mainly on standard oddball tasks or gating tasks, which differ from the lis-tening tasks used in this study. The N1 component
rep-resents the primary stimulus-dependent response
[28,29]. The P2 component represents subsequent po-tentials, which may reflect the mental operation of per-ception within processing-associated brain regions [28]. Another important finding was that when the healthy controls were subjected to interval and chord stimuli, an obvious difference in the N1 component elicited by these two different musical objects was discovered; how-ever, this difference was not observed in the schizo-phrenic patients. It meant that the patients appeared unable to respond to the subtle dissimilarity between in-tervals and chords in this study. This finding might partly imply deficits in sound complexity perception in schizophrenia.
With regards to comparison of the perception of music consonance between patients and controls, it was observed that consonant intervals/chords contributed more highly to the discrepancy in the AEP amplitudes than dissonant ones; in other words, healthy controls can perceive consonant musical sounds to a greater de-gree than schizophrenic patients can. This result might suggest deficits in music consonance perception in schizophrenia. To our knowledge, this study was the first to investigate aspects of the central processing of sound complexity and music consonance in schizophrenia.
N1/P2 amplitude in the schizophrenic patients. Some previous studies reported modest associations [30,31] but most revealed no correlation based on standard odd-ball experiments [24,27,29,32-36]. This study is in line with the assumption that the reduced N1/P2 amplitudes might represent primarily a trait marker of schizophrenia.
The statistical analyses in this study using univariate ANOVA may not be optimal. We conducted a three way ANOVA to rework the statistical analyses. Repeated-measures ANOVA were used to evaluate the group effects with group (patients/controls) as a between-subjects fac-tor, and stimulus type (perfect fifth, tritone, major triads, diminished triads and atonal chords) and region (each
[image:5.595.57.540.87.531.2]EEG channel) as within-subjects factors. The results showed there were significant group by region interactions corresponding to P2 for each music stimulus: perfect fifth (F(1,26) = 4.54, p < 0.001), tritone (F(1,26) = 2.504, p < 0.001), major triads (F(1,26) = 4.72, p < 0.001), diminished triads (F(1,26) = 1.96, p = 0.003) and atonal chords (F(1,26) = 2.37, p < 0.001). Further post-hoc analyses showed the number of EEG channels which could detect significant differences between the patients and controls were observed to be the greatest in major triads and the lowest in atonal triads. These findings demonstrated that the consonant sounds may cause more numbers of EEG channel to detect differences between the two groups than
the dissonant ones. Overall, these findings were consistent with the results previously reported using univariate ANOVA and did not influence the conclusion.
Interpretation and generalization of the current find-ings must acknowledge several limitations of this study. First, medication effects were a major limitation. How-ever, a critical review study indicated that studies reveal-ing a reduced N1 component to be a direct consequence of antipsychotics treatment are rare [29]. Furthermore, the association between N1/P2 components and clinical improvement under medication is also weak [34,37,38]. The recruited patients in previous studies were of medi-cated patients. Thus, medication effects still remained as inevitable confounding factors. Second, this study recruited schizophrenic patients of a young age with an early onset and chronic duration of illness, and there-fore the results cannot be generalized to other patient
samples. Third, the N1 and P2 components cannot be referred to as a single cortical process [29]. These AEP components might reflect information processing of multiple domains of higher cortical functions in the brain, including, but not limited to, perception, atten-tion, memory and executive function. Future investiga-tion may consider the use of musical excerpts from real repertoires to gain further insight into the functional and structural deficits underlying the pathophysiology of musical sound perception in schizophrenia.
Conclusions
[image:6.595.58.539.91.250.2]Schizophrenic patients exhibited significantly lesser acti-vation of the N1 and P2 components than healthy controls while perceiving musical sounds as acoustic stimuli. This study provided electrophysiological evi-dence that schizophrenic patients might suffer deficits in
[image:6.595.59.538.512.705.2]Figure 5Differences in reduction of amplitude of P2 evoked by (a) intervals and (b) chords in schizophrenic patients.*p< 0.05, **p< 0.001.
the cortical perception of sound complexity and music consonance. The underlying mechanisms warrant fur-ther investigations.
Competing interests
The authors declare that they have no competing interests.
Authors’contributions
KYW, CWC and SFL conceived the trial. KYW, CWC and SFL designed the detailed protocol. KYW, CWC, CIH and WHC performed the experiments. KYW, WHC, YTC and SFL analyzed the data. KYW, CWC and SFL wrote the first draft of the paper. All authors contributed to development and revision of the manuscript. All authors have read and approved the final manuscript.
Acknowledgments
This work was supported in part by project grants from the National Science Council (NSC 95-2221-E-009-193-MY2, 102-2220-E-006-010, 102-2220-E-009-017) and Chang Gung Memorial Hospital (CMRPG-371771).
Author details
1Department of Psychiatry, Chang Gung Memorial Hospital at Linkou &
College of Medicine, Chang Gung University, Taoyuan, Taiwan.2Department of Music, National Taiwan Normal University, Taipei, Taiwan.3Department of Computer Science and Information Engineering & Institute of Medical Informatics, National Cheng Kung University, Tainan, Taiwan.
Received: 11 July 2012 Accepted: 16 May 2013 Published: 30 May 2013
References
1. Suddath RL, Casanova MF, Goldberg TE, Daniel DG, Kelsoe JR Jr, Weinberger DR:Temporal lobe pathology in schizophrenia: a quantitative magnetic resonance imaging study.Am J Psychiatry1989,146(4):464–472. 2. Marsh L, Harris D, Lim KO, Beal M, Hoff AL, Minn K, Csernansky JG, DeMent
S, Faustman WO, Sullivan EV,et al:Structural magnetic resonance imaging abnormalities in men with severe chronic schizophrenia and an early age at clinical onset.Arch Gen Psychiatry1997,54(12):1104–1112. 3. Engelien A, Stern E, Silbersweig D:Functional neuroimaging of human
central auditory processing in normal subjects and patients with neurological and neuropsychiatric disorders.J Clin Exp Neuropsychol2001,
23(1):94–120.
4. Wible CG, Kubicki M, Yoo SS, Kacher DF, Salisbury DF, Anderson MC, Shenton ME, Hirayasu Y, Kikinis R, Jolesz FA,et al:A functional magnetic resonance imaging study of auditory mismatch in schizophrenia.Am J Psychiatry2001,158(6):938–943.
5. Schlaepfer TE, Harris GJ, Tien AY, Peng LW, Lee S, Federman EB, Chase GA, Barta PE, Pearlson GD:Decreased regional cortical gray matter volume in schizophrenia.Am J Psychiatry1994,151(6):842–848.
6. Menon RR, Barta PE, Aylward EH, Richards SS, Vaughn DD, Tien AY, Harris GJ, Pearlson GD:Posterior superior temporal gyrus in schizophrenia: grey matter changes and clinical correlates.Schizophr Res1995,16(2):127–135. 7. Bruder G, Kayser J, Tenke C, Amador X, Friedman M, Sharif Z, Gorman J:Left
temporal lobe dysfunction in schizophrenia: event-related potential and behavioral evidence from phonetic and tonal dichotic listening tasks.
Arch Gen Psychiatry1999,56(3):267–276.
8. Hirayasu Y, Asato N, Ohta H, Hokama H, Arakaki H, Ogura C:Abnormalities of auditory event-related potentials in schizophrenia prior to treatment.
Biol Psychiatry1998,43(4):244–253.
9. Salisbury DF, Shenton ME, Sherwood AR, Fischer IA, Yurgelun-Todd DA, Tohen M, McCarley RW:First-episode schizophrenic psychosis differs from first-episode affective psychosis and controls in P300 amplitude over left temporal lobe.Arch Gen Psychiatry1998,55(2):173–180.
10. Adler LE, Olincy A, Waldo M, Harris JG, Griffith J, Stevens K, Flach K, Nagamoto H, Bickford P, Leonard S,et al:Schizophrenia, sensory gating, and nicotinic receptors.Schizophr Bull1998,24(2):189–202.
11. Boutros N, Zouridakis G, Rustin T, Peabody C, Warner D:The P50 component of the auditory evoked potential and subtypes of schizophrenia.Psychiatry Res1993,47(3):243–254.
12. Boutros NN, Korzyukov O, Jansen B, Feingold A, Bell M:Sensory gating deficits during the mid-latency phase of information processing in medicated schizophrenia patients.Psychiatry Res2004,126(3):203–215.
13. Bramon E, Rabe-Hesketh S, Sham P, Murray RM, Frangou S:Meta-analysis of the P300 and P50 waveforms in schizophrenia.Schizophr Res2004,70(2):315–329. 14. Hu L, Boutros NN, Jansen BH:Sensory gating-Out and gating-in in normal
and schizophrenic participants.Clin EEG Neurosci2012,43(1):23–31. 15. Itoh K, Suwazono S, Nakada T:Cortical processing of musical consonance:
an evoked potential study.Neuroreport2003,14(18):2303–2306. 16. Boso M, Politi P, Barale F, Enzo E:Neurophysiology and neurobiology of
the musical experience.Funct Neurol2006,21(4):187–191.
17. Koelsch S, Gunter TC, Wittfoth M, Sammler D:Interaction between syntax processing in language and in music: an ERP Study.J Cogn Neurosci2005,
17(10):1565–1577.
18. Kay SR, Fiszbein A, Opler LA:The positive and negative syndrome scale (PANSS) for schizophrenia.Schizophr Bull1987,13(2):261–276. 19. Sheehan DV, Lecrubier Y, Sheehan KH, Amorim P, Janavs J, Weiller E,
Hergueta T, Baker R, Dunbar GC:The mini-international neuropsychiatric interview (M.I.N.I.): the development and validation of a structured diagnostic psychiatric interview for DSM-IV and ICD-10.J Clin Psychiatry 1998,59 Suppl 20:22–33. quiz 34–57.
20. Aurlien H, Gjerde I, Aarseth J, Eldøen G, Karlsen B, Skeidsvoll H, Gilhus N:
EEG background activity described by a large computerized database.
Clin Neurophysiol2004,115(3):665–673.
21. Croft RJ, Barry R:Removal of ocular artifact from the EEG: a review.
Neurophysiologie Clinique/Clinical Neurophysiology2000,30(1):5–19. 22. Delorme A, Makeig S, Delorme A, Makeig S:EEGLAB: an open source
toolbox for analysis of single-trial EEG dynamics including independent component analysis.J Neurosci Methods2004,134(1):9–21.
23. Ford JM, Mathalon DH, Kalba S, Marsh L, Pfefferbaum A:N1 And P300 abnormalities in patients with schizophrenia, epilepsy, and epilepsy with schizophrenialike features.Biol Psychiatry2001,49(10):848–860.
24. O’Donnell BF, Vohs JL, Hetrick WP, Carroll CA, Shekhar A:Auditory event-related potential abnormalities in bipolar disorder and schizophrenia.
Int J Psychophysiol2004,53(1):45–55.
25. Boutros NN, Korzyuko O, Oliwa G, Feingold A, Campbell D, McClain-Furmanski D, Struve F, Jansen BH, Boutros NN, Korzyuko O,et al:
Morphological and latency abnormalities of the mid-latency auditory evoked responses in schizophrenia: a preliminary report.Schizophr Res 2004,70(2–3):303–313.
26. O’Donnell BF, Hokama H, McCarley RW, Smith RS, Salisbury DF, Mondrow E, Nestor PG, Shenton ME:Auditory ERPs to non-target stimuli in schizophrenia: relationship to probability, task-demands, and target ERPs.Int J Psychophysiol1994,17(3):219–231.
27. Salisbury DF, Collins K, McCarley RW:Reductions in the N1 and P2 auditory event-related potentials in first-hospitalized and chronic schizophrenia.Schizophr Bull2010,36(5):991–1000.
28. Javitt DC, Shelley AM, Silipo G, Lieberman JA:Deficits in auditory and visual context-dependent processing in schizophrenia: defining the pattern.Arch Gen Psychiatry2000,57(12):1131–1137.
29. Rosburg T, Boutros NN, Ford JM, Rosburg T, Boutros NN, Ford JM:Reduced auditory evoked potential component N100 in schizophrenia–a critical review.Psychiatry Res2008,161(3):259–274.
30. Gallinat J, Mulert C, Bajbouj M, Herrmann WM, Schunter J, Senkowski D, Moukhtieva R, Kronfeldt D, Winterer G:Frontal and temporal dysfunction of auditory stimulus processing in schizophrenia.Neuroimage2002,17(1):110–127. 31. Sumich A, Harris A, Flynn G, Whitford T, Tunstall N, Kumari V, Brammer M,
Gordon E, Williams LM:Event-related potential correlates of depression, insight and negative symptoms in males with recent-onset psychosis.
Clin Neurophysiol2006,117(8):1715–1727.
32. Higashima M, Urata K, Kawasaki Y, Maeda Y, Sakai N, Mizukoshi C, Nagasawa T, Kamiya T, Yamaguchi N, Koshino Y:P300 and the thought disorder factor extracted by factor-analytic procedures in schizophrenia.
Biol Psychiatry1998,44(2):115–120.
33. Bruder GE, Kayser J, Tenke CE, Friedman M, Malaspina D, Gorman JM: Event-related potentials in schizophrenia during tonal and phonetic oddball tasks: relations to diagnostic subtype, symptom features and verbal memory.Biol Psychiatry2001,50(6):447–452.
34. Eikmeier G, Lodemann E, Zerbin D, Gastpar M:Event-related potentials in schizophrenic patients in the acute phase and in remission.EEG EMG Z Elektroenzephalogr Elektromyogr Verwandte Geb1991,22(1):15–20. 35. Mathalon DH, Ford JM, Rosenbloom M, Pfefferbaum A:P300 reduction and
prolongation with illness duration in schizophrenia.Biol Psychiatry2000,
doi:10.1186/1471-244X-13-158
Cite this article as:Wuet al.:Functional abnormalities in the cortical processing of sound complexity and musical consonance in
schizophrenia: evidence from an evoked potential study.BMC Psychiatry
201313:158.
Submit your next manuscript to BioMed Central and take full advantage of:
• Convenient online submission
• Thorough peer review
• No space constraints or color figure charges
• Immediate publication on acceptance
• Inclusion in PubMed, CAS, Scopus and Google Scholar
• Research which is freely available for redistribution