2016 International Conference on Mathematical, Computational and Statistical Sciences and Engineering (MCSSE 2016) ISBN: 978-1-60595-396-0
Network Dynamic Analysis Method for Project Governance Risk Control
Rong-gui DING, Lei WANG
*, Tao SUN, Shao-chong GAO and Chen QIAN
School of Management, Shandong University, 27 Shanda Nanlu, Jinan, P.R. China 250100 *Corresponding author
Keywords: Project governance, Risk, Social network analysis, System dynamics.
Abstract. A network dynamic analysis (NDA) method is developed in this paper to reveal the inherent mechanism of project governance risk control, which integrates the method of social network analysis and system dynamics. Specifically, project governance structure was expressed as a social network in which the nodes indicate each stakeholder in the project and the relationships between nodes represent stakeholders’ risk control responsibility for the other party. The method of system dynamics is applied to capture the change of risk factors and the resulting adjustment of network relationships. To show how the NDA method is applied to project governance risk control, a simulation example is given and results indicate valuable theoretical and practical implications.
Introduction
Project governance is the process of setting project goals, attaining the goals and monitoring the outcomes [1], which reflects the institutional arrangements on rights, responsibilities and interests among project stakeholders [2]. Project governance risk mainly means the possibility, influence and control reliability of stakeholders’ uncertain behavior [3], which emphasizes risk factor analysis of the task and risk control responsibility of the stakeholder. According to the survey of the Standish Group for software projects, successful projects accounts for only about 30% [4]. The control of project governance risk through risk factor analysis and risk control responsibility assignment becomes the key to project success, which is the focus of this paper.
In prior studies, system dynamics (SD) method was used to reveal the mechanism of risk evolution by analyzing dynamic interaction between risk factors, and set the measures to control risk based on the sensitivity analysis. Scholars proposed two kinds of logic of SD method in project risk factor analysis. The first logic is constructing the SD model unit based on the project task process, and then building the relationships between risk factors and the unit [5-8]. The second is directly building SD model according to the relationships between risk factors [9, 10]. However, both the logics neglect the analysis on risk control responsibility of project stakeholders, which can directly determine the change of risk factor level.
SNA describes relationships between agents through conceptual network structure model [11], which is used to analyze stakeholders’ relationship as it can statically evaluate complex relationship between multiple agents by the indicators such as centrality, network distance and structural hole [12-14].This paper advocates that the level of project governance risk is also associated with control reliability of the stakeholder [3], which also indicates that project stakeholders undertake risk control responsibilities (e.g., communication). SNA can help to build a social network of project stakeholders in which the risk control responsibility of each stakeholder is linked together. However, stakeholders’ responsibility and relationship may change with the levels of risk factors during project lifecycle, while SNA does not apply to the dynamic analysis of responsibility relationship.
Network Dynamic Analysis Method for project governance risk control in order to implement the analysis of both risk and responsibility.
The Logical Model
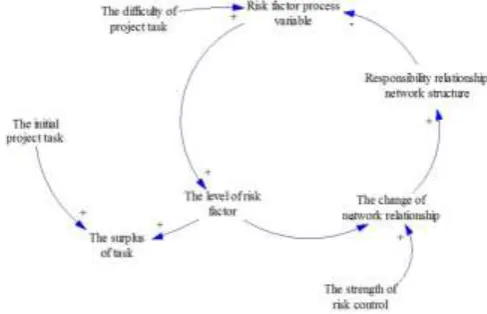
[image:2.595.175.419.178.335.2]The dynamic interactive relationship between the project factors in task dimension and the responsibility relationship network of risk control in organization dimension is shown in Figure 1.
Figure 1. The logical model for the dynamical evolution of responsibility relationship network.
The relationships between stakeholders are adjusted according to the level of risk factors, and the stakeholders assume the control responsibility and correspond to the risk factor. Hereinto, the risk control responsibilities include: responsibility of planning, and this means putting forward the demand and scheme of risk control; responsibility of operation, and this means implementing the risk control plan and meeting the demand of risk control; responsibility of maintenance, and this means providing resources and tools for risk control process; and responsibility of monitoring, this means monitoring, managing and evaluating the processes of planning, operation and maintenance [3]. Moreover, the strength of risk control reflects the risk preferences of stakeholders, which can have an influence on the adjustment extent of network relationship.
Furthermore, the structure of responsibility relationship network affects the risk factor process variable which reflects the possibility of risk factor. When the risk factor process variable value is better, the possibility of risk factor is lower. Meanwhile, the difficulty of project task affects the risk factor process variables. The difficulty of project task is associated with the project environment and the difficulty of technique. When the difficulty of project task increases, the value of risk factor process variable get worse; that is to say, the higher the difficulty of project task is, the greater the possibility of risk is. Moreover, the level of risk factor affects the surplus of project task. For example, when the level of duration risk is high, the task of the construction contractor will increase; and when the level of quality risk is high, the task of the supervision institution will increase.
In the logical model for the dynamical evolution of responsibility relationship network, there is a matching relationship between the risk factor and the risk control responsibility, and the dynamic evaluation of responsibility relationship network is realized. The model lays the foundation for the analysis and control of the project governance risk.
The Mathematical Model
Figure 2. The mathematical model for the responsibility relationship network evolution. Table 1. Variables and the implications.
Variables Implications
Ni,j(m) The network relationship between node i and node j in stage m
O The set containing the operation nodes Ni The ego-network with node i as the center
CS The strength of risk control
s The adjustment coefficient for CS
r The coefficient adjustment for the level of risk factor
RFLq(m) The level of risk factor q in stage m; RFLq(0) represents the initial level of risk factor q
RFLAm
The mean value of all the levels of risk factors in stage m; RFLA0 represents the mean value of all the initial levels of risk factors
RCCm The cost for risk control in stage m
h The coefficient of RCCm
RCCT The total cost for risk control in a network evolution process
Dis The mean value of network distances between planning node and operation nodes
d The number of operation nodes
Mi The number of maintenance nodes connecting to node i
M The mean value of the number of maintenance nodes connecting to operation nodes Dc The mean value of network distances between planning node and the other nodes Ds The mean value of network distances between monitoring nodes and the other nodes
n The number of nodes in the network
Den Network density
INIm The value of integral network index in stage m Mu0 The initial mean value of random function Sig0 The initial standard deviation of random function Mum The mean value of random function in stage m Sigm The standard deviation of random function in stage m
g The adjustment coefficient for INIm
PTD The difficulty of project task
k The adjustment coefficient for PTDm
RFCm The risk loss in stage m
f The coefficient for risk loss
PTSm The surplus of project task in stage m r The adjustment coefficient for the level of risk factor RFLmax The maximal value of the level of risk factor RFLmin The minimum value of the level of risk factor
IPT The initial project task
[image:3.595.81.527.272.776.2]The Change Process of Responsibility Relationship Network
The changes of responsibility relationship network involve three aspects: the improvement for the timeliness of information communication between the maintenance nodes and operation nodes; the improvement for the timeliness of the resources supply from maintenance nodes to operation nodes; and the improvement for the information transmission of planning nodes in the network. The changes are expressed as the change of operation nodes’ ego-network and the change of planning nodes’ ego-network. In stage m, the current risk state, that is to say the result of last stage’s risk state, should be considered when the operation nodes’ relationships are going to be adjusted. In stage 1, the initial level of risk factor RFLq(0) should be considered. The difficulty of project task
and the intensity of risk control are shown in Equation 1, in which variable i represents the operation node.
Ni,j(m) = No,j(0)∗ (1 + s ∗ CS) ∗ (1 + r ∗ RFLq(m−1)), i ∈ O, j ∈ Ni. (1) RFLA represents the overall levels of risk factors. In stage m, RFLA should be considered when the planning nodes’ relationships are going to be adjusted. As shown in Figure 2, variable i represents the planning node. In stage 1, RFLA0 represents the initial value of RFLA; that is to say,
the mean value of all the initial levels of risk factors.
Ni,j(m) = Ni,j(0)∗ (1 + s ∗ CS) ∗ (1 + r ∗ RFLAm−1), j ∈ Ni. (2) The adjustment for responsibility relationship network needs to pay the price, which means the cost for risk control, as shown in Equation 3. For example, when the frequency of information exchange increases, the communication time increases.
RCCm = h ∗ ∑ ∑ (Ni j i,j(m)− Ni,j(0)). (3)
The total cost for risk control in one network revelation process is the sum of each stage’s cost for risk control.
RCCT = ∑ RCCm m. (4)
The Indicators of Responsibility Relationship Network
Effective responsibility relationship is beneficial for risk control [15], so the structure of responsibility relationship network affects the level of risk factor; that is to say, the quantization result of responsibility relationship network represents the value of governance risk. To realize the quantization of responsibility relationship network, the nodes’ network status and the overall network structure should be considered.
There should be abundant information and resources for the operation nodes when the scheme of risk control is implemented. The timeliness and accuracy of information transmission are affected by the network distance between the planning nodes and the operation nodes, so the mean value of the network distances between them represents the overall state of the information transmission [16], as shown in Equation 5. Variable j represents the planning node.
Dis = 1
d∑i∈ODisi,j. (5)
The operation nodes obtain resources from the maintenance nodes. The quality of resources can be measured by the mean value of the number of maintenance nodes that connect to operation nodes, as shown in Equation 6.
M = 1
d∗ ∑i∈OMi. (6)
Likewise, the mean value of the total distances between monitoring nodes and the other nodes represents the capacity of information collection of monitoring nodes, as shown in Equation 8.
Dc = 1
n−1∑j≠iDisi,j, i represents the planning node. (7)
Ds = 1
n−1∑j≠iDisi,j, i represents the monitoring node. (8)
At last, the close connection between each node is beneficial to controlling risk [17], so the intensity can measure the structure of whole network, as shown in Equation 9.
Den = 2
n(n−1)∑ ∑i j>𝑖Ni,j. (9)
The integral network index is formed by calculating the geometric average of upper indexes, as shown in Equation 10.
INIm = √Dis ∗ M ∗ Dc∗ Ds∗ Den
1 5
. (10)
The Change Process of Risk Factor Level
Generally, the variation of levels of risk factors is uncertain, so the mean and standard deviation of the normal distribution function are used as the risk process variables which will be influenced by the integrated network indexes and the difficulty of the task in stage m, as shown in Equation 11 and 12.
Mum = Mu0− ( g
GRm− 1) + k ∗ PTD. (11)
Sigm= Sig0
( g
GRm−1)
∗ k ∗ PTD. (12)
And the level of risk factors in stage m is the sum of the value of random function and the level of risk factors in last stage, as shown in equation 13.
RFL𝑞(𝑚)= RFL𝑞(𝑚−1)+ Normalrand(Mu𝑚, Sig𝑚). (13)
The losses due to the risks in every stage can be calculated by the average level of risk factors, as shown in equation 14.
RFC𝑚 = f ∗ RFLA𝑚. (14) Accordingly, the total risk loss in the network evolution process is the sum of the risk losses in every stage, as shown in equation 15.
RFCT = ∑ RCCm m. (15) In addition, the surplus of project task is equal to the total project task in the initial stage, and the PTS is affected by the level of risk factors, as shown in Equation 16. When the PTS becomes zero, the evolution process of the responsibility relationship network is finished, and the value of m becomes the maximal value at this time.
PTS𝑚+1 = PTR𝑚+ r ∗ RFLA𝑚. (16)
Example
Model Initialization
patterns or stipulated stakeholders’ work regulation to change stakeholders’ initial relationship. In Network 2, governance subject built relationship between plan and execution nodes. Network 3 set relationship between plan nodes (stakeholders) and all others, and increased the direct connection between control and execution nodes. Meanwhile, it improved network’s risk control ability. Each network’s quantified indicators are presented below.
Table 2. Initial network’s quantified indicator.
Dis↓ M↑ Dc↓ Ds↓ Den↑ INI↓ Network 1 2.500 3.000 2.364 2.364 0.197 1.272 Network 2 1.000 4.000 1.545 2.364 0.227 0.893 Network 3 1.000 5.000 1.000 1.455 0.348 0.625 Notes: ↑means the bigger the better. ↓means the smaller the better.
[image:6.595.188.406.450.556.2]Other key variables and values are listed in Table 3[16, 18].
Table 3. Values of model key variables.
Variable Value Variable Value Variable Value
k 0.25 r 0.1 r 1
f 5(in ten thousand) Mu0 0 RFLmax 4
g 1.27 Sig0 1 RFLmin 0
s 0.1 h 1(in ten thousand) RFLq(0) 1
Simulation Process
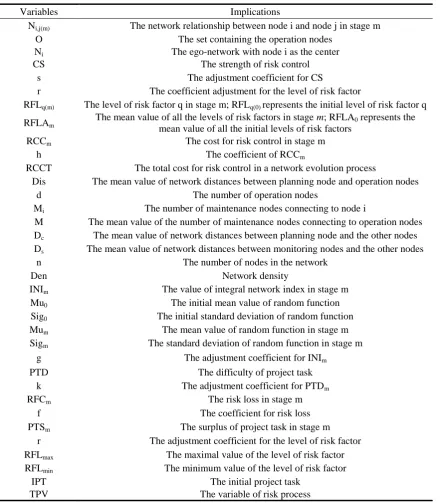
Network Revolution Process in General Situation. In the general situation, the initial network was Network 2. Defined that PTD was equal to two, and CS was equal to one. We got the stable simulation result after running 1000 simulations (RCCT=238.24, RFCT=905.52, RCT=1143.76). Relative indicators in 1000 simulations changed (Figure 3, 4 and 5).
Figure 3. Simulation analysis of RFCT (PTD=2, CS=1, in Network 2).
[image:6.595.187.409.598.707.2]Figure 5. Simulation analysis of RCT (PTD=2, CS=1, in Network 2).
We compared simulations among different situations though adjusting the key variables, such as PTD, CS and initial network.
[image:7.595.66.529.278.342.2]Different Initial Networks. When the PTD was equal to 2 and the CS was equal to 1, we got simulation results (Table 4).
Table 4. Simulation results of different networks.
CS PTD RCCT
(In ten thousand)
RFCT (In ten thousand)
RCT (In ten thousand) Network 1 1.00 2.00 517.26 4804.10 5321.36 Network 2 1.00 2.00 238.24 905.52 1143.76 Network 3 1.00 2.00 39.88 70.06 109.94
From 1000 simulations, we chose a network evolution process whose RCT value was same with the average RCT value of the 1000 simulations (error is less than 1‰), and then analyzed the change of RFLA in the network evolution process (Figure 6).
Figure 6. Changing trend of RFLA in different networks (PTD=2, CS=1).
In Network 3, the risk reduced rapidly and kept at a lower level. In Network 2, the risk fell slowly. While, the risk increased all the time in Network 1, which means that Network 1 cannot control risk under the condition of PTD was equal to two and CS was equal to one. Therefore, we further performed the simulation in different control strengths under the condition of PTD was equal to one (task difficulty is the lowest) in Network 1 (Figure 7).
[image:7.595.172.425.401.531.2] [image:7.595.178.421.636.760.2]In Network 1, no matter how the control strength changed, RFLA increased continuously. Control afterwards cannot solve the risk caused by poor network structure.
[image:8.595.149.447.162.237.2]Different Control Strengths. In Network 2, when the value of CS changed from one to three and the value of PTD was two, we got simulation results (Table 5). Results turned good as the control strength increased.
Table 5. Network simulation results in different control strengths.
CS PTD RCCT (In ten thousand)
RFCT (In ten thousand)
RCT (In ten thousand)
1.00 2.00 0.00 1723.80 1723.80
2.00 2.00 238.24 905.52 1143.76 3.00 2.00 294.08 714.39 1008.47 4.00 2.00 323.86 595.79 919.65
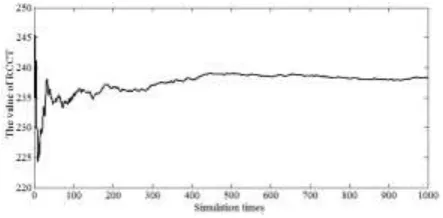
From 1000 simulations, we chose a network evolution process whose RCT value was same with the average RCT value of the 1000 simulations (error is less than 1‰), and then analyzed the change of RFLA in the network evolution process (Figure 8).
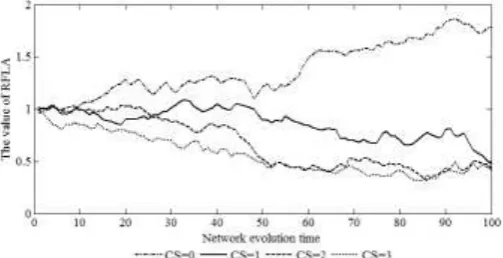
Figure 8. Changing trend of RFLA in different control strengths (PTD=2, in Network 2).
The tendency of RFLA got better with the increasing of control strength. The difference was obvious between no control measure (CS=0) and having control measures, but there was little difference in high CS (CS=2 or 3).
Conclusion
SD can analyze the dynamic evolution process of risk factor, while is hard to associate risk factor with control responsibility. SNA can evaluate the risk control responsibility relationships among stakeholders statically, while cannot explore the dynamic evolution of the relationships that change with risk factor. So it is hard to effectively support the risk control process by both alone. Based on the analysis of stakeholder risk control responsibility, this paper matches the risk factor and corresponding stakeholder, and then explores dynamic relationship between risk factor in task dimension and risk control responsibility in organization dimension, which forms Network Dynamic Analysis Method. By the new method, we conducted dynamic analysis of the responsibility relationship network and the results are presented below.
(1) Initial network structure is effective in the risk control process, which is same with the current study [19, 20].
(2) It cannot control the risk effectively in the poor initial network structure even though the project difficulty is lowest and the control strength is strongest, which demonstrates that initial network structure has fundamental effect on risk control.
[image:8.595.171.423.307.436.2]Acknowledgement
This research was financially supported by the National Natural Science Foundation (71572094), the National Soft Science Research Program (2013GXS5D199) and the Natural Science Foundation of Shandong Province (ZR2015GM015).
References
[1] J. R. Turner, Towards a theory of project management: The nature of the project governance and project management, International Journal of project management. 24 (2006) 93-95.
[2] Yan, Ling, Y. L. Yin, D. J. Fan, A conceptual model for public project governance, China Soft Science. 6 (2004) 130-135.
[3] R. G. Ding, H. Gao, N. Zhang, An analysis on some concepts in project governance, Journal of Shandong University (Philosophy and Social Sciences). 2(2013) 132-142.
[4] Information on http://www.infoq.com/articles/ Standish-chaos-2015
[5] E. B. Roberts, The dynamics of research and development. Diss. Massachusetts Institute of Technology, 1962.
[6] K. G. Cooper, The rework cycle: How it really works… and reworks, PM network. (1993) 25-28.
[7] D. N. Ford, J. D. Sterman, The Liar’s Club: concealing rework in concurrent development, Concurrent Engineering. 11 (2003) 211-219.
[8] S. H. Lee, F. Peña-Mora, M. Park, Quality and change management model for large scale concurrent design and construction projects, Journal of Construction Engineering and Management. 131 (2005) 890-902.
[9] C.B. Li, G. S. Lu, System dynamics model of construction project risk element transmission, Systems Engineering-Theory & Practice. 32 (2012) 2731-2739.
[10] G. H. Wang, J. L. Zhou, X. Y. Lang, Research on structural risk of regional collaborative innovation network based on SD, Science & Technology Progress and Policy. 32 (2015) 8-9.
[11] T. Rowley, D. Behrens, D. Krackhardt, Redundant governance structures: An analysis of structural and relational embeddedness in the steel and semiconductor industries, Strategic management journal. 21 (2000) 369-386.
[12] T. J. Rowley, Timothy J, Moving beyond dyadic ties: A network theory of stakeholder influences, Academy of management Review. 22 (1997) 887-910.
[13] S. Ferriani, G. Cattani, C. Baden-Fuller, The relational antecedents of project-entrepreneurship: Network centrality, team composition and project performance, Research Policy. 38 (2009) 1545-1558.
[14] X. Zheng, Y. Le, Y. Hu, Review of the application of social network analysis (SNA) in construction project management research, International Journal of Project Management. 34 (2016) 1214-1225.
[15] J. Teller, Portfolio Risk Management and Its Contribution to Project Portfolio Success: An Investigation of Organization, Process, and Culture. Project Management Journal. 44 (2013) 36-51.
[17] O. Zwikael, J. Smyrk, Project governance: Balancing control and trust in dealing with risk, International Journal of Project Management. 33 (2015) 852-862.
[18] H. Xi, C K Goh, P S Dutta, et al. , An agent-based simulation system for dynamic project scheduling and online disruption resolving, Proceedings of the 2015 International Conference on Autonomous Agents and Multiagent Systems. International Foundation for Autonomous Agents and Multiagent Systems. 2015.
[19] R. Müller, S. Pemsel, J. Shao, Organizational enablers for project governance and governmentality in project-based organizations, International Journal of Project Management. 33 (2015) 839-851.