2017 2nd International Conference on Computational Modeling, Simulation and Applied Mathematics (CMSAM 2017) ISBN: 978-1-60595-499-8
Performance Evaluation of a Risk-based Three-tier Inspection System
Chia-Hung WANG
1,2,*and Jinman LAN
11
College of Information Science and Engineering, Fujian University of Technology, Fuzhou City, Fujian Province 350118, China
2
Fujian Provincial Key Laboratory of Big Data Mining and Applications, Fuzhou City, Fujian Province 350118, China
*Corresponding author
Keywords: Arena simulation, Security management, Passenger screening, Queueing system, Sensitivity analysis.
Abstract. The simulation model of a risk-based three-tier inspection system is presented in the paper for the security management of screening passengers. In this study, passengers are classified to three risk classes (Trusted class, Regular class, and Risky class) based on their assessed risk level. A hybrid simulation model is developed to simulate the passengers' behavior from the moment they enter the inspection system until they leave the system. We study the performance evaluation of the proposed inspection system through an Arena simulation platform. The sensitivity analysis from a series of our numerical experiments shows the managerial effect of the model parameters on two performance measures in terms of passengers' average waiting time and the overall safety level.
Introduction
With the increasing of terrorist attacks in the last decade, the research on the inspection systems for security screening of passengers has become more and more important. The security checks at the inspection systems are intended to ensure the required safety level for the screening of passengers (and their items) into a security restricted area [1]. After each new attack or attempt occurs, the security administrations enhance more strict security checks. However, the congestion and delay caused by the enhanced security definitely increase passengers’ inconvenience and business loss. The screening technologies deployed for 100% passenger screening have caused significant economic and operational concerns, such as high operation costs, low processing rates, and high error rates of the detection systems, etc. Thus, one important goal of research works on the inspection systems is to perform the security-check process efficiently while maintaining a high safety level of the inspection system [2].
The aim of this study is to investigate the system performance of implementing the proposed risk-based three-tier inspection system for screening passengers at the security-check points. A simulation model will be developed to study the performance of overall safety level and average waiting time of the proposed system. We consider three types of inspection stations in this risk-based system, i.e., Green Lane, Normal Lane, and Selectee Lane. According to passengers’ assessed risk values and the given risk thresholds, incoming passengers are classified into three classes (Trusted class, Regular class, and Risky class) and will be assigned to one of those three types of inspection stations. We conduct a series of sensitivity analysis for the proposed risk-based three-tier inspection system through an Arena simulation platform. The numerical results in this study could contribute managerial insights for security administrations to optimize the operation and parameter settings of the proposed inspection system.
Literature Review
The risk-based passenger prescreening programs intend to partition passengers into separate classes according to the level of risk they pose. It aims at enhancing security by profiling low-risk, medium-risk and high-risk passengers prior to their arrival at the security checkpoints by matching their names with the lists of trusted travelers and the watch lists of potentially dangerous individuals. For example, aviation security operations utilize prescreening systems to help quantify the perceived risk of passengers at the airports, e.g., Computer Assisted Passenger Prescreening System II (CAPPS II) and Secure Flight program [1, 2]. The risk information about passengers is used to perform decisions on how each individual passenger should be screened within the security checkpoints.
The trade-off between system safety and efficiency has been an important research issue in decades [3, 4, 5]. Zhang et al. [3] studied a two-stage security-check system and examined the trade-off between maximizing the security screening level and minimizing the expected waiting time at the U.S.-Canadian border crossings. Wang et al. [4] developed a modeling framework to study the economic trade-offs between the container-inspection decisions, wherein two performance measures (the average waiting time and the safety level) for the inspection systems were addressed. Wang [5] studied the trade-off between the average waiting time and the safety level of a risk-based inspection system with two types of inspection queues, wherein Selectee Lanes for higher risk class and Non-selectee Lanes for lower risk class.
Developing simulation models is an important tool for security administrations to study the operation and system behavior of the inspection systems, e.g., interested readers can refer to the related research works [6, 7, 8] and reference therein. Wang [8] developed Arena simulation models for analyzing the aviation passenger security-check systems. Huang et al. [9] studied a queueing model for tiered inspection lines at the airports, where the incoming passengers are classified into three risk categories (Trusted class, Regular class, and Risky class). Therefore, the security administrations can improve their managerial decisions on the operational control or system design at security checkpoints through the analysis of simulation models for the studied inspection systems.
A Risk-based Three-tier Inspection System
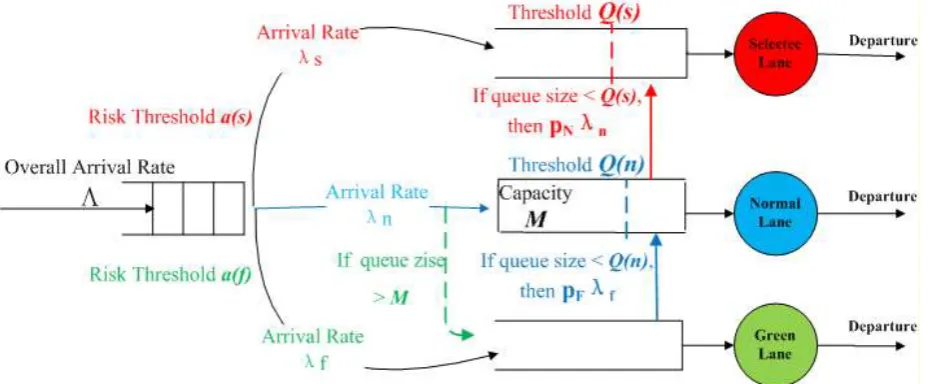
In this paper, we study the safety level and system congestion in a risk-based inspection system with three types of security-check lanes, named as Green Lane, Normal Lane, and Selectee Lane (as shown in Figure 1). Based on the assessed threat values of incoming passengers and two risk thresholds managed by the security administrations, passengers can be classified into three risk classes: Trusted passengers at the low-risk class, Regular passengers at the medium-risk class, and Risky passengers at the high-risk class. The assessment of each passenger' risk level is identified by the government intelligence systems, which is based on the information and data collected by the government or the Customs. We assume each passenger is characterized by an assessed threat value Θ with the range 0 < Θ < 1. Based on two risk thresholds 0 < a(f) < a(s) < 1, incoming passengers are differentiated by their perceived risk levels (low-risk class, medium-risk class, and high-risk class), and then go to the corresponding inspection lanes (Green Lane, Normal Lane, and Selectee Lane) for security-check procedures. We assume the overall arrival rate of passengers to the security checkpoints is Λ. Given two risk thresholds a(f) and a(s), the average arrival rate to Green Lane can be determined as λf, and the average arrival rate to Selectee Lane is λs. Meanwhile, the average arrival rate to Normal Lane can be determined as λn = Λ λfλs.
medium-risk group would receive an intermediate level of screening in Normal Lane. In the proposed model, we assume that the finite buffer size of Normal Lane is set to M. For the operational efficiency of customs clearance, if the number of Regular passengers in Normal Lane exceeds its capacity M, then the incoming Regular passengers will go to Green Lane for expedited inspection.
[image:3.595.68.534.230.422.2]For the safety goal of the security management, we assume that passengers in the lower risk class can share the strict inspection service with the higher risk class, while the corresponding queue length is less a given threshold. For example, if the number of passengers waiting in Selectee Lane is below the threshold Q(s), the proportion pN of Regular passengers waiting in Normal Lane can be sent to Selectee Lane for more strict inspection. Similarly, the proportion pF of Trusted passengers waiting in Green Lane can be sent to Normal Lane for normal security check, if the number of passengers waiting in Normal Lane is below its threshold value Q(n).
Figure 1. A risk-based three-tier inspection system for screening passengers at the security checkpoints.
Next, we develop a simulation model with the Arena simulation software to determine the average waiting time and overall safety level of the proposed inspection system. Our Arena simulation model is a collection of modules, including data modules, logic modules and process modules [8]. For the studied security-check processes, each module contains all of the required model parameters, logic, and animation necessary to describe its specific portion of this risk-based three-tier inspection system. Our simulation experiments conducted in Section 4 will reveal the performance effect of model parameters on the proposed inspection system.
Sensitivity Analysis
Here, we conduct the sensitivity analysis to study the managerial effect of model parameters on the overall safety level and average waiting time of the proposed system. In a series of Arena simulation experiments, we assume each passenger’s risk value follows a Truncated exponential distribution (which is a common assumption taken from [2] and [8]), and its expected value is given as 0.0625. The other parameters are selected carefully from the examples in [9]. We give the overall arrival rate Λ=1770.5 (passengers per hour), the average service rates of each corresponding station in Green Lane, Normal Lane, and Selectee Lane are 9.00, 18.33, and 3.08 passengers per minute, respectively.
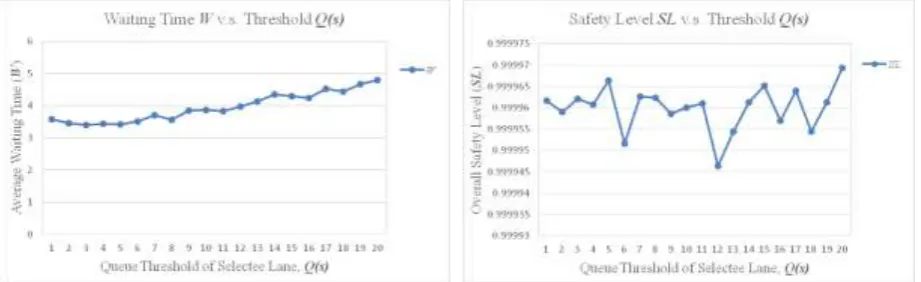
when we vary the value of queue threshold Q(n) from 1 to 20. In Figure 5, it shows that the average waiting time is increased when changing the queue threshold Q(s) from 1 to 20; however, the trend of change in the overall safety level is not significant enough.
[image:4.595.69.532.120.675.2]
Figure 2. Two performance measures of the proposed inspection system when varying the risk threshold a(f).
Figure 3. Two performance measures of the proposed inspection system when varying the risk threshold a(s).
Figure 4. Two performance measures of the proposed inspection system when varying the queue threshold Q(n).
[image:4.595.66.530.128.268.2][image:4.595.69.530.626.767.2]
Summary
The main contribution of this paper is to provide a modeling framework to evaluate the overall system performance of the proposed risk-based three-tier inspection system for screening passengers. A simulation model is developed via an Arena platform for investigating the sensitivity analysis of the proposed system. We have conducted a series of numerical experiments on the system performance through varying different model parameters. We found several significant trends in change of passengers’ average waiting time and the overall safety level of the system. The practical application of this study would contribute managerial understanding to the optimal design of the next-generation inspection systems for screening passengers or cargos at security checkpoints. In the future theoretical works, we could derive the stability analysis of this risk-based three-tier inspection system by formulating a two-dimensional Markov process.
Acknowledgement
This work was financially supported by Fujian Provincial Department of Science and Technology, China, under Grant No. 2016J01330, and the Education Department of Fujian Province, China, under Grant No. JAT160337.
References
[1] A.J. Lee, S.H. Jacobson, Addressing Passenger Risk Uncertainty for Aviation Security Screening. Transport. Sci. 46 (2012) 189-203.
[2] E.C. Sewell, A.J. Lee, S.H. Jacobson, Optimal Allocation of Aviation Security Screening Devices. J. Transport. Secur. 6 (2013) 103-116.
[3] Z.G. Zhang, H.P. Luh, C.-H. Wang, Modeling Security-Check Queues. Manage. Sci. 57 (2011) 1979-1995.
[4] C.-H. Wang, M.-E. Wu, C.-M. Chen, Inspection Risk and Delay for Screening Cargo Containers at Security Checkpoints. In: 11th International Conference on Intelligent Information Hiding and Multimedia Signal Processing (IIH-MSP-2015), IEEE Press, New York, 2015, pp. 211-214.
[5] C.-H. Wang, A Modelling Framework for Managing Risk-based Checkpoint Screening Systems with Two-type Inspection Queues. In: 3rd International Conference on Robot, Vision and Signal Processing (RVSP 2015), IEEE Press, New York, 2015, pp. 220-223.
[6] J.L. Snowdon, E. MacNair, M. Montevecchi, C.A. Callery, S. El-Taji, S. Miller, IBM Journey Management Library: An Arena System for Airport Simulations. J. Oper. Res. Soc. 51 (2000) 449-456.
[7] X. Nie, G. Parab, R. Batta, L. Lin, Simulation-Based Selectee Lane Queuing Design for Passenger Checkpoint Screening. Eur. J. Oper. Res. 219 (2012) 146-155.
[8] C.-H. Wang, Arena Simulation for Aviation Passenger Security-Check Systems. Advances in Intelligent Systems and Computing, 536 (2016) 95-102.