http://dx.doi.org/10.4236/ojms.2015.53029
Temporal Variation in Composition and
Abundance of Phytoplankton Species during
2011 and 2012 in Acapulco Bay, Mexico
Giovanni Moreno-Díaz
1, Agustín A. Rojas-Herrera
2, Juan Violante-González
2,
Justiniano González-González
1, José Luis Rosas Acevedo
1, Sergio García Ibáñez
21Unidad de Ciencias de Desarrollo Regional, Universidad Autónoma de Guerrero, Acapulco, México 2Unidad Académica de Ecología Marina, Universidad Autónoma de Guerrero, Acapulco, México Email: acu.amar@hotmail.com
Received 13 June 2015; accepted 26 July 2015; published 30 July 2015
Copyright © 2015 by authors and Scientific Research Publishing Inc.
This work is licensed under the Creative Commons Attribution International License (CC BY). http://creativecommons.org/licenses/by/4.0/
Abstract
Phytoplankton samples were collected in Acapulco Bay during 2011 (January-April and Septem-ber) and 2012 (April-July, October, and NovemSeptem-ber) with the objective of determining the abun-dance and species composition. Samples were collected in two stations located in the bay. A total of 82 species were identified: 42 dinoflagellates, 35 diatoms, three cyanobacteria, and two silicof-lagellates. Dinoflagellates were more abundant in the dry season, while diatoms dominated during rainy season. At least seven dinoflagellate species were recorded as potentially toxic, which may increase their populations and turn into harmful algal blooms (HABs) if environmental conditions within the bay are modified. In April 2012 a HAB of the non-toxic species Neoceratium balechii was documented.
Keywords
Marine Phytoplankton, Species Composition, Acapulco Bay, Mexico
1. Introduction
composi-tion are affected by several processes, including high water temperature, and variacomposi-tions in thermal stability and nutrient circulation. Changes can occur in the taxonomic composition of phytoplankton communities, the total cell abundance and species richness during annual seasonal cycles. These changes reflect the capacity of com-munities to respond to seasonal variations in light, nutrient and circulation patterns [2].
Santa Lucia Bay, also known as Acapulco Bay, is located on the tropical Pacific coast of southern Mexico, in Guerrero State. The bay has a semi-circular (6.3 km diameter), amphitheater-like shape created by low hills (<500 m) surrounding the south-facing bay. It is considered to be very climatologically protected [3]. Neverthe-less the ecological importance of the bay, because it operates as nursery for many fish species, which feed inside the same, very few studies have been carried out on the phytoplankton communities and in particular on the variation in the species composition through time [3] [4]. The aim of the present study was to examine the tem-poral variation, in the species composition and abundance in the phytoplankton community of Acapulco Bay, during two years.
2. Materials and Methods
Phytoplankton samples were collected in Acapulco Bay between January-April and September 2011, and April-July, October, and November 2012. Two sampling stations were established within the study area: 1- Morro San Lorenzo (16˚51'N, 99˚53'W) and 2-Casa de Díaz Ordaz (16˚50'N, 99˚51'W). Water temperature (˚C), salinity (psu), dissolved oxygen (mg/L), and chlorophyll (µg/L) were measured in situ with an YSI probe. Nu-trient (nitrates, ammonium and phosphates) concentrations were determined in each sampling following a stan-dard colorimetric method (Hanna equip). Samples were taken using a plankton net of 31 cm diameter, 1.28 m length, and 150 µm mesh size. Phytoplankton samples were fixed in concentrated Lugol’s solution and cell quantification was made using the Utermöhl chamber sedimentation concentration method. Phytoplankton spe-cies distribution was established based on a review of published records for Mexico and other countries, and each species was classified as: 1) estuarine; 2) neritic; 3) adiaphoric or 4) oceanic. The Olmstead-Tukey associa-tion test [5] was applied to classify the phytoplankton species based on parameters of occurrence frequency and mean abundance: (D) dominant (abundant and frequent); (C) common (low abundance but frequent); (O) occa-sional (abundant but low frequency); and (R) rare (low abundance and low frequency). Community parameters included total number of species, total number of cells, the Shannon-Wiener (H) diversity index, species even-ness (J) and theBerger-Parker Index (BPI) as a measure of numerical dominance [6] [7]. Similarity in the species composition throughout the sampling period was established with a classification analysis considering abun-dance (number of cells), using the Bray-Curtis index and simple average-group method [8]. A principal compo-nent analysis (PCA) was made using monthly data that included: temperature, salinity, precipitation, phosphates, chlorophyll, oxygen, nitrates, nitrites, and abundance of dinoflagellates and diatoms.
3. Results
Mean temperature recorded at the sampled stations varied between 24.55˚C and 30.55˚C, during the period of January 2011 to November 2012 (Table 1). Salinity varied from 31.4 to 33.7 psu. Dissolved oxygen presented the lowest mean value in April 2012 (2 mg/L) and the highest in March and September 2012 (10 mg/L) (Table 1).
In regards of nutrients, the lowest average values for nitrites occurred in June 2011 (0.0) and the higher in March and September 2011 (0.03). Nitrates ranged from 0.0 to 0.6 mg/l, where the lowest average value was found in May 2012 (0.0) and the highest in March 2011 (0.45). Phosphates ranged from 0.0 to 2.75 mg/L, the lowest average value occurred in January 2011 (0.11) and the highest in September 2011 (1.43) (Table 1).
The lowest average value recorded for chlorophyll was found in November 2012 (1.2) and the highest in July 2011 (1.95). The highest values were recorded from November to December (Table 1).
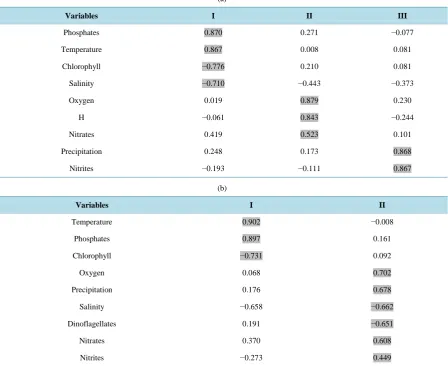
Regarding the community analysis based on eigenvalues and saturation of variables, three components were extracted with 75% of the total explained variance (Table 2(a)). The first component was catalogued as “Chlo-rophyll pattern”, where an increase in phosphates and a decrease in chlo“Chlo-rophyll and salinity is recorded as tem-perature increases; thus a great quantity of phosphates and nitrates were firstly observed and then an increase in chlorophyll, which coincides with a similar behavior of salinity.
Table 1. Physical-chemical parameters of seawater from Acapulco Bay, Guerrero, Mexico. Precipitation (mm), Temperature (˚C), Salinity (‰), Dissolved oxygen (mg/l), Chlorophyll (µg/l), Phosphates, nitrites, and nitrates (mg/l).
Precipitation Temperature Salinity Chlorophyll Nitrites Nitrates Phosphates Oxygen
JAN_11 0 26.07 33.36 1.65 0.3 0.11 5.8
FEB_11 0 27.67 33.38 1.55 0.01 0.35 0.22 5
MAR_11 0.7 26.17 33.58 1.8 0.03 0.45 0.29 10
APR_11 9.6 26.17 33.58 1.8 0.03 0.45 0.29 10
SEP_11 158 30 31.41 1.4 0.03 1.4 1.44 10
APR_12 4.9 28.01 33.7 1.55 0.03 0.3 0.33 2
MAY_12 38.4 30.55 33.24 1.35 0.01 0.1 1.38 9.05
JUN_12 217.1 27.66 33.24 1.45 0.06 0 0.2 8.5
JUL_12 150.9 29.39 32.86 1.95 0.03 0.3 0.13 6.81
OCT_12 98.8 29.79 33.09 1.5 7.47
NOV_12 10.7 29.5 32.9 1.2 0.03 0.17 0.98 6.54
Table 2. Method of extraction of the PCA variables recorded in Acapulco Bay, Guerrero, Mexico.
(a)
Variables I II III
Phosphates 0.870 0.271 −0.077
Temperature 0.867 0.008 0.081
Chlorophyll −0.776 0.210 0.081
Salinity −0.710 −0.443 −0.373
Oxygen 0.019 0.879 0.230
H −0.061 0.843 −0.244
Nitrates 0.419 0.523 0.101
Precipitation 0.248 0.173 0.868
Nitrites −0.193 −0.111 0.867
(b)
Variables I II
Temperature 0.902 −0.008
Phosphates 0.897 0.161
Chlorophyll −0.731 0.092
Oxygen 0.068 0.702
Precipitation 0.176 0.678
Salinity −0.658 −0.662
Dinoflagellates 0.191 −0.651
Nitrates 0.370 0.608
[image:3.595.90.539.350.716.2](c)
Variables I II
Temperature 0.903 −0.010
Phosphates 0.898 0.159
Chlorophyll −0.729 0.092
Oxygen 0.071 0.700
Precipitation 0.179 0.678
Salinity −0.659 −0.662
Diatoms −0.203 0.650
Nitrates 0.371 0.606
Nitrites −0.271 0.452
diversity and nitrates occurs as high oxygen levels are found. The third component was catalogued as “rain ef-fect”, where an increase of precipitations was related to an increase in nitrites.
According to the dinoflagellate population analysis, considering eigenvalues and saturation of variables, two components were extracted with a total explained variance of 58% (Table 2(b)). The first component was cata-logued as “temperature effect”, where an increase of phosphates and a decrease in the quantity of chlorophyll occur as temperature increases. The second component was catalogued as “oxygen effect” where an increase in such factor was related to an increase in precipitation, nitrates, and nitrites, and also to a decrease in both salinity and dinoflagellate population.
Concerning the population analysis for the diatom group, two components with a total explained variance of 58% (Table 2(c)) were extracted. The first component presented the same behavior as the aforementioned case. Both components presented a similar performance to the found in the dinoflagellate analysis, the only difference is that when oxygen and precipitation increase, the diatom population also increase.
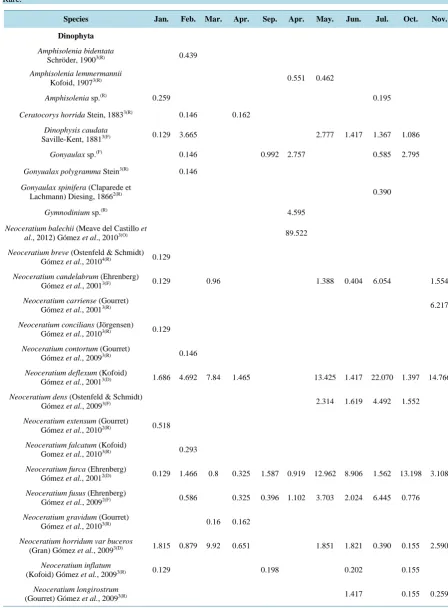
The taxonomic composition analysis of the phytoplankton community indicated that a total of 82 species comprised the community within the bay: 42 dinoflagellates (Dinophyta), 32 diatoms (Bacillariophyta), three blue-green algae (Cyanobacteria), and two silicoflagellates (Heterokontophyta) (Table 3). Although the number of diatom species was relatively low, this group’s total cell abundance represented the 51.7% of the total cells collected during the sampling period. The most important genus were Neoceratium (22 species), and Chaetoce-ros (8 species).
The discrimination of species groups indicated that dinoflagellates dominated numerically during March 2011 as well as in April, May, July, and November 2012; during April, the relative density of dinoflagellates was 100% given the occurrence of an algal bloom where the dominant species was Neoceratium balechii with 89.52% of relative abundance; while diatoms recorded an inversely proportional relationship to dinoflagellate abundance (Table 3). Nine species dominated the phytoplankton community numerically: five dinoflagellate species ( Neo-ceratium balechii, N. tripos, N. deflexum, N. trichoceros, and N. furca) and four diatoms (Chaetoceros sp., Rhi-zosolenia hebetata, Chaetoceros affinis, and Ch. didymus) (Table 3and Table 4). These nine species represent- ed 65.5% of the total of cells estimated for all of the samplings. The dinoflagellate Neoceratium furca was col-lected at all sampling months, Neoceratium balechii was dominant in April 2012 when the massive bloom of this species occurred, and Neoceratium tripos was dominant in May and July 2012. The diatoms Chaetoceros sp. and Rhizosolenia hebetata were also present in all of the months excepting April 2012, where diatoms were ab-sent.
According to the classification of species based on its origin, more than 70% of diatoms and dinoflagellates were classified as adiaphoric species (species that occur in both neritic and oceanic zones), where the percentage of neritic and oceanic species was 16.5 and 9.8% for both groups respectively. The application of a graphic me-thod of classification based on species frequency and abundance, indicated that 22.8% of the diatoms were clas-sified as dominant (abundant and frequent), while 16.6% of dinoflagellates presented the same classification.
Table 3. Relative composition of abundance of the phytoplankton community in Acapulco Bay, Mexico. Distribution: 1 = Estuarine, 2 = Neritic, 3 = Adiaphoric, 4 = Oceanic. Classification: (D) Dominant, (F) Frequent, (O) = Occasional, (R) = Rare.
Species Jan. Feb. Mar. Apr. Sep. Apr. May. Jun. Jul. Oct. Nov.
Dinophyta
Amphisolenia bidentata
Schröder, 19003(R) 0.439
Amphisolenia lemmermannii
Kofoid, 19073(R) 0.551 0.462
Amphisolenia sp.(R) 0.259 0.195
Ceratocorys horrida Stein, 18833(R) 0.146 0.162
Dinophysis caudata
Saville-Kent, 18813(F) 0.129 3.665 2.777 1.417 1.367 1.086
Gonyaulax sp.(F) 0.146 0.992 2.757 0.585 2.795
Gonyualax polygramma Stein3(R) 0.146
Gonyaulax spinifera (Claparede et
Lachmann) Diesing, 18662(R) 0.390
Gymnodinium sp.(R) 4.595
Neoceratium balechii (Meave del Castillo et
al., 2012)Gómez et al.,20103(O) 89.522
Neoceratium breve (Ostenfeld & Schmidt) Gómez et al., 20104(R) 0.129
Neoceratium candelabrum (Ehrenberg)
Gómez et al., 20013(F) 0.129 0.96 1.388 0.404 6.054 1.554
Neoceratium carriense (Gourret)
Gómez et al., 20013(R) 6.217
Neoceratium concilians (Jörgensen) Gómez et al., 20103(R) 0.129
Neoceratium contortum (Gourret)
Gómez et al., 20093(R) 0.146
Neoceratium deflexum (Kofoid)
Gómez et al., 20013(D) 1.686 4.692 7.84 1.465 13.425 1.417 22.070 1.397 14.766
Neoceratium dens (Ostenfeld & Schmidt)
Gómez et al., 20093(F) 2.314 1.619 4.492 1.552
Neoceratium extensum (Gourret)
Gómez et al., 20102(R) 0.518
Neoceratium falcatum (Kofoid)
Gomez et al., 20103(R) 0.293
Neoceratium furca (Ehrenberg)
Gómez et al., 20012(D) 0.129 1.466 0.8 0.325 1.587 0.919 12.962 8.906 1.562 13.198 3.108
Neoceratium fusus (Ehrenberg)
Gómez et al., 20092(F) 0.586 0.325 0.396 1.102 3.703 2.024 6.445 0.776
Neoceratium gravidum (Gourret)
Gómez et al., 20103(R) 0.16 0.162
Neoceratium horridum var buceros
(Gran) Gómez et al., 20093(D) 1.815 0.879 9.92 0.651 1.851 1.821 0.390 0.155 2.590
Neoceratium inflatum
(Kofoid) Gómez et al., 20093(R) 0.129 0.198 0.202 0.155
Neoceratium longirostrum
Continued
Neoceratium lunula (Schimper ex
Karsten) Gómez et al., 20013(F) 0.129 0.8 0.162 0.390
Neoceratium macroceros
(Ehrenberg) Gómez et al., 20013(R) 0.814 0.925
Neoceratium ranipes (Cleve)
Gómez, 20103(R) 0.16 0.325
Neoceratium symetricum
(Cleve) Gómez et al., 20014(R) 0.129 0.162
Neoceratium trichoceros
(Ehrenberg) Gómez et al., 20093(D) 1.037 0.146 2.08 3.908 0.793 8.796 1.012 20.117 0.155 10.103
Neoceratium tripos
(Müller) Gómez et al., 20013(D) 1.945 0.146 9.28 3.257 0.551 27.314 3.846 23.242 6.055 14.248
Neoceratium sp.(O) 27.2 2.442
Ornithocercus steinii Schütt, 19003(R) 0.129 0.198
Prorocentrum compressum (Bailey)3(R) 0.146
Prorocentrum gracile Schutt, 18953(D) 0.129 5.718 0.32 0.325 0.793 6.018 0.202 0.585 6.521
Prorocentrum sp.(R) 0.439 2.182
Protoperidinium conicum
(Gran) Balech, 19743(R) 0.129 0.325 1.785
Protoperidinium divergens
(Ehrenberg) Balech, 19743(R) 2.594 0.198 2.849
Protoperidinium latispinum
(Mangin) Balech, 19743(R) 0.198
Protoperidinium sp.(D) 0.648 0.146 0.16 1.791 1.785 0.976 6.987 6.476
Pyrocystis fusiformis Wyville-Thompson
ex Blackmann, 19024(F) 1.556 4.252 2.88 0.977
Pyrocystis lunula (J. Schütt)
J. Schütt, 18964(R) 0.146
Subtotal 13.488 23.753 62.56 17.589 11.111 100 81.944 24.291 88.867 40.993 62.172
Bacillariophyta
Amphora angusta var.
Ventricosa (Gregory) Cleve, 18952(R) 0.259
Asteromphalusheptactis
(Brébisson) Ralfs 18612(R) 0.518
Bacteriastrum hyalinum Lauder, 18643(R) 1.388
Chaetoceros affinis Lauder, 18643(D) 33.981 11.290 7.04 2.117 10.119 0.259
Chaetoceros curvisetus Cleve, 18893(F) 0.293 1.140 1.984 1.388
Chaetoceros decipiens Cleve, 18733(R) 3.257 0.793
Chaetoceros didymus Ehrenberg, 18453(D) 15.434 15.982 11.84 6.514 5.952 0.404 0.310 1.554
Chaetoceros lorenzianus Grunow, 18632(R) 0.198
Chaetoceros socialis Lauder, 18642(O) 5.28 18.452
Chaetoceros sp.(D) 26.070 7.771 9.76 6.026 36.904 1.851 33.400 6.835 22.360 19.430
Chaetoceros teres Cleve, 18963(F) 4.539 0.439 0.48 0.651 1.587
Continued
Coscinodicus heteroporus Ehrenberg,
18443(D) 0.648 3.812 0.16 14.169 0.198 0.585 2.849
Coscinodiscus radiatus Ehrenberg 18403(R) 5.555 0.390 1.036
Coscinodiscus sp.(D) 1.612 0.32 14.332
Ditylum brightwelli
(West) Grunow, 18833(F) 0.129 0.439 0.16 2.117 0.198
Eucampia zoodiacus Ehrenberg 18393(R) 0.198
Guinardia delicatula
(Cleve) Hasle, 19972(R) 5.263 4.347
Guinardia flaccida
(Castracane) Peragallo, 18923(R) 0.879 2.768
Guinardia striata (Stolterfoth) Hasle,
19963(R) 1.466 0.16 1.140
Hemiaulus sinensis Greville, 18652(R) 0.198
Leptocylindrus danicus Cleve, 18893(R) 0.162 1.397
Leptocylindrus minimus Gran, 19153(R) 0.310
Licmophora abbreviata Agardh, 18312(R) 0.155
Nitzschia pacifica Cupp, 19433(R) 0.162
Nitzschia sp.(F) 0.129 0.488 0.925 4.048 1.171 3.416
Planktoniella sol (Wallich)
Schütt, 18934(F) 0.651 1.214 0.310 0.259
Proboscia alata (Brightwell)
Sundström, 19863(D) 12.023 0.16 6.188 0.595
Rabdonema sp.(D) 4.409 16.715 0.621
Rhizosolenia hebetata Bailey, 18563(D) 1.037 3.225 1.92 16.938 1.190 31.376 1.562 24.378 11.658
Rhizosolenia imbricata Brightwell, 18583(R) 4.629
Rhizosolenia setigera Brightwell, 18582(R) 2.314
Skeletonema costatum
(Greville) Cleve, 18733(R) 0.162 1.388 0.310
Stephanopyxis palmeriana
(Greville) Grunow, 18843(R) 0.129 2.931 6.746
Thalassiothrix longissima
Cleve & Grunow, 18803(R) 0.325
Subtotal 86.511 75.953 37.28 82.247 88.095 0.0 16.666 75.708 11.132 57.919 37.823
Heterokontophyta
Dictyocha fibula Ehrenberg, 18394(R) 0.146 0.198
Dictyocha octonaria Ehrenberg 18444(R) 0.146
Subtotal 0.293 0.198
Cyanobacteria
Phormidium limosum (Dillwyn)
P.C. Silva, 19961(F) 0.16 0.595 0.925 1.086
Microcystis aeruginosa
(Kützing) Kützing, 18461(R) 0.162
Spirulina sp.(R) 0.462
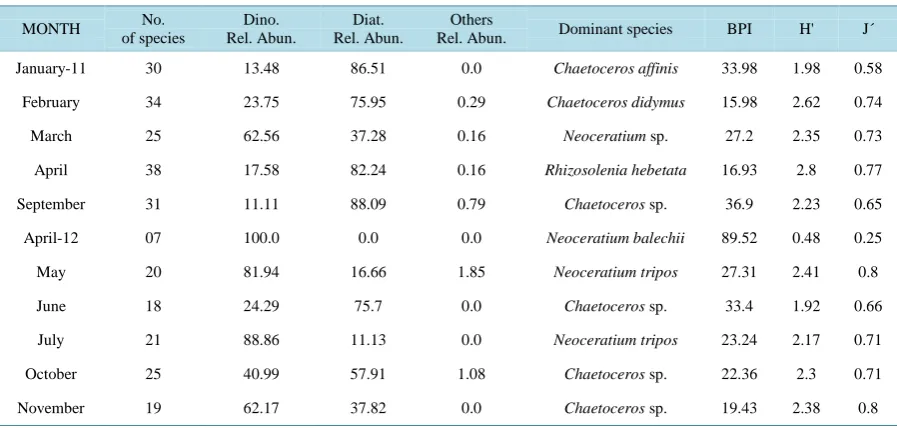
Table 4. Characteristics of phytoplankton communities from Acapulco Bay, Mexico. Dino. = Dinoflagellates, Diat. = Di-atoms, BPI = Berger-Parker Index; H = Shannon-Wiener diversity index, J = Equity index.
MONTH No.
of species
Dino. Rel. Abun.
Diat. Rel. Abun.
Others
Rel. Abun. Dominant species BPI H' J´
January-11 30 13.48 86.51 0.0 Chaetoceros affinis 33.98 1.98 0.58
February 34 23.75 75.95 0.29 Chaetoceros didymus 15.98 2.62 0.74
March 25 62.56 37.28 0.16 Neoceratium sp. 27.2 2.35 0.73
April 38 17.58 82.24 0.16 Rhizosolenia hebetata 16.93 2.8 0.77
September 31 11.11 88.09 0.79 Chaetoceros sp. 36.9 2.23 0.65
April-12 07 100.0 0.0 0.0 Neoceratium balechii 89.52 0.48 0.25
May 20 81.94 16.66 1.85 Neoceratium tripos 27.31 2.41 0.8
June 18 24.29 75.7 0.0 Chaetoceros sp. 33.4 1.92 0.66
July 21 88.86 11.13 0.0 Neoceratium tripos 23.24 2.17 0.71
October 25 40.99 57.91 1.08 Chaetoceros sp. 22.36 2.3 0.71
November 19 62.17 37.82 0.0 Chaetoceros sp. 19.43 2.38 0.8
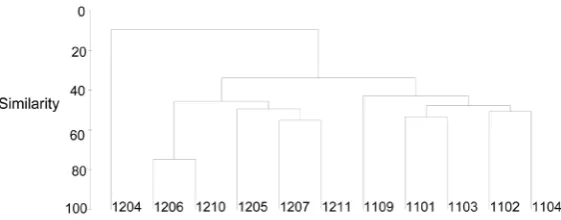
The highest diversity values were reached in February and April 2011 (2.62 and 2.8 respectively) and the lowest in April 2012 (0.48 bits). The comparison of similarity in species composition between sampled months indicated that the similarity percentages were generally low, it was only during June and October 2011 that a percentage higher than 70% was recorded. This indicates that the structure of the phytoplankton community fluctuates widely in regards of time. Three groups were clearly observed, the first comprised the dry months of the sampling period (February, March, and April 2011) and September of that same year; the second group only includes April 2012 were an HAB of Neoceratium balechii was recorded; and the third group was found in the rest of the months of 2012 (Figure 1).
4. Discussion
4.1. Species Composition
The dinoflagellate group (42 species) dominated in terms of species richness in the phytoplankton community of Acapulco Bay; however, its total relative abundance was significantly lower than the found for diatoms. This result coincides with [3] [4] [9] [10]. In regards to species richness in the same study area, however it disagrees with the pattern observed in other studies of phytoplankton composition from other tropical locations, in which diatoms dominate in terms of number of species [11]-[15]. The groups of phytoplankton species are considered to be accurate indicators of water masses [16]. Dinoflagellates are best adapted to oceanic environments, while diatoms to coastal ones [11] [17]. Hence, our results suggest that the environmental conditions within the bay change throughout the year given the variation of environmental parameters, as it is shown in the results of PCA.
Moreover, the environmental changes that occur in the water mass found in the bay are reflected in the cha-racteristics of the phytoplankton community, since more than 70% of the dinoflagellates and diatoms that inha-bit therein are adapted to live in both neritic and oceanic environments, i.e., adiaphoric species [11]. There was no estuarine or freshwater influence observed in the phytoplankton species composition.
Different species dominated numerically on each of the months, indicating a great variability in species com-position through time. The diatom Chaetoceros sp. dominated during the raining season (September 2011), re-cording a great relative abundance 36.9% (Table 4); while its relative abundance decreased significantly in the dry season months (<10% from February to April 2011). The dinoflagellate Neoceratium balechii dominated during April 2012 with 89.52% of relative abundance, however it was only observed in this month causing a HAB, hence it was classified as an occasional dinoflagellate (Table 4).
Figure 1. Similarity percentages among phytoplankton samplings in Acapul-co Bay, MexiAcapul-co.
fact that dinoflagellates from genus Neoceratium (previous Ceratium) can form chains of up to four cells; at some regions of the Pacific and the Caribbean this type of chains allows them to remain floating in the photic zone [17]. In this regard, the genus Neoceratium was the most abundant and included a total of 23 dinoflagellate species, which together represented 31.9% of the total of cells within the phytoplankton community.
4.2. Community Structure
Some studies indicate that changes in the phytoplankton community structure might be related to small changes in water temperature [12] [13] or to the different strategies of the phytoplanktonic groups for nutrient absorption in the water column [18]. Hence, the greatest abundances of some of the phytoplanktonic species found during May, September, and October 2012 can be attributed to water temperatures which are significantly warmer [3] [9] sincehigh temperatures can enhance growth of some dinoflagellate populations. In addition, diatoms respond rapidly to the increase of nutrient concentration [19], thus their growth can be faster than the found for dinofla-gellates, as it occurs during the raining season.
At least six of the 42 identified dinoflagellate species (Dinophysis caudata, Gonyaulax polygramma, G. spi-nifera, Neoceratium furca, N. fusus, and N. tripos), have been related to HABs or red tides in other Mexican lo-calities [20]. Nevertheless, only the species Neoceratium furca and N. tripos were abundant and frequent (do-minant) during the sampling months. Neoceratium tripos reached a maximun relative abundance of 27.3% in May 2012, a month after the HAB caused by Neoceratium balechii (Table 4).
The pattern of species distribution found in the phytoplankton community from Acapulco Bay was similar to the observed in other marine or estuarine communities, given it was structured by a low number of dominant species (seven dinoflagellates and seven diatoms), which contributed with more than 78% of the total abundance, as well as by a high number of occasional and rare species (>64%).
The total richness (82 species) recorded herein, is found within the range of the species reported for the study area [3] [9] [13], as well as for other countries with similar environmental conditions [11] [12] [14]. However,
[10] reported 641 taxa for Acapulco Bay and adjacent areas, which belonged to eight divisions of algae, where the most diverse group was Dinophyta with 347 taxa, followed by Bacillariophyta with 274 taxa. These findings were made through a decade of studies, including an intensive research with bimonthly samplings using a phy-toplankton net, bottle, and observations on living samples that went from February 2010 to February 2011; in the present study, species were collected exclusively using a 150 µm plankton net. The diversity values (0.48 a 2.8 bits) are also similar to the previously found in the study area, where [3] [9] report diversity values (Shan-non-Wiener index) that ranged from 1.45 to 4.06 bits, as well as to findings made in other localities of the Trop-ical Pacific. [11] [20] found diversity values (Shannon-Wiener index) ranging from 3.5 to 5.3 bits, while [21]
recorded values from 2.5 to 4 bits. According to [22], the analysis of several phytoplanktonic communities from different oceanographic localities in the Caribbean, African northeastern Atlantic, and the Mediterranean has provided a wide series of Shannon’s diversity values which range from 2.4 to 2.6 bits. In regards to the afore-mentioned, the phytoplankton diversities in Acapulco Bay are equal to the mode of the most frequent diversities found in the open ocean. During April 2012, the minimum value (0.48 bits) was observed, which coincides with the occurrence of a HAB dominated by Neoceratium balechii.
(Figure 1), indicate that the species composition differed in most of the months given the environmental varia-bility recorded through time. It is shown in the results of PCA too.
Results indicate that species abundance and composition within the phytoplankton community presented sig-nificant temporal fluctuations because of variations in the environmental conditions. In this regard, the environ-mental variation caused by the dry and raining seasons results in significant changes in nutrient concentration, favoring population growth of some dinoflagellate or diatom species throughout the year. The phytoplankton community proved to be an accurate indicator of environmental changes in Acapulco Bay.
References
[1] Silver, W. and Platt, T. (1978) Energy Flux in the Pelagic Ecosystem: A Time-Dependent Equation. Limnology Ocea-nography, 23, 813-816.http://dx.doi.org/10.4319/lo.1978.23.4.0813
[2] Steel, J.H. (1976) Patchiness. In: Cushing, D.H. and Walsh, J.J., Eds., The Ecology of the Seas, Blackwell Scientific Publications, London, 98-115.
[3] Rojas-Herrera, A.A., Violante-González, J., García-Ibáñez, S., Sevilla-Torres, V.M.G., Gil-Guerrero, J.S. and Flores- Rodríguez, P. (2012) Temporal Variation in the Phytoplankton Community of Acapulco Bay, Mexico. Microbiology Research, 3, 13-19.
[4] Moreno-Díaz, G., Rojas-Herrera, A.A., González-González, J., Violante-González, J., Rosas Acevedo, J.L. and García Ibáñez, S. (2015) Temporal and Spatial Variation in the Phytoplankton Community of Acapulco Bay, Mexico. Revista Bio Ciencias, 3, 88-102.
[5] Sokal, R.R. and Rohlf, F.J. (1998) Biometry. 2nd ed. W. H. Freeman and Company, San Francisco, 859 pp. [6] Magurran, A. (1991) Ecological Diversity and Its Measurement. Princeton University Press, Princeton, 178 pp.
[7] Krebs, C.J. (1999) Ecological Methodology. Addison-Welsey Educational Publishers, Inc., Boston, 654 pp.
[8] Digby, P. and Kempton, R. (1987) Multivariate Analysis of Ecological Communities. Chapman and Hall, London, 204 pp.
[9] Rojas-Herrera, A.A., Violante-González, J., Sevilla-Torres, V.M.G., Gil-Guerrero, J.S., Flores-Rodríguez, P. and Rendón-Dircio, J.A. (2012) Species Composition and Abundance of Phytoplankton Communities in Acapulco Bay, Mexico. International Research Journal of Microbiology, 3, 307-316.
[10] Meave-del Castillo, M.H., Zamudio-Resendiz, M.E. and Castillo-Rivera, M. (2012) Riqueza fitoplanctónica de la Bahía de Acapulco y zona costera aledaña, Guerrero, México. Acta Botánica Mexicana, 100, 405-487.
[11] Peña, V. and Pinilla, G.A. (2002) Composición, distribución y abundancia de la comunidad fitoplanctónica de la ensenada de Utría, Pacífico colombiano. Revista de Biología Marina y Oceanografía, 37, 67-81.
[12] Ochoa, N. and Tarazona, J. (2003) Variabilidad temporal de pequeña escala en el fitoplancton de Bahía Independencia, Pisco, Perú. Revista Peruana de Biología, 10, 59-66.
[13] Varona-Cordero, F. and Gutiérrez-Mendieta, F.J. (2006) Composición estacional del fitoplancton de dos lagunas del Pacífico tropical. Hidrobiológica, 16, 159-174.
[14] Moreira, A., L Seisdedo, M., Leal, S., Comas, A., Delgado, G., Regadera, R., Alonso, C., Muñoz, A. and Abatte, M. (2007) Composición y abundancia del fitoplancton de la Bahía de Cienfuegos, Cuba. Revista de Investigaciones Marinas, 28, 97-109.
[15] Vargas-Montero, M., Bustamante, E.F., Guzmán, J.C., Vargas, J.C., et al. (2008) Florecimientos de dinoflagelados nocivos en la costa Pacífica de Costa Rica. Hidrobiológica, 18, 15-23.
[16] Castillo, F. and Vidal, A. (1982) Fitoplancton del Pacífico colombiano como indicadores de masas de agua. Fase CIOH, Cartagena, 1-57.
[17] Castillo, F. (1984) Fitoplancton del Pacífico colombiano como indicador de masas de agua. Erfen IV. Biología Pesquera, 13, 67-70.
[18] Langlois, G.W and Smith, P. (2001) Phytoplankton In: Biology and Ecological Niches in the Gulf of the Farallones. U.S. Geological Survey, Reston, 32-35.
[19] Örnólfsdóttir, E.B., Lumsden, E. and Pinckney, J.L. (2004) Phytoplankton Community Growth-Rate Response to Nu-trient Pulses in a Shallow Turbid Estuary, Galveston Bay, Texas. Journal of Plankton Research, 26, 325-339.
[20] Cortés-Altamirano, R. (1998) Informe regional sobre mareas rojas en México. IOCARIBE-ANCA. II Taller regional, Ciudad de la Habana, 4.
[21] Sánchez, E. (1996) Caracterización espacial del fitoplancton nerítico en el Pacífico Colombiano durante julio-agosto de 1994. Tesis (Biólogo), Facultad de Ciencias, Universidad del Valle, Cali, 60.