http://dx.doi.org/10.4236/jwarp.2014.611090
Uniformity of Precipitation and Radial
Profile of the Super 10 Sprinkler at Different
Operating Pressures
Paulo Eduardo S. Martins
1, Elcides R. da Silva
1, Juan Gabriel C. L. Ruiz
2,
Gustavo R. Barbosa
1, José Renato Zanini
3, Marcílio V. Martins Filho
3 1Centro Universitário de Patos de Minas, Patos de Minas, Brazil²Instituto Taquaritinguense de Ensino Superior, Taquaritinga, Brazil ³São Paulo State University, Jaboticabal, Brazil
Email: paulo_xx_martins@hotmail.com
Received 16 June 2014; revised 21 July 2014; accepted 5 August 2014
Copyright © 2014 by authors and Scientific Research Publishing Inc.
This work is licensed under the Creative Commons Attribution International License (CC BY). http://creativecommons.org/licenses/by/4.0/
Abstract
The study aimed to evaluate the effect of operating parameters of the sprinkler Super 10, manu-factured by NaanDanJain, with green, yellow and blue nozzles on the hydraulic characterization, so that this information can contribute to a better dimensioning of systems and management of ir-rigated areas. For the determination of UC and UD the radial method was used and with the aid of computer application CATCH 3D the overlapping of water slides with ten spacings was calculated. The results demonstrate that the mechanism used for the fractionation of the water jet of sprink-ler Super 10 is efficient because it presented good uniformity of water distribution and low am-plitude of precipitation. For high uniformity of distribution of water in the larger wetting radii, it is recommended to work with Super 10 sprinkler using the green nozzle, with a pressure of 40 mH2O and spacing between sprinklers and lateral lines 12 × 12 m.
Keywords
Hydraulic Performance, Uniformity Irrigation, Water Distribution Profile
1. Introduction
double nozzles with different diameters and deflector arms, which modify the droplet size and pattern of distri-bution of water.
However, the increasing use of water for irrigation purposes has aroused the preoccupation of the public and the political leadership, due to impacts to the environment caused by any misuse of water by irrigators [1]. The increase in water scarcity and wrong dimensioning of irrigation systems has threatened the viability and sustai-nability of agricultural production [2]. Therewith, the increase of productivity rates and higher profitability of farming systems invariably pass through the conservation management of water and soil resources, considering that soil and water are the essential components for sustaining food production for the world population [3].
Given this, irrigated agriculture, largest user of water in the world, has suffered social and economic pressure to mainly reduce water consumption. Thereby, improving the use of resources has become a challenge for irri-gators who, by the necessity of prioritizing the application of water more accurately, need to know the main characteristics of the equipment to be used, to prepare them for better use in field conditions [4] [5].
Given the current environmental appeal and having NaanDanJain Super 10 sprinkler a differential distribution of water, the present study aimed to evaluate the effects of the operating parameters of the sprinkler, with green, yellow and blue nozzles, operating at pressures of 25, 30, 35 and 40 mH2O and using a computational applica-tive, to predict the uniformity in the application of water, in order to generate scenarios that may contribute to a better dimensioning of systems and management of irrigated areas with the aforementioned sprinkler.
2. Materials and Methods
2.1. Local Features
This work was conducted at the Laboratory of Hydraulics of Centro Universitário de Patos de Minas (UNIPAM), in the city of Patos de Minas, MG, and it was developed using polyacetal plastic rotary sprinkler with green, yellow and blue nozzles, manufactured by NaanDanJain, model Super 10, used to irrigate pastures, greenhouses crops, landscaping, among others. The sprinkler presents a full circle (360˚) mechanism through an internal ball that moves along the body of the sprinkler, unlike conventional sprinklers, which have an auxiliary deflector arm for rotation and fractionation of water jet.
2.2. Technical Characteristics of the Sprinkler Super 10
The fractionation of the water jet is accomplished through the combined effect of the rotational movement and the presence of two orifices in the sprinkler nozzle: A circular hole positioned at the center of the nozzle, which sprinkles water to longer distances along the sprinkler radius of wetting; and the another hole, non-circular, just below the circular one, with a rectangular geometric shape for the green nozzle and composed of two rectangles for the blue and yellow nozzles, which sprinkles water nearby the equipment.
According to the manufacturer information, for the green nozzle flow rates range from 0.550 m3·h−1 to 0.695 m3·h−1 when operating pressures are between 25 - 40 mH2O; for the blue nozzle flow rates range from 0.360 m3·h−1 to 0.455 m3·h−1; and for the yellow nozzle flow rates range from 0.45 m3·h−1 to 0.57 m3·h−1.
2.3. Experimental Procedures for Hydraulic Characterization
In order to allow the use of three sprinklers as replicates, the coefficient of manufacturing variation (CV) [6] was determined from the flow through the test of the volume of water collected in function of time and pressure. For this purpose, tests were initially performed with three sprinklers, determining the flow rates measured at four pressures (25, 30, 35, 40 mH2O), making it possible to calculate the CV with Equation (1), which proves the re-presentatively of the sprinklers as replicates. This rere-presentatively was based on Solomon’s classification of un-iformity of flow [6].
(
)
21 1 100 n i m i m q q n CV q = − − =
∑
. (1)
CV—coefficient of manufacturing variation (%); q1, q2, ...qn—flow of each emitter (L h−1); qm—average flow of emitters (L·h−1); and n—number of emitters of lot sampling.
The methodology used to evaluate the uniformity of irrigation was based on CU [7] and UD [8] indices. For this, the radial method was used [9], causing a spreading of equally spaced collectors and forming a radial line from the base of the sprinkler, spaced every 0.5 m on a paved surface. For precipitation values corresponding to approximately 0 m from the sprinkler, four collectors disposed 0.05 m from the elevation pipe of the sprinkler, forming a square around the sprinkler.
The control of operating pressure in each test was performed using two Bourdon manometers, one was coupled at the base of the sprinkler and the other at the pump outlet, both previously calibrated in the laboratory with the mercury manometer. The pressure adjustment was performed with records installed at the pump outlet and at the sprinkler rising stem.
Assays for determining technical feature of the sprinkler were performed under conditions of wind inferior to 2.0 m·s−1, as specified by ABNT [10]. The duration of each test was 60 minutes and time control was conducted with precise timer.
Computational application CATCH 3D version 4.45 [11] was used for the calculation of UC and UD in con-ditions of overlapping blades with different spacing. The results for the overlap and determination of UC and UD of water by sprinkler were based on rainfall data and spacings (6 × 6, 6 × 9, 6 × 12, 8 × 8, 9 × 9, 9 × 10, 9 × 12, 10 × 10, 10 × 12 and 12 × 12 m) between sprinklers and between lateral lines, respectively, were simulated. The interpretation of the values of UC and UD was based on the propositions of Mantovani [12] (Table 1).
2.4. Flow-Pressure Characteristic Curve
Based on average flow rates obtained for each operating pressure and different nozzles, the characteristic equa-tion was set according to Keller and Karmeli [13] (Equation (2)).
n
Q=KH . (2)
where in: Q—flow (m3·h−1); H—pressure (mH2O.); and Kn—Parameters setting.
3. Results and Discussion
3.1. Determination of the Flow Rate and the Coefficient of Manufacturing Variation (CV)
The variation in the manufacturing of sprinklers according to the pressures studied is classified according to So-lomon [6] and represented by CV, as shown in Table 2.It was observed that the sprinkler Super 10 showed a variation of CV between 0.75% and 2.09%, therefore it
Table 1. Proposal for classification of UC and UD values for sprinkler systems.
Classification UC (%) UD (%)
Excellent >90 >84
Good >80 - 90 >68 - 84
Average >70 - 80 >52 - 68
Poor 60 - 70 36 - 52
Unacceptable <60 <36
[image:3.595.87.540.503.603.2]Source: [12].
Table 2. Classification of CV values (%) of the Super 10 for the green, yellow and blue nozzles, as proposed by Solomon
[6].
Pressure (mH2O) CV (%) Green Nozzle CV (%) Yellow Nozzle CV (%) Blue Nozzle Consolidated Classification
25 1.12 2.09 1.60 Excellent
30 0.75 0.94 0.75 Excellent
35 0.79 0.93 0.75 Excellent
[image:3.595.89.541.651.719.2]was classified as excellent for all nozzles studied, as proposed by Solomon [6] and it showed little variation in the flow of issuers due to the manufacturing process. In general, it can be seen from Table 2 that higher CV were predominantly found at low pressures. Corroborate the results found by Martins et al.[1] and Guirra et al. [14], which also indicated little variation in water flow emitters due to differences in manufacturing of other sprinklers from the company NaanDanJain (models 427 and 435). Importantly, the uniformity of water distribu-tion is dependent on the accuracy with which the sprinklers are manufactured, that explains the importance of low values of CV to validate the sprinkler as repetitions in tests of uniformity [15].
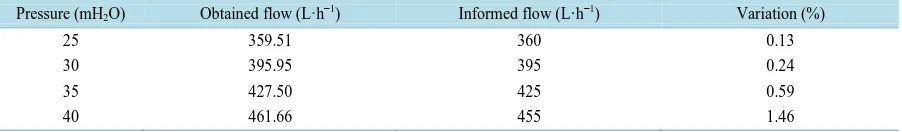
In Tables 3-5, the average values of the flow due to the different operating pressure tests, as well as the flow rate provided in the manufacturer’s catalog are presented. It is observed that the flow data obtained in relation to the data reported by the manufacturer ranged up to 4% and they are in compliance with ABNT [10], which de-termine variation limit of 5% for sprinklers with higher nominal flow rate of 250 L·h−1.
From the flow data obtained from each input pressure for the tests the pressure-flow characteristic equation for the green, yellow and blue nozzles was determined, as proposed by Keller and Karmeli [13] (Figures 1-3).
In all cases (Figures 1-3), it is observed from the analysis of the coefficient of determination (R2) good fit of the data to the models obtained for pressure ranges 25 - 40 H2O. The R2 obtained ranged from 0.98 to 1. It is observed also that the exponent “n” tended to 0.5 for the three nozzles, featuring the sprinkler as an emitter of turbulent flow [10].
3.2. Radial Profile and Uniformity of Water Distribution
Tables 6-8 show the calculated average values of UC and UD for sprinkler Super 10 with green, yellow and blue nozzles, for the row 6 × 6, 6 × 9, 6 × 12, 8 × 8, 9 × 9, 9 × 10, 9 × 12, 10 × 10, 10 × 12 and 12 × 12 m, at pressures of 25, 30, 35 and 40 mH2O using the CATCH-3D computational application [11].
[image:4.595.89.539.444.511.2]The values of UC and UD were evaluated as proposed by Mantovani [12] and according to Tables 6-8, it can be seen that for the vast majority of data UC and UD values decreased with increasing spacing sprinklers for all pressures and for three different nozzles reviews, which corroborates similar findings by Faria et al.[16], Mar-tins et al.[1] and Ribeiro et al. [17].
Table 3. Values and variations between flows provided by the manufacturer and the mean flow obtained in the evaluations of sprinkler Super 10, for green nozzle at different operating pressures.
Pressure (mH2O) Obtained flow (L·h−1) Informed flow (L·h−1) Variation (%)
25 538.58 550 2.08
30 595.96 600 0.57
35 648.38 650 0.25
[image:4.595.86.540.548.616.2]40 697.08 695 0.30
Table 4. Values and variations between flows provided by the manufacturer and the mean flow obtained in the evaluations of sprinkler Super 10, foryellow nozzle at different operating pressures.
Pressure (mH2O) Obtained flow (L·h−1) Informed flow (L·h−1) Variation (%)
25 437.83 450 2.70
30 484.63 495 2.09
35 508.33 530 4.08
[image:4.595.89.540.653.719.2]40 549.41 570 3.61
Table 5. Values and variations between flows provided by the manufacturer and the mean flow obtained in the evaluations of sprinkler Super 10, forblue nozzle at different operating pressures.
Pressure (mH2O) Obtained flow (L·h−1) Informed flow (L·h−1) Variation (%)
25 359.51 360 0.13
30 395.95 395 0.24
35 427.50 425 0.59
Figure 1. Flow-pressure characteristic curve for the Super 10 sprinkler with green nozzle.
Figure 2. Flow-pressure characteristic curve for the Super 10 sprinkler with yellow nozzle.
Figure 3. Flow-pressure characteristic curve for the Super 10 sprinkler with blue nozzle.
Table 6. Calculated average values for UC (%) and UD (%) for Super 10 sprinkler with green nozzle from CATCH-3D software to pressures of 25, 30, 35 and 40 mH2O due to the spacing between sprinklers.
Pressure
(mH2O) UC and UD
Spacing between sprinklers (m)
6 × 6 6 × 9 8 × 8 6 × 12 9 × 9 9 × 10 10 × 10 9 × 12 10 × 12 12 × 12
25 UC 90.6 90.0 90.2 89.9 88.1 88.4 88.1 88.2 88.5 85.8
UD 90.1 85.5 84.0 85.5 84.3 83.7 82.9 80.3 79.9 81.2
30 UC 91.1 91.3 91.8 90.4 89.3 89.2 89.0 89.8 90.0 87.7
UD 90.9 87.6 87.1 86.3 86.2 84.6 83.8 82.0 82.5 83.7
35 UC 92.3 93.7 93.9 91.4 91.5 91.4 91.7 92.3 92.2 89.6
UD 92.2 90.6 91.7 87.3 88.2 86.6 86.7 85.4 86.1 85.3
40 UC 92.9 94.0 94.9 92.5 92.3 91.9 91.5 92.5 92.6 91.6
[image:5.595.176.454.233.350.2] [image:5.595.177.458.388.511.2] [image:5.595.88.538.566.717.2]Table 7. Calculated average values for UC (%) and UD (%) for Super 10 sprinkler with yellow nozzle from CATCH-3D software to pressures of 25, 30, 35 and 40 mH2O due to the spacing between sprinklers.
Pressure
(mH2O) UC and UD
Spacing between sprinklers (m)
6 × 6 6 × 9 8 × 8 6 × 12 9 × 9 9 × 10 10 × 10 9 × 12 10 × 12 12 × 12
25 UC 92.4 87.9 81.6 91.5 82.4 88.1 89.1 84.6 82.1 76.6
UD 88.8 81.4 69.1 85.6 75.4 82.6 84.7 74.0 71.0 67.2
30 UC 93.7 89.7 87.2 93.2 85.0 87.7 91.8 89.0 87.8 83.1
UD 89.8 83.6 76.8 87.9 76.5 83.3 89.8 81.1 77.7 71.4
35 UC 94.6 92.0 86.7 93.6 88.4 91.7 93.6 90.9 88.4 83.8
UD 90.3 88.1 77.5 87.8 82.4 88.3 90.2 84.2 80.3 74.6
40 UC 95.0 93.5 88.7 93.8 91.3 94.2 95.5 92.1 89.7 86.2
UD 90.7 90.7 81.0 87.9 87.6 92.1 91.8 86.3 82.8 78.6
Table 8. Calculated average values for UC (%) and UD (%) for Super 10 sprinkler with blue nozzle from CATCH-3D software to pressures of 25, 30, 35 and 40 mH2O due to the spacing between sprinklers.
Pressure
(mH2O) UC and UD
Spacing between sprinklers (m)
6 × 6 6 × 9 8 × 8 6 × 12 9 × 9 9 × 10 10 × 10 9 × 12 10 × 12 12 × 12
25 UC 96.0 93.4 91.2 91.6 93.0 91.6 89.8 87.6 87.1 85.3
UD 93.6 88.8 87.6 83.4 89.4 86.5 83.8 81.8 77.1 75.7
30 UC 96.7 95.1 94.2 91.1 94.9 94.9 94.1 89.4 88.8 85.7
UD 94.5 91.5 92.3 83.3 92.6 91.1 90.9 84.2 81.1 78.2
35 UC 96.3 94.7 95.0 89.7 94.9 95.2 94.9 89.8 89.0 86.1
UD 93.8 91.4 91.1 85.6 90.8 91.1 91.9 85.0 83.2 78.2
40 UC 96.6 95.0 94.7 87.2 95.4 94.8 93.7 86.3 85.4 81.2
UD 95.0 92.0 91.3 80.0 92.2 91.8 91.0 79.2 78.0 70.5
It can be seen in Table 6, for the green nozzle, that 65% of the evaluated spacings showed maximum degree classification of combined UC and UD, as proposed by Mantovani [12]; for yellow nozzle (Table 7), 45% of the data set found; and for the blue nozzle (Table 8), 57.5%.
As to the recommendations of spacings, it can be seen in Table 7 and Table 8 that for the yellow and blue noz-zles, the best UC and UD results were obtained for the spacing 10 × 10 m, at pressures of 30, 35 and 40 mH2O. The pressure of 25 H2O presented results classified as “good” as proposed by Mantovani [12], however it is worth emphasizing, as Ribeiro et al. [17], Rocha et al.[18] and Rezende et al.[19], that the water redistributes in the soil over time because of its tendency to move from wetter regions to the lower humidity, increasing the unifor-mity and thus the UC and UD indexes.
According to Ribeiro et al. [17], greater spacing will result in fewer emitters in the lateral line reducing flow and pipe diameter and, consequently, the energy consumption of the pumping system; as for the green nozzle (Table 6), high distribution uniformity was obtained in 12 × 12 m spacing. Corroborate the results found by Ya-coubi et al. [20] and Martins et al.[1], who have reported the influence of the pressure on the uniformity of irri-gation systems. It is worth noting that although the increased pressure positively influences the uniformity of wa-ter distribution, as observed by Yacoubi et al.[20] and El-Berry et al.[21] who reported that higher pressures lead to higher energy demand, and since the electricity supply is limited, it is necessary to encourage a more efficient use of it [22].
[image:6.595.92.539.292.436.2]Figure 4. Distribution pattern of water of Super 10 sprinkler with green nozzle operating at
[image:7.595.146.487.105.214.2]pressures of 25, 30, 35 and 40 mH2O.
Figure 5. Distribution pattern of water of Super 10 sprinkler with yellow nozzle operating at
pressures of 25, 30, 35 and 40 mH2O.
Figure 6. Distribution pattern of water of Super 10 sprinkler with blue nozzle operating at
pressures of 25, 30, 35 and 40 mH2O.
along the radius contributing to the effect of low amplitude of precipitation along the wet radius and high distri-bution uniformity.
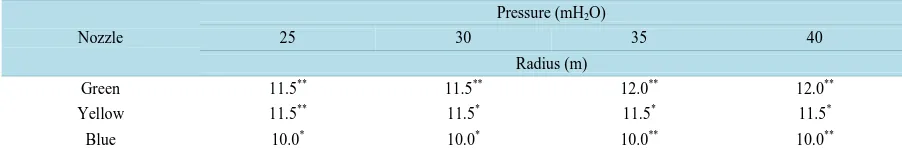
[image:7.595.146.487.252.387.2] [image:7.595.147.486.440.559.2]Table 9. Average values of the wetting radius for the sprinkler Super 10 with green, yellow and blue nozzles under pressures
of 25, 30, 35 and 40 mH2O.
Nozzle
Pressure (mH2O)
25 30 35 40
Radius (m)
Green 11.5** 11.5** 12.0** 12.0**
Yellow 11.5** 11.5* 11.5* 11.5*
Blue 10.0* 10.0* 10.0** 10.0**
Data identified by “*” (asterisk) are observed where the last sink showed water precipitation intensity values lower than 0.25 mm·h−1. Data marked with an “**” (two asterisks) represent observed values where the last two containers showed rainfall intensity of less than 0.25 mm·h−1.
6 × 12, 8 × 8, 10 × 12 and 12 × 12 m) for pressures of 30 and 40 mH2O (pressures evaluated in three studies), the sprinkler Super 10 remained the best performance, for it showed 58.3% of all UC and UD data classified as “Ex-cellent” as proposed by Mantovani [12], while the sprinkler 427 showed 32% and the sprinkler 435, 18%. Only the sprinkler Super 10 showed high uniformity of distribution calculated at wider spacing (12 × 12 m). As water scarcity in agriculture becomes a major problem especially because of the demand from non-agricultural uses and intensive management of existing farmland to suit the needs of the population, the efficient use of available irri-gation water is therefore an important concern [25].
Compared to typical behavior found in the literature for the geometric shape of the curve formed by the radial profile (triangular, rectangular and elliptical) cited by Prado et al.[26], it was not observed for the sprinkler Super 10 in Figures 4-6, any of three behaviors, but the combination of all. Similar behavior was observed by Stambou-li et al. [27] using the sprinkler RC130-BY manufactured by Riegos Costa. Montero et al. [28] reported that sprinklers which have a more uniform water distribution profile suffer less influence of the wind (one of the agents which influence the uniformity of distribution of water) compared with sprinklers which have water radial distribution profile with geometry tending triangular, as the sprinklers 427 [1] and the sprinkler 435 [14]. Ac-cording to Stambouli et al. [27] the information observed in catalogs of manufacturers are very limited and insuf-ficient for purposes of sprinkler designs, and it is fundamental for the development of a good design that the standard radial distribution depending on the characteristics of operating equipment are part of the technical in-formation provided by the manufacturer in their catalog.
Regarding the wetting radius, in Table 9, the average values of the radius of wetting of Super 10 are presented. It can be seen, for green nozzle, when pressures are over 35 mH2O, increasing radius of wetting due to the increase of the operating pressure. For the blue and yellow nozzles, it was noted that the radius remained constant regard-less of operating pressure. In general, the higher flow nozzle (green) showed greater radius of wetting compared to other nozzles used (Rgreen > Ryellow > Rblue).
4. Conclusions
The mechanism of fractionating the jet of the sprinkler Super 10 proved to be very interesting and superior to the traditional deflector arm since such equipment showed high uniformity of water distribution, even in large gaps, and low amplitude of droplet diameters in most simulated situations. The radius of wetting was slightly influ-enced by the increase of the operating pressure of the device while maintaining good uniformity and low ampli-tude of intensity of precipitation between the points of the radial profile.
For high uniformity of distribution of water in the larger wetting radii, it is recommended to work with Super 10 sprinkler using the green nozzle, with a pressure of 40 H2O and spacing between sprinklers and lateral lines 12 × 12 m.
It is important to characterize the hydraulic irrigation equipment such as sustainable management tool for soil, water and agricultural activities, because when soil happens to be used for food production under irrigation means, when poorly planned, it may lead to imbalances in the soil-water-plant relationships and significant losses.
References
[1] Martins, P.E.S., Zanini, J.R., da Silva, E.R. and Lemos Filho, M.A.F. (2012) Perfil radial e uniformidade de preci- pitação do aspersor NaanDanJain 427, em função da regulagem do defletor. Revista Brasileira de Engenharia Agrícola,
[2] Khatri, K.L., Memon, A.A., Shaik, Y., Pathan, A.F.H., Shah, S.A., Pinjani, K.K., Soomro, R., Smith, R. and Almani, Z. (2013) Real-Time Modeling and Optimization for Water and Energy Efficient Surface Irrigation. Journal of Water Resource and Protection, 5, 681-688. http://dx.doi.org/10.4236/jwarp.2013.57068
[3] Martins, P.E.S., da Silva, E.R., Lima Santos, N., Lemos Filho, M.A.F. and Galzerano, L. (2010) Práticas de manejo de irrigação como medida de conservação do solo e da água. Enciclopédia Biosfera, 10, 19p.
[4] Martins, P.E.S. (2011) Perfil radial e uniformidade de precipitação do aspersor NaanDanJain 427, em função do
defletor de ajuste. M.Sc Dissertation, São Paulo State University, Jaboticabal.
[5] Martins, P.E.S., da Silva, E.R. and Zanini, J.R. (2012) Irrigação e suas interações com os atributos físicos do solo. In: Fernandes, C., Ed., Tópicos em física do solo,Funep, Jaboticabal, 88-106.
[6] Solomon, K. (1979) Manufacturing Variation of Trickle Emitters. Transactions of the ASAE, 22, 1034-1038. http://dx.doi.org/10.13031/2013.35150
[7] Christiansen, J.E. (1942) Irrigation Sprinkling. California Agricultural Experiment Station, 124p. (Bulletin, 670)
[8] Criddle, W.D., Davis, S., Pair, C.H. and Shockley, D.G. (1956) Methods for Evaluating Irrigation Systems, 24p. (Agricultural handbook, 82)
[9] Associação Brasileira de Normas Técnicas (1999) Equipamentos de irrigação agrícola: Aspersor rotativo. Parte 2: Uniformidade de distribuição e método de ensaio. Project 04:015.08-013. 8p.
[10] Associação Brasileira de Normas Técnicas (1999) Equipamentos de irrigação agrícola: Aspersor rotativo. Parte 1: Requisitos para projetos e operação. Project 04:015.08-012. 14p.
[11] Allen, R.G. (1992) Cath-3D Sprinkler Pattern Analysis Software. Logan, 14p.
[12] Mantovani, E.C. (2001) Avalia: Programa de avaliação da irrigação por aspersão e localizada. UFV, Viçosa, MG.
[13] Keller, J. and Karmeli, D. (1974) Trickle Irrigation Design Parameters. Transactions of American Society of Agricul-tural Engineers, 17, 678-684. http://dx.doi.org/10.13031/2013.36936
[14] Guirra, A.P.P.M., Zanini, J.R. and da Silva, E.R. (2013) Desempenho do aspersor Naan Dan Jain 435 em função da po- sição do defletor. Científica, 1, 21-32.
[15] Keller, J. and Karmeli, D. (1975) Trickle Irrigation Design Parameters. Rain Bird Sprinkler Manufacturing Corporation, Glendora, 133p.
[16] Faria, L.C., Colombo, A., Oliveira, H.F.E. and Prado, G. (2009) Simulação da uniformidade da irrigação de sistemas convencionais de aspersão operando sob diferentes condições de vento. Engenharia Agrícola, 29, 19-27.
http://dx.doi.org/10.1590/S0100-69162009000100003
[17] Ribeiro, D.R., de Deus, F.P., Barbosa, E.A., Feitosa, D.R.C., Tuta, N.F., Gonçalves, I.Z. and Matsura, E.E. (2012) Uni- formidade da umidade do solo para diferentes espaçamentos em um sistema de irrigação por aspersão convencional. Ir-riga, Special Edition, 220-233.
[18] Rocha, E.M.M., Costa, R.N.T., Mapurunga, S.M.S. and Castro, P.T. (1999) Uniformidade de distribuição de água por aspersão convencional na superfície e no perfil do solo. Revista Brasileira de Engenharia Agrícola e Ambiental, 2, 154-160.
[19] Rezende, R., Frizzone, J.A., Gonçalves, A.C.A. and Freitas, P.S.L. (1998) Influência do espaçamento entre aspersores na uniformidade de distribuição de água acima e abaixo da superfície do solo. Revista Brasileira de Engenharia Agrí- cola e Ambiental, 3, 257-261.
[20] Yacoubi, S., Zayani, K., Slatni, A. and Playán, E. (2012) Assessing Sprinkler Irrigation Performance Using Field Eva- luations at the Medjerda Lower Valley of Tunisia. Engineering, 4, 682-691.
http://dx.doi.org/10.4236/eng.2012.410087
[21] El-Berry, A.M., Ramadan, M.H., El-Adly, A.M. and Mahmoud, M.H. (2009) Effect of Nozzle Shape and Pressure on
Droplet Size Distribution. Misr Journal of Agricultural Engineering, 26, 208-223.
[22] Pereira, P.H.C., Colombo, A. and Rabelo, G.F. (2013) O uso da engenharia de automação na redução do consume de energia elétrica em um sistema de irrigação por pivô central. Procedings Simpósio Brasileiro de Automação Inteligente, Fortaleza, 6p.
[23] Sanchez, I., Faci, J.M. and Zapata, N. (2011) The Effects of Pressure, Nozzle Diameter and Meteorological Conditions on the Performance of Agricultural Impact Sprinklers. Agricultural Water Management, 102, 13-24.
http://dx.doi.org/10.1016/j.agwat.2011.10.002
[24] Li, J., Kawano, H. and Yu, K. (1994) Droplet Size Distributions from Different Shaped Sprinkler Nozzles. Transac-tions of the ASAE, 37, 1871-1878. http://dx.doi.org/10.13031/2013.28278
[26] Prado, G., Colombo, A., de Oliveira, H.FE. and Faria, L.C. (2012) Uniformidade de aplicação de água de equipamen- tos autopropelidos de irrigação com aspersores de perfil radial triangular, elíptico e retangular. Engenharia Agrícola,
32, 522-529. http://dx.doi.org/10.1590/S0100-69162012000300011
[27] Stambouli, T., Zapata, N. and Faci, J.M. (2014) Performance of New Agricultural Impact Sprinkler Fitted with Plastic Nozzles. Biosystems Engineering, 118, 39-51. http://dx.doi.org/10.1016/j.biosystemseng.2013.11.002