Munich Personal RePEc Archive
The Effect of Classroom Games on
Student Learning and Instructor
Evaluations
Cebula, Richard and Toma, Michael
Jacksonville University, Armsttong Atlantic State University
1 December 2000
Online at
https://mpra.ub.uni-muenchen.de/55404/
The Effect of Classroom Games on Student Learning and Instructor Evaluations
Richard Cebula Professor of Economics
Shirley and Philip Solomons Eminent Scholar Department of Economics
Armstrong Atlantic State University Savannah, GA 31419
Michael Toma*
Assistant Professor of Economics Department of Economics Armstrong Atlantic State University
Savannah, GA 31419 [email protected]
921-921-5527
Abstract.
Assuming that instructors of economics are utility maximizers, they may find it useful to engage in classroom behavior that is likely to generate favorable outcomes with respect to student course evaluations. This is especially true if student course evaluations are used in assessing teaching effectiveness for tenure, promotion, and salary decisions. In this paper, we present evidence that the use of a classroom gaming exercise can raise instructor evaluations and enhance student learning outcomes. The tests are conducted in a framework that indirectly controls for grade inflation and considers student attendance and grade expectations as other sources of influence on instructor evaluation ratings.
Key Words:
classroom simulations teaching effectiveness student course evaluations student evaluations of teaching
JEL Codes: A20, A22
The Effect of Classroom Games on Student Learning and Instructor Evaluations
I. Introduction
Recent work regarding instructor evaluation ratings has re-opened the debate on whether
the statistical correlation of grades and instructor evaluations can be explained by instructor
manipulation of evaluations through the adoption of lenient grading policies [Greenwald and
Gillmore, 1997; Wilson, 1998]. Although earlier research found that instructors could ‘buy’
higher evaluations with easier grading polices, more recent evidence suggests that this influence
may be trivial [Greenwald, 1997]. However, Greenwald and Gillmore (1997) argue that the
higher course grades and ratings relationship is most consistent with the theory of lenient grading
policies. This prompts Wilson (1998, A12) to comment that “professors who want high ratings
have learned that they must dumb down material, inflate grades, and keep students entertained.”
In this study, we provide evidence that instructor evaluation ratings are improved when a
supplemental gaming exercise is introduced into an upper level economics course that neither
dumbs down the material nor inflates grades but rather does keep students more entertained.
II. Brief Literature Review
Given the widespread use of instructor evaluations as a tool for assessing teaching
effectiveness for tenure, promotion, and salary decisions [White, 1995; Becker and Watts, 1999],
a utility maximizing instructor will engage in behavior that raises evaluation scores. Indeed, a
large literature on the subject has developed that explores instructor response to the use of
evaluations [for example, see Becker (1975), McKenzie (1975), and Kibbs (1975)]. The
controversial aspect of this literature is that some empirical evidence suggests that instructors
Nelson and Lynch, 1984; Zangenehzadeh, 1988]. A potential problem of the tests is noted by
Seiver (1983) and Stratton, Myers and King (1994), who point out that these tests cannot
differentiate between rising evaluation scores induced by better teaching (and thus, higher
grades) on the one hand and or reduced grading standards on the other hand.
Although the use of classroom games in teaching economics was pioneered over fifty
years ago by Chamberlin (1948), their use in the modern classroom has only recently grown in
frequency [See Holt (1999) and Holt’s website index of 91 related manuscripts].1 Fels (1993)
observes that this may be a result of high start-up costs and the lack of evidence suggesting that
student comprehension of course material is enhanced by using games to illustrate theory. Holt’s
web-site collection of classroom experiments and games addresses the former issue, our work
addresses the latter issue and also considers the effect of using classroom games on student
ratings of instructors.
Given the reported relationship between students’ expected grades and evaluation scores,
techniques that increase teaching efficiency, as reflected in student comprehension of material,
should also result in higher evaluation scores for the instructor [Stratton, et. al., 1984]. The
empirical evidence on this is limited. Shmanske (1988) finds a weak positive relationship
between instructor evaluation scores and student performance, whereas Aigner and Thum (1986)
report that facets of teaching style significantly influence evaluation scores but are unable to
directly measure teaching effectiveness.
A brief overview of the classroom method is provided in Section III. In Section IV, the
data set is described. Two elementary statistical tests regarding the effect of the portfolio project
on student performance and instructor ratings are reviewed in this section as well. In Section V,
associated with higher instructor evaluation ratings. A sampling of open-ended student
comments drawn from the evaluation forms is presented in Section VI. The comments
qualitatively highlight the difference in student response to the version of the course with or
without the portfolio project. Section VII is the conclusion.
III. Classroom Method
Bringing course material to life (entertainment value?) for the student can be
accomplished easily in a financial economics course by incorporating an investment portfolio
project into course material. The setup is a straightforward version of the Stock Market Game
discussed by Wood, O’Hare, and Andrews (1992) and Bell (1993). In the present study, the
technique is applied in an upper level economics course, Money and Banking.
Students are required to manage a portfolio of assets and submit monthly updates of
portfolio performance, along with an explanation for their investment decisions. The explanation
is the most important component of the update, for this is where students are required to apply
course material to decision making in financial markets. Grades are not affected by portfolio
performance, but by the quality of the rationale behind the investment decisions. As an added
incentive, students compete against each other for recognition as the outstanding investment
analyst in the class.
IV. Data and Tests of Difference in Means
The data set is drawn from eight Money and Banking courses instructed by one of the
authors at two universities populated by similar students. Both universities are state supported
commuter campuses set in a suburban location providing residence halls for only a small fraction
each are from 1995, 1996, and 1998. Total enrollment in the eight sections was 246, from which
172 student evaluation forms were available. The portfolio project sample (189 students, 121
forms available) consists of both 1995 and 1996 sections as well as one section each from 1998
and 2001. The non-portfolio project sample (57 students, 52 forms available) consists of one
section each from 1993 and 1998.
In the remaining portion of this section, we present the results of two elementary tests
designed to evaluate whether the supplemental game resulted in enhanced student learning and
increased ratings of the course and instructor. The first test focuses on student comprehension as
measured by the percentage of total points possible that each student earned. The only difference
in the way students earned grade credit across the samples is that students in the portfolio
sections also earned points associated with the project while students in the non-portfolio
sections only earned points by taking periodic examinations.2
The grades from each student population (all portfolio and non-portfolio sections) are
assumed to have a normal distribution with the same but unknown variance. The statistical test of
difference in means across the two samples is conducted using Student’s t-statistic. The data and
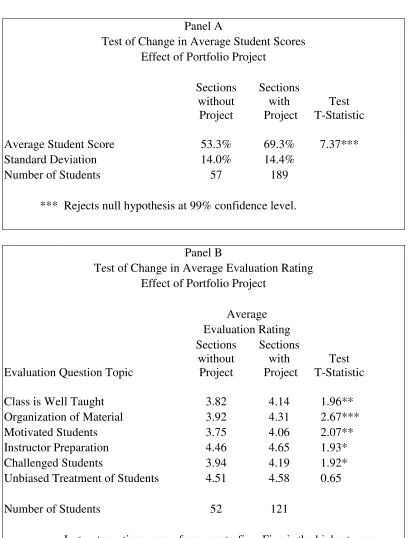
test result are found in Panel A of Table 1.
The average score in the two samples significantly different. In sections with the
portfolio project, the average score was 66.8 percent, while in the sections without the
supplemental exercise the average was 53.3 percent.3 The t-statistic is 6.77, indicating that the
difference is significant with 99 percent confidence. This result suggests that student learning
outcomes were significantly enhanced by including a supplemental exercise in the course and is
consistent with the findings of Fels (1984) and Mehdizadeh (1990).
the investment project is included in the course. Prior to commenting on these tests, however, a
caveat should be noted. Given the data set, a potential problem is that the evaluation scores could
be expected to rise through time as instructor experience increases. Although we are unable to
directly control for this phenomenon in these tests (but do in the regression model), the
combination of 1998 data with 1993 data in the non-portfolio sample partially mitigates this
problem. In addition, the evaluation question topics may shed some light on this issue. It seems
reasonable that greater experience would most likely be reflected in the categories for “instructor
preparation” and “course organization” and, to a lesser extent, in the “well taught” ratings.
We hypothesize that the evaluation components most clearly reflecting active student
learning would be those regarding student “Motivation” and whether the course was
“Challenging.” Increased ratings on whether the instructor motivated students could arise from
the relevance of the material with respect to financial markets. The aspect of whether the course
was challenging would arise as students recognize the difficulty in application of theory to
financial market activity. It also seems reasonable to expect an increase in “Well Taught” ratings
as student interest and appreciation of the material is heightened through completion of the
portfolio project. Whether an instructor is “Unbiased” would least likely be effected by
increased instructor experience or the addition of the portfolio project.
In Table 1, average instructor evaluation ratings for six different topic areas are
presented. The scores range from one to five, with a rating of five reflecting the highest level of
student satisfaction with the instructor.4 The results from the difference in means test for the
ratings across the portfolio and non-portfolio samples are found in Panel B of Table 1.
The statistical results are consistent with expectations. The portfolio project was
the “motivation” and “challenging” ratings since students had the opportunity to apply what they
learned in the classroom to decision-making in actual financial markets. The t-statistics for these
categories indicate a significant increase in the average rating at the 95 percent confidence level
or better. It was also hypothesized that an increase in the “well taught” rating could result from
the addition of the active student learning exercise (the investment project). The t-statistic for
this question topic indicates (with 97.5 percent confidence) an increase in average rating score in
sections that included the portfolio project.
The question topics that would most likely reflect increased experience are “preparation”
and “organization,” although “organization” could also be influenced by student appreciation of
the way the portfolio project is integrated into the course. These instructor ratings show a
statistically significant increase at the 95 percent and 99 percent confidence level, respectively,
when the portfolio project is part of the course. Zangenehzadeh (1988) finds that that instructor
preparation and organization significantly influence student assessment of course quality. Thus,
the rating changes in these two categories could be influenced by the dual influence of increasing
experience and the introduction of the portfolio project.
Also confirming prior expectations are the evaluation ratings for “unbiased” which show
no significant increase. It seems unlikely that a hands-on investment project would increase
students’ perception of whether or not the students felt they or their work was impartially graded.
V. Regression Results
In this section we present regression results from a sub-sample of the data set for which
additional student demographic information and grade expectations information are available.
The data are available from 151 evaluation forms from six sections of the course (one from 1993,
In the model, the instructor rating is regressed on a set of binary variables characterizing
the effects of grade expectations, number of absences, and whether the portfolio project was
included in the course. In particular, the specification is as follows:
RATING = ∃0 + ∃1(BE) + ∃2(CEDE) + ∃3(AB4+) + ∃4(PORT) + ,.∏ (1)
RATING is the student rating of the instructor for whether the course was taught well,
presented in an organized manner, motivating, challenging; and whether to instructor appeared to
be prepared for class, and was unbiased toward students.5
The student demographic variables considered first are student expectations about their
grade in the course and self-reported student absences. Course evaluations were distributed
during the last two weeks of the course before the final exam and before the portfolio project
term paper was submitted. Student grade expectations are modeled as dummy variables where,
for example, if a student expected an ‘B’ grade, BE = 1; BE = 0 otherwise. Since only two
students in the sample were expecting a ‘D’ grade, these students are modeled jointly with
students expecting a ‘C’ grade by the variable CEDE. AB4+ is a dummy variable that equals
one when a student self-reported four or more class absences, and equals zero otherwise.
The constant in the regression, ∃0, jointly characterizes students who reported three or
less absences with students who expected to receive an ‘A’ grade in the course. This
specification for the constant is chosen in light of the collinearity between high grade
expectations and few absences, and Durden and Ellis’ (1995) result that relatively low levels of
class absence do not significantly affect student learning.
PORT is a dummy variable equaling one if the student was in a section of the course that
interactive effect between PORT and students grouped by grade expectations. One group of
students considered is those who expected ‘A’ and ‘B’ grades. This group is designated by the
variable AEBE, which equals AE + BE. The second group is students who expected ‘C’ and ‘D’
grades (CEDE) and is calculated as CE + DE. The interactive variables are defined as PABE,
which equals (PORT x AEBE), and PCDE, which equals (PORT x CEDE). These interactive
variables allow for the identification of different effects of the portfolio on ratings by grade
expectations depending on whether the student believed he or she was in the top or bottom half
of the grade distribution.6
Since the constant of the regression characterizes students who regularly attended
classroom lectures and expected an ‘A’ grade, the partial derivatives of RATING with respect to
BE and CEDE are expected to be negative. Students expecting lower grades have been shown to
penalize their instructors with lower ratings [Stumpf and Freedman, 1979]. In addition,
attribution theory [Greenwald, 1980; Gigliotti and Buchtel, 1990; and Theall, Franklin, and
Ludlow, 1990] suggests that while students reward themselves with the credit for performing
well in a course, they blame the instructor when their performance is sub-par.
If it is reasonably assumed that students who do not attend class regularly tend to perform
poorly [Park and Kerr, 1990; Romer, 1993; and Durden and Ellis, 1995], then the partial of
RATING with respect to AB4+ is expected to be negative. The lack of attendance results in
sub-par performance, is attributed to the instructor, and reflected in lower ratings.
The use of supplemental exercises has been found to increase instructor evaluations
ratings [Fels, 1984; Mehdizadeh, 1990], and perhaps explains the growing interest in, and
compilation of, resources about classroom games (Holt, 1999 and Holt’s website cited in endnote
related to RATING, although the effect may vary by grade expectation.
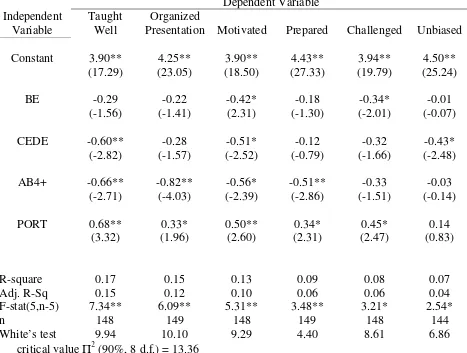
The ordinary least squares results for Equation 1 are reported in Table 3. The results for
each rating are reported in the columns of the table. The entries are the estimated coefficients
with the t-statistics reported in parentheses below the coefficient. White’s (1980) test for
heterscedasticity in the residuals indicates that the null of homoscedastic errors can not be
rejected. White’s test statistic is reported for each model and is everywhere less than the critical
Π2 value with 90 percent confidence and five degrees of freedom (13.36).
The presence of the portfolio project in the course is associated with significantly higher
evaluation ratings across nearly all evaluation categories. With respect to the ‘taught well’ and
‘motivates’ ratings, PORT generates an increase in the ‘taught well’ rating by two-thirds of a
point (17 percent increase) while the ‘motivates’ rating increased by one-half of a point (13%
increase). In addition, the ‘challenges’ rating increased by 11 percent when the portfolio project
was included in the course. There was no significant effect on whether students perceived that
their work was evaluated in an unbiased manner. These results, based on data from six sections
of the course, are generally consistent with the t-test results reported for the full sample (eight
sections) in the previous section.
Students’ expectations for a high grade also significantly influenced whether students
rated the instructor highly. Recall that the constant in the regression characterizes the rating
assigned by students who expected an ‘A’ in the course and who missed three or less classes.
These “better” students, who serve as the baseline of comparison in the model, rated the
instructor at approximately 3.9 to 4.5 across the categories. Although the variables
characterizing lower grade expectations (BE and CEDE) are not significant across all
significant at the 99 percent confidence level in the regression for the most general assessment of
the course, whether it was taught well. Students expecting ‘C’ or ‘D’ grades offered an overall
assessment that was 17 percent lower (six-tenths of a point) than their classroom peers expecting
better grades.
In addition, the results of this analysis suggest that relatively high levels of student
absence were associated with a significant reduction in instructor rating. As reported in Table 3,
the coefficient for AB4+ indicates that the average rating for ‘taught well,’ ‘organized,’
‘motivated,’ and ‘prepared’ was significantly reduced by between 12 and 19 percent. To the
extent that greater absence is associated with lower levels of student performance, the result is
consistent with attribution theory discussed above. These students may have attributed their
attendance-related poor performance to a ‘poor’ instructor and reduced their rating accordingly.
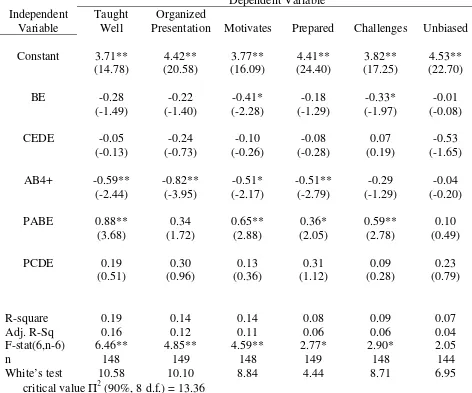
The results of a supplemental regression exercise are reported in Table 4. In these
models, the effect of the portfolio project is allowed to vary by the students’ grade expectations
rather than being constrained to have an equal effect across all students regardless of their grade
expectations. The results are generally consistent with the constrained model, although the
portfolio project loses its effectiveness in raising instructor ratings among students who expected
to receive a grade in the lower half of the grade distribution.
The portfolio’s effect on instructor rating is amplified among students expecting better
grades. On average, the overall assessment of the course (taught well) rises by 24 percent among
students expecting an ‘A’ grade in sections with the portfolio project as compared to 17 percent
among all students expecting a top grade. An f-test restricting the estimated coefficients of
PABE and PCDE in this specification for ‘well taught’ rejects the null of equal effects at the 89
suggestive that the effect of the portfolio may vary by whether students expect a grade in the
upper or lower half of the grade distribution.
VI. Qualitative Evidence: Testimonials
In addition to coding a rating for the categories on the instructor evaluation form,
students from all sections had the opportunity to provide open-ended written comments about the
course. Additional evidence supporting the statistical results is a qualitative assessment of
“Without Portfolio” and “With Portfolio” quotes obtained from the students’ instructor
evaluation sheets.
Typical Quotes: Without Portfolio
“Course was strictly lecture. Not sure what other materials are available, but may want to consider using them.”
“I found [that] this course is very important for economic knowledge, but felt lost in the process.”
These and other quotes indicate that students were less interested in the material and may have
been overwhelmed by the course. The difference in tone and content is clear when these
comments are contrasted with those made by students in the sections which completed the
investment project.
Typical Quotes: With Portfolio
“The mock portfolio was a great idea. It was a good way to get students interested in the class and demonstrated the theories we learned.”
“I enjoyed doing the portfolio project because I was able to apply what we were learning in this class to actual life.”
“I think that the stock market game is a great idea to make the class more interesting. There is no way of getting around the fact that some of the information learned in this class is boring [?!] but the game makes it all worth it.”
“This is the most useful block of college instructing I have ever received. If I had access to this information thirty years ago as a college undergraduate, I would not now be starting a second career after retirement from the military.”
VII. Conclusion
The results obtained in this study shed light on the issue of whether the use of classroom
games has an impact on student learning. This provides some important evidence with respect to
Fels’ (1993, 365) concern that the cost of classroom game implementation could exceed the
“meager evidence of [their] educational value.” A test is conducted in which, ceteris paribus,
student scores were observed to increase in the sample that included a financial market portfolio
project. Holding lecture style and grading policy fixed across the two samples and examining
instructor ratings sheds light on the issue of whether student learning, enhanced by the portfolio
project, influences evaluation scores.
The results in the present analysis suggest that students comprehended more of the
material, and assigned higher scores to their evaluation of the instructor. Furthermore, the
analysis controlled for student grade expectations, thus permitting the identification of the effect
of a supplemental gaming exercise on instructor ratings. This method avoids the issue raised by
Seiver (1983), Aigner and Thum (1986) and Zangenehzadeh (1988) who demonstrate that
students with higher grade expectations rate instructors more favorably. Finally, these results
were obtained using a test method that indirectly controlled for the effect of grade inflation and
grading policy. Thus, the higher evaluation scores do not simply reflect a “selling out” to
students in an effort to raise evaluation ratings.
It is worthwhile to note that very little other course material was altered or “crowded out”
as a result of including the investment project. While the course material was little changed,
the portfolio project. In addition, instructor evaluation ratings significantly increased in the
presence of the supplemental exercise. Thus, we provide evidence that classroom gaming
exercises may increase student performance and raise instructor evaluation ratings. These
findings are tentatively attributed to the fact that it became readily apparent to the students how
Table 1
Panel A
Test of Change in Average Student Scores Effect of Portfolio Project
Sections without Project
Sections with Project
Test T-Statistic
Average Student Score 53.3% 69.3% 7.37*** Standard Deviation 14.0% 14.4%
Number of Students 57 189
*** Rejects null hypothesis at 99% confidence level.
Panel B
Test of Change in Average Evaluation Rating Effect of Portfolio Project
Average Evaluation Rating
Evaluation Question Topic
Sections without
Project
Sections with Project
Test T-Statistic
Class is Well Taught 3.82 4.14 1.96** Organization of Material 3.92 4.31 2.67*** Motivated Students 3.75 4.06 2.07** Instructor Preparation 4.46 4.65 1.93* Challenged Students 3.94 4.19 1.92* Unbiased Treatment of Students 4.51 4.58 0.65
Number of Students 52 121
Instructor ratings range from one to five. Five is the highest score. *** Rejects null hypothesis at 99% confidence level.
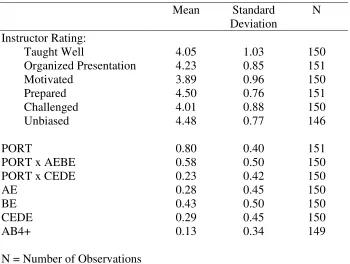
Table 2
Summary Statistics for Regression Sample
Mean Standard Deviation
N
Instructor Rating:
Taught Well 4.05 1.03 150 Organized Presentation 4.23 0.85 151 Motivated 3.89 0.96 150
Prepared 4.50 0.76 151
Challenged 4.01 0.88 150
Unbiased 4.48 0.77 146
PORT 0.80 0.40 151
PORT x AEBE 0.58 0.50 150
PORT x CEDE 0.23 0.42 150
AE 0.28 0.45 150
BE 0.43 0.50 150
CEDE 0.29 0.45 150
AB4+ 0.13 0.34 149
Table 3
Influences on Instructor Ratings I
Dependent Variable Independent Variable Taught Well Organized
Presentation Motivated Prepared Challenged Unbiased
Constant 3.90** (17.29) 4.25** (23.05) 3.90** (18.50) 4.43** (27.33) 3.94** (19.79) 4.50** (25.24)
BE -0.29 (-1.56) -0.22 (-1.41) -0.42* (2.31) -0.18 (-1.30) -0.34* (-2.01) -0.01 (-0.07)
CEDE -0.60** (-2.82) -0.28 (-1.57) -0.51* (-2.52) -0.12 (-0.79) -0.32 (-1.66) -0.43* (-2.48)
AB4+ -0.66** (-2.71) -0.82** (-4.03) -0.56* (-2.39) -0.51** (-2.86) -0.33 (-1.51) -0.03 (-0.14)
PORT 0.68** (3.32) 0.33* (1.96) 0.50** (2.60) 0.34* (2.31) 0.45* (2.47) 0.14 (0.83)
R-square 0.17 0.15 0.13 0.09 0.08 0.07 Adj. R-Sq 0.15 0.12 0.10 0.06 0.06 0.04 F-stat(5,n-5) 7.34** 6.09** 5.31** 3.48** 3.21* 2.54* n White’s test 148 9.94 149 10.10 148 9.29 149 4.40 148 8.61 144 6.86 critical value Π2 (90%, 8 d.f.) = 13.36
Table 4
Influences on Instructor Ratings II
Dependent Variable Independent Variable Taught Well Organized
Presentation Motivates Prepared Challenges Unbiased
Constant 3.71** (14.78) 4.42** (20.58) 3.77** (16.09) 4.41** (24.40) 3.82** (17.25) 4.53** (22.70)
BE -0.28 (-1.49) -0.22 (-1.40) -0.41* (-2.28) -0.18 (-1.29) -0.33* (-1.97) -0.01 (-0.08)
CEDE -0.05 (-0.13) -0.24 (-0.73) -0.10 (-0.26) -0.08 (-0.28) 0.07 (0.19) -0.53 (-1.65)
AB4+ -0.59** (-2.44) -0.82** (-3.95) -0.51* (-2.17) -0.51** (-2.79) -0.29 (-1.29) -0.04 (-0.20)
PABE 0.88** (3.68) 0.34 (1.72) 0.65** (2.88) 0.36* (2.05) 0.59** (2.78) 0.10 (0.49)
PCDE 0.19 (0.51) 0.30 (0.96) 0.13 (0.36) 0.31 (1.12) 0.09 (0.28) 0.23 (0.79)
R-square 0.19 0.14 0.14 0.08 0.09 0.07 Adj. R-Sq 0.16 0.12 0.11 0.06 0.06 0.04 F-stat(6,n-6) 6.46** 4.85** 4.59** 2.77* 2.90* 2.05
n 148 149 148 149 148 144
White’s test 10.58 10.10 8.84 4.44 8.71 6.95 critical value Π2 (90%, 8 d.f.) = 13.36
References
Aigner, D., and F. Thum. 1986. On student evaluation of teaching ability. Journal of Economic Education 17(4): 243-265.
Becker, W. 1975. The university professor as a utility maximizer and producer of learning, research and income. Journal of Human Resources 10(1): 107-15.
Becker, W., and M. Watts. 1999. How departments of economics evaluate teaching. American Economic Review Papers and Proceedings 89(2): 344-49.
Bell, C. 1993. A noncomputerized version of the William and Walker stock market experiment in a finance course. Journal of Economic Education 24(4): 317-323.
Chamberlin, E. 1948. An experimental imperfect market. Journal of Political Economy 56(2): 95-108.
Durden, G., and L. Ellis. 1995. The effects of attendance on student learning in principles of economics. American Economic Review Papers and Proceedings 85: 343 –46.
Fels, R. 1984. Student papers on macroeconomic policy. Journal of Economic Education 15(3): 237-38.
______. 1993. This is what I do and I like it. Journal of Economic Education 24(4): 365-70.
Gigliotti, R., and F. Buchtel. 1990. Attribution bias and course evaluations. Journal of Educational Psychology 82: 341-351.
Greenwald, A. 1980. The totalitarian ego: Fabrication and revision of personal history. American Psychologist 35: 603-618.
______. 1997. Validity concerns and usefulness of student ratings of instruction. American Psychologist 52: 1182-1186.
______, and G. Gillmore. 1997. Grading leniency is a removable contaminant of student ratings. American Psychologist 52: 1209-1217.
Holt, C. 1999. Teaching economics with classroom experiments. Southern Economic Journal 65(3): 603-10.
Kibbs, P. 1975. The use of course evaluation scores to influence teaching and research activities. Journal of Economic Education 6(2): 93-98.
Mehdizadeh, M. 1990. Loglinear models and student course evaluations. Journal of Economic Education 21(1): 7-21.
Mirus, R. 1973. Some implications of student evaluation of teachers. Journal of Economic Education 5(1): 35-46.
Nelson, J., and K. Lynch. 1984. Grade inflation, real income, simultaneity, and teaching evaluations. Journal of Economic Education 15(1): 21-37.
Park, K., and P. Kerr. 1990, Determinants of academic performance: A multinomial logit approach. Journal of Economic Education 21(Spring): 101-11.
Romer, D. 1993. Do students go to class? Should They? Journal of Economic Perspectives 7: 167-74
Seiver, D. 1983. Evaluation and grades: A simultaneous framework. Journal of Economic Education 14(3): 32-38.
Shmanske, S. 1988. On the measurement of teacher effectiveness. Journal of Economic Education 19(4): 307- 314.
Stratton, R., S. Myers, and R. King. 1994. Faculty behavior, grades and student evaluations. Journal of Economic Education 25(1): 5-15.
Stumpf, S., and R. Freedman. 1979. Expected grade covariation with student ratings of
instruction: Individual and class effects. Journal of Educational Psychology 71: 293-302.
Theall, M., J. Franklin, and L. Ludlow. 1990. Attributions and retributions: Student ratings and perceived causes of performance. Instructional Evaluation 11: 12-17.
White, H. 1980. A Heteroscedasticity-consistent covariance matrix and a direct test for heteroscedasticity. Econometrica 50: 1-26.
White, L. 1995. Efforts by departments of economics to assess teaching effectiveness: Results of an informal survey. Journal of Economic Education 26(1): 81-85.
Wilson, R. 1998. New research casts doubt on value of student evaluations of professors. Chronicle of Higher Education 44(19), 16 January: A12.
Wood, W., S. O’Hare, and R. Andrews. 1992. The stock market game: Classroom use and strategy. Journal of Economic Education 23(3): 234-46.
End Notes
1
A list of 91 papers on classroom games in the teaching of economics is found at http://www.people.virginia.edu/~cah2k/classy2k.htm. More detailed information about conducting numerous games is located in the links found at http://www.people.Virginia.EDU/~cah2k/teaching.html.
Sites visited on April 8, 2002.
2
The examinations consisted of a multiple choice, short answer, and essay questions. The examinations were not standardized across the different sections, but question topics were similar in depth, breadth, and difficulty.
3
For the assignment of term grades, student scores were adjusted (‘curved’) to generate a class average of 75% and a distribution of grades consistent with a traditional 90, 80, 70, etc. percentage point grading scale. However, the samples of student scores that were examined for difference in means were not curved for an obvious reason.
4
The student evaluation forms from both universities included comparable information regarding whether the course was well taught, organized, motivating, challenging, and whether the instructor was prepared and unbiased. Although one university’s forms rated instructor characteristics on a four point scale (strongly agree, agree, disagree, strongly disagree) while the second university’s forms included a fifth ‘undecided’ category between agree and disagree, this would tend to work against our results. First, the problem is partially mitigated by having one section each from the university using the 4 point scale forms in the portfolio and non-portfolio samples. Second, given that a majority of the ratings from the 5 point scale form were’ agree’ or better, it can be inferred that the lack of a middle ‘undecided’ category would tend to bias the ratings from the four point scale forms in the upward (better) direction toward the ‘agree’ response. Given the smaller size of the non-portfolio sample, the upward bias in the sample average ratings would be larger relative to effect of the bias in the larger portfolio sample. Finally, given the structure of the test, the upward bias in the non-portfolio sample would tend to decrease the likelihood of observing a statistically significant difference between the average instructor rating across the two samples.
5 The error term in the regression, ,, is assumed to adhere to the standard assumptions of the classical linear regression model. It is a white noise error term.
6