Munich Personal RePEc Archive
Investment and Savings Cycles and Tests
for Capital Market Integration
Cooray, Arusha and Felmingham, Bruce
University of Tasmania
2005
Online at
https://mpra.ub.uni-muenchen.de/23629/
SCHOOL OF ECONOMICS
Discussion Paper 2005-01
Investment and Savings Cycles and Tests
for Capital Market Integration
Arusha Cooray
and
Bruce Felmingham
(University of Tasmania)
Investment and Savings Cycles and Tests
for Capital Market Integration
Arusha Cooray*
Bruce Felmingham
School of Economics Private Bag 85 University of Tasmania
Hobart Tasmania 7001 Australia
Phone: 61-3-6226-2820 Fax: 61-3- 6226-7587
Email: arusha.cooray@utas.edu.au
School of Economics Private Bag 85 University of Tasmania Hobart Tasmania 7001
Australia
Phone: 61-3-6226-2312 Fax: 61-3-6226-7587
Email: bruce.felmingham@utas.edu.au
Abstract:
A spectral analysis of the Australian time series for the investment and savings ratio on monthly data over the period finds that the investment ratio is subject to a cycle of 6 months duration while the savings ratio series is concentrated on a longer swing of 4 to 6 years. The implications for the Feldstein-Horioka test of capital mobility are explained.
* Corresponding author
3
1 Introduction
The original Felstein-Horioka (1980) condition was based on a linear relationship between
the investment (I/Y) and saving ratios (S/Y). If there is no evidence of any relationship
between these then it is argued that capital is perfectly mobile because all domestic
investment can be financed through foreign borrowing. Alternatively, the equality of the
investment and savings ratios suggests complete immobility because all domestic investment
is financed from domestic savings and foreign capital is not required.
The objective here is to examine the consequences of the cyclic behaviour of the investment
and savings ratios for the Feldstein-Horioka (FH) condition. These two ratios may follow
cyclical episodes of quite different periodicity. In fact our prior expectation is that investment
is subject to short cyclic components while saving is subject to a swing of longer duration.
This matters for all macro phenomena dependent upon some relationship between saving and
investment. The difference between saving and investment at a point in time may by distorted
by contrary cyclic behaviour, for example, if investment is in an upswing phase while saving
is on the downswing, the difference between investment and saving will be exaggerated by
the contrary cyclic pattern. This paper examines the periodicity of swings in savings and
investment ratios for Australian data.
2 The Stylised Facts about Investment and Savings Relations in a Small Open Economy
The stylised facts about the behaviour of the investment and savings ratios for one small open
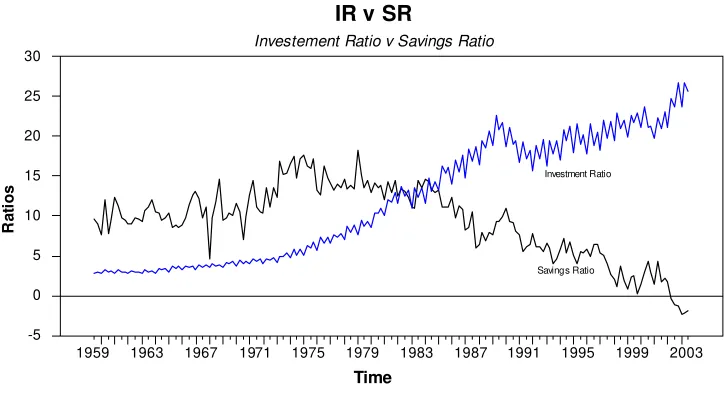
Figure 1
IR v SR
Investement Ratio v Savings Ratio
Time
Ra
ti
o
s
1959 1963 1967 1971 1975 1979 1983 1987 1991 1995 1999 2003 -5 0 5 10 15 20 25 30 Savings Ratio Investment Ratio
This shows that the domestic savings ratio exceeded the domestic investment ratio for the
entire period from 1959:3 to 1983:4, a period in which Australia had made various
adjustments of its exchange rate regime designed to liberalise its foreign exchange markets
while still preserving some central bank control over the foreign exchange market. From
1959 to 1967, the Australian currency was pegged to the Pound Sterling although the strength
of the US dollar as the world base currency led to a switch in the basis of fixing the currency
from the British pound to the US dollar. The peg was shifted to a trade weighted exchange
rate index in September 1974, the number of currencies comprising the trade weighted index
was enlarged in 1976 and ultimately the most flexible of fixed systems, the crawling peg
mechanism was implemented. The peg was adjusted by a troika of public officials twice
daily.1 Ultimately, attempts to administer large variations in capital flows were abandoned in
favour of deregulation and currency floating. The behaviour of the Australian investment and
savings ratios over this period of exchange rate rigidity can be described as an era of
over-saving relative to investment: from Figure 1 the over-savings ratio exceeds the investment ratio
from the late 1950s to the early 1980s in this period of Australia’s financial history. The
1
5 Feldstein-Horioka condition therefore suggests that capital is imperfectly mobile because
Australia’s domestic savings were more than adequate to meet its investment requirements.
The graph does reveal however, that the margin between the savings and investment ratios is
closing over this thirty year period to 1983.
The Australian foreign exchange market was deregulated in December 1983 and was
followed by a period of increased volatility of the US$/A$ exchange rate. During this
adjustment period the savings and investment ratios are approximately equal, which
according to the Feldstein-Horioka condition implies the complete absence of capital
mobility. In the years following this era, 1984 to the present time the investment ratio
continues its upward trend while the Australian savings ratio falls. Domestic savings are no
longer adequate relative to domestic investment and it is in this modern era from 1985 to the
present date that the Feldstein-Horioka condition suggests increasing capital mobility
between Australia and the rest of the world. From the pattern evident on Figure 1 it is clear
that the savings of Australian households are declining while investment demand was rising
in parallel with Australia’s comparatively high rate of economic development.
A further interesting characteristic of these investment and savings ratio data is their cyclical
behaviour. From Figure 1, the amplitude and periodicity of the savings ratio appears to
remain relatively constant while the amplitude of the investment ratio has increased
post-deregulation. Casual observation of Figure 1 also suggests that the cycle in the savings ratio
is of a longer duration than the cycle of the investment ratio. What happens to the
Felstein-Horioka argument if it is the case that the savings ratio follows a longer swing than the
3 Methodology
The aim here is to identify the main cycles in the behaviour of both I/Y and S/Y variables
given the mixed support for the Feldstein-Horioka condition in earlier studies acknowledging
the potential distortion associated with the condition when cyclic behaviour is taken into
account. The most appropriate method for studying the cyclic behaviour of individual time
series is spectral analysis.
Spectral Analysis
Spectral analysis is the study of time series in the frequency domain. The purpose of this
analysis is to determine if the savings and investment ratios exhibit any cyclical variation.
The spectral densities of the logarithms of the prices and their first differences are estimated
for 150 lags. The spectral densities are estimated as follows:
( )
j 0 0 k k jK 0
F 1 2 C 2 C cos k
∞
=
⎡ ⎤
ϖ = π λ⎢ + λ ϖ ⎥
⎣
∑
⎦ϖj = πj/m = j = 0, 1, 2, … m, where m = 150 lags.
The estimated autocovariance is given by,
n k n n k
k t t k t t
t 1 t 1 k t 1
C 1 n k x x 1 n k x x
− − + = = + = ⎡ ⎤ = − ⎢ − − ⎥ ⎣
∑
∑ ∑
⎦Ιf xt, the savings/investment ratio series,contains a periodic element of period k and therefore
the frequency, 2π/ k , the spectral densities will have a sharp spike at α = αk., where
α = amplitude of changes in savings/investment ratios. If the filtered xt does not contain any
periodicities, the spectral densities will be smooth. With data, xt, t = 1, …n and the weights,
7
4 Empirical Results
The major cyclical components in the behaviour of the Australian savings and investment
ratios are shown in Table 1.
Table 1: Major Cyclic Components(1) the Time Series for the Australian I/Y and S/Y Ratios 1959-2003
Series Frequency (Radians)
Periodicity (Quarters)
Spectral Density (2) *Bartlett Window
% Explained
I/Y - 3.1416 2 13.7476 41.6
S/Y - 0.3625 17.33 2.4877 9.3
- 0.24166 26.00 2.597 9.7
(1) The Hodrick-Prescott filter is used to detrend the series.
(2) Tukey and Parzen windows provide similar results – see Figures 2-3.
The power in the I/Y series is concentrated at a short frequency (3.1416) a cyclic component
of only six months. Forty two percent of the variation of the I/Y series is explained by this
component. The swing in the savings ratio (S/Y) is smoother and dispersed, although the key
component in this series occurs at 17.33 or 26.00 quarters. These two components of the S/Y
series explain 20 percent of its variation and are by far the major important cycles in the S/Y
Figure 2
Figure 3
In Figures 2 and 3; the spectral density estimated is shown on the vertical axis while the
frequency components are shown on the horizontal axis. Almost forty two percent of the
variance of the investment ratio (I/Y) is explained at a low frequency of just six months
duration suggesting that investment in Australia is volatile passing one peak level to another
in only six months. This is in direct contrast to the behaviour of the savings ratio (S/Y) of
Figure 3 where approximately 20 per cent of the variation of S/Y is explained by a longer
swing of four to six years. The intriguing aspect of these results is that investment cycles are
short and sharp while savings behaviour is much smoother passing from peak to peak over
9 determine what the short/long swing behaviour of Australian investment and savings rates
means for the current Feldstein-Horioka theory about capital mobility.
5 Conclusion
The reliability of the Feldstein-Horioka condition as a test for capital mobility on Australian
data is diminished by the disparate cyclical pattern of the investment and savings ratios. It is
conceivable that I/Y is on an upswing phase of its cycle while S/Y is on a downswing. The
difference between these two ratios maybe exaggerated by these contra cyclical positions. If
the Feldstein-Horioka condition is to provide a reliable guide then trends in the two series
should form the basis of comparison, alternatively, the Feldstein-Horioka condition should be
redesigned to accommodate the differing cyclic behaviour of the two ratios. This issue
constitutes a further research agenda.
References
Economics Discussion Papers
2005-01 Investment and Savings Cycles and Tests for Capital Market Integration, Arusha Cooray and Bruce Felmingham
2005-02 The Efficiency of Emerging Stock Markets: Empirical Evidence from the South Asian Region, Arusha Cooray and Guneratne Wickremasinghe
2005-03 Error-Correction Relationships Between High, Low and Consensus Prices, Nagaratnam Jeyasreedharan
2005-04 Tests for RIP Among the G7 When Structural Breaks are Accommodated, Bruce Felmingham and Arusha Cooray
2005-05 Alternative Approaches to Measuring Temporal Changes in Poverty with Application to India, Dipankor Coondoo, Amita Majumder, Geoffrey Lancaster and Ranjan Ray
2005-06 Intertemporal Household Demographic Models for Cross Sectional Data, Paul Blacklow
2004-01 Parametric and Non Parametric Tests for RIP Among the G7 Nations, Bruce Felmingham and Arusha Cooray
2004-02 Population Neutralism: A Test for Australia and its Regions, Bruce Felmingham, Natalie Jackson and Kate Weidmann.
2004-03 Child Labour in Asia: A Survey of the Principal Empirical Evidence in Selected Asian Countries with a Focus on Policy, Ranjan Ray – published in Asian-Pacific Economic Literature, 18(2), 1018, November 2004.
2004-04 Endogenous Intra Household Balance of Power and its Impact on Expenditure Patterns: Evidence from India, Geoffrey Lancaster, Pushkar Maitra and Ranjan Ray
2004-05 Gender Bias in Nutrient Intake: Evidence From Selected Indian States, Geoffrey Lancaster, Pushkar Maitra and Ranjan Ray
2004-06 A Vector Error Correction Model (VECM) of Stockmarket Returns, Nagaratnam J Sreedharan
2004-07 Ramsey Prices and Qualities, Hugh Sibly
2004-08 First and Second Order Instability of the Shanghai and Shenzhen Share Price Indices, Yan, Yong Hong
2004-09 On Setting the Poverty Line Based on Estimated Nutrient Prices With Application to the Socially Disadvantaged Groups in India During the Reforms Period, Ranjan Ray and Geoffrey Lancaster – published in Economic and Political Weekly, XL(1), 46-56, January 2005.
2004-10 Derivation of Nutrient Prices from Household level Food Expenditure Data: Methodology and Applications, DipankorCoondoo, AmitaMajumder, GeoffreyLancaster and RanjanRay
2003-01 On a New Test of the Collective Household Model: Evidence from Australia, Pushkar Maitra and Ranjan Ray – published in Australian Economic Papers, 15-29, March 2005.
2003-02 Parity Conditions and the Efficiency of the Australian 90 and 180 Day Forward Markets, Bruce Felmingham and SuSan Leong
2003-03 The Demographic Gift in Australia, Natalie Jackson and Bruce Felmingham
2003-04 Does Child Labour Affect School Attendance and School Performance? Multi Country Evidence on SIMPOC Data, Ranjan Ray and Geoffrey Lancaster – forthcoming in International Labour Review.
2003-05 The Random Walk Behaviour of Stock Prices: A Comparative Study, Arusha Cooray
2003-06 Population Change and Australian Living Standards, Bruce Felmingham and Natalie Jackson
2003-07 Quality, Market Structure and Externalities, Hugh Sibly
2003-08 Quality, Monopoly and Efficiency: Some Refinements, Hugh Sibly