Enhanced Computational Model for Intelligent Selection
of Telecom Services using CLARA and Artificial Neural
Network
Shweta Gupta
Bharati VidyaPeeth’s College of Engineering
Shikha Rastogi
Bharati VidyaPeeth’s College of Engineering
Alok Chaturvedi
DITM
ABSTRACT
This paper proposes an enhanced design for development of computational model for intelligent selection of telecom services meant for telecom customers. Computational model comprises of Data mining and Soft computing techniques. CLARA cluster algorithm as Data mining technique is used to categorize telecom customers into five clusters referring to five different telecom services scheme. Categorization of customers is based on their Historical call usage pattern. CLARA addresses the noise sensitivity defect of K-means which was used in previous model. Consequently soft computing technique such as neural network is implemented to train the system. Neural network performance graph shows that this model gives better result than the previous model.
Keywords
Telecommunication services, data mining, clustering, CLARA, K-means, soft computing, artificial neural network
1.
INTRODUCTION
According to present scenario, we are observing that lot of companies are emerging in the telecommunication market. With the rapid development in mobile telephone network, vast competitive pressure is generated on the various companies and companies are looking for benchmarks for enhancing their performance or improving business plans for generating more revenues against competitor’s to remain a lead competitor in the market. To fulfill the requirement of customer or to make better investment decision for a telecom company, it is very important to predict requirement of services as a precondition. The telecom planning involves consideration of manyinfluential factors, such as the outgoing minutes of usage, revenue generated by outgoing minutes of usage, outgoing minutes of usage during roaming, revenue generated during roaming and average revenue per user. Since there can be different kinds of customer pertaining to different kinds of demands, the proposed approach is designed to perform customer segmentation i.e. divide the customer into different segments according to their network usage pattern and select the best design strategies for profitably serving the chosen segments better than the company’s competitors do. In this paper, clustering as a data mining
2.
DATA MINING FRAMEWORK
2.1
Domain Understanding
Data mining, the extraction of hidden values from our data warehouse, used to predict future information from large databases. It enhances Business model and change policies based on patterns. In recent years Data is enormous and analysis of the data makes sense. Data mining acts as a powerful technology which can answer various business queries helps the organization to grow. Various mining tools are available to forecast future trends and behaviors, allowing businesses to make practical, knowledge-driven decisions. To successfully extract relevant patterns from previous understanding of the business goals is highly important otherwise data mining will lead to the discovery of irrelevant and useless pattern.to understand the target customers, a study of relationship between their network usage pattern and personal benefits was helpful. This study leads to the better design of schemes to produce even more desirable results like high revenue generation and customer satisfaction. Therefore, it will be beneficial to have a tool that will help us to respond to questions such as: “What all services we should offer to which segment of customer”?
2.2
Clustering Approach
The approach that we propose for customer segmentation is the clustering approach. This approach implies data grouping and partitioning. Clustering analysis is a fundamental but important tool in statistical data analysis. In the past, the clustering techniques have been widely applied in a variety of scientific areas such as pattern recognition, information retrieval, microbiology analysis, and so forth. Clustering, in data mining, is a useful technique for discovering interesting data distributions and patterns in the underlying data. The process of segmenting users as a group of similar customers may not always be perfect. Even though customers may share a common usage pattern, there are still differences in demographics that cannot be then further segmentation may be needed within that segment. In our project, customer segmentation is done using both k-means and CLARA. Experimental results show that CLARA outperforms the k-means.
2.3
K-means Algorithm
minimum-distance classifier to separate them. That is, we can say that x is in cluster i if || x - mi || is the minimum of all the k distances. This suggests the following procedure for finding the k means:
Make initial guesses for the means m1, m2, ..., mk
Until there are no changes in any mean
o Use the estimated means to classify the samples into clusters
o For i from 1 to k
Replace mi with the mean of all of the samples for cluster i o end_for
end_until
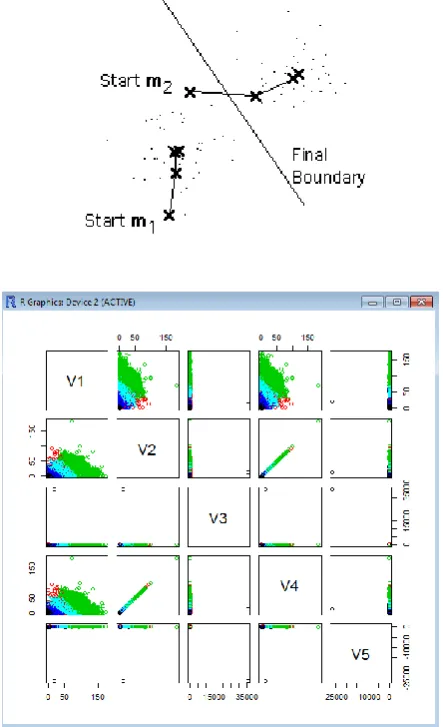
Here is an example showing how the means m1 and m2 move
[image:2.595.53.275.275.639.2]into the centers of two clusters.
Fig 1: K-means Clustering Validation
2.4
CLARA Algorithm
Compared to PAM, CLARA can deal with much larger data sets. It also tries to find k representative objects that are centrally located in the cluster, they define. Internally, this is achieved by considering data subsets of fixed size, so that the overall computation time and storage requirements become linear in the total number of objects rather than quadratic.
In PAM, the collection of all pair-wise distances between objects is stored in the central memory, thereby consuming O(n2) memory space. Therefore PAM cannot be used for large values of n. To avoid this problem CLARA does not compute the entire dissimilarity matrix at a time. Therefore, CLARA accepts only the actual measurements (i.e. n *p data matrix). The clustering of objects with CLARA is carried out in two steps. First, a sample is drawn from the set of objects and divided into k clusters, using the same algorithm as in Pam. The algorithm consists of two parts:
Build phase:
1. Choose k entities from n dataset to become the medoids,
2. Assign every entity to its closest medoid.
Swap phase:
3. For each medoid m,
3.1 For each non medoid data point O
3.2 Swap m and O and compute total cost of configuration (distance)
4. Select the configuration with minimum cost.
5. Repeat 2-5 until no change in medoid.
The quality of clustering is defined as the average distance between each object and its medoid. This procedure is repeated five times and clustering with the lowest average distance is retained for further analysis. The final average distance, the average and the maximum distance to each medoid are calculated in the same way as in Pam for all objects. The ratio of the maximum distance of the medoid to the minimum distance of the medoid to another medoids gives information on the tightness of a cluster. A small value (0.20) indicates a very tight cluster, while a value > 1 indicates a weak cluster. Finally, silhouettes of clusters are plotted, but only for the best subset, since the entire silhouette plot will be too large to print.
3.
ARTFICIAL NEURAL NETWORK
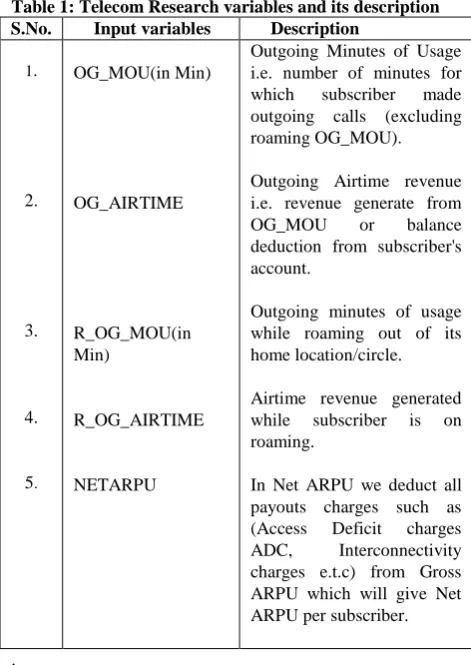
Fig 2: Silhoutte plot of CLARA for k=5 and n=59100 with average Silhoutte width:0.47
Fig 3: CLARA clustering Visualization
networks operate on the principle of learning from examples; no model is specified a priori. Neural networks are likened to nonparametric models in the statistical literature. Neural networks are used to solve complex nonlinear function approximation problems, difficult linearly inseparable pattern classification problems, speech recognition and control problems, and complex time-series modeling problems though the neural network technology has been applied in various fields. Neural networks can be characterized in terms of the three entities:
1. Model of neurons, i.e., characteristics of the processing unit.
2. Models of interconnection structure, i.e., the topology of the architecture and strength of the connections that encode the knowledge.
3. A learning algorithm, i.e., the steps involved in adjusting
3.1
Back Propagation Algorithm
1. For the output layer neurons, the difference between the actual and the desired output is computed i.e. calculate the error in each neuron of the output layer.
2.
For the hidden layer neurons, multiply all the weights between the hidden layer neuron and the output layer neurons with the error of the corresponding output layer neurons and add the product.3.
Compute the error derivative of the weights. It is the product of the error of the neuron computed in step 2 and the value of the weight through the incoming connection.4.
Adjust the weights of each neuron to minimize the error.4.
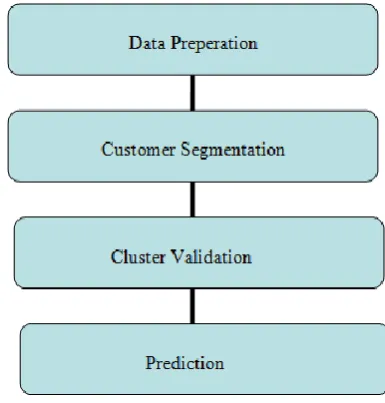
TELECOM RESEARCH VARIABLES
[image:3.595.310.546.283.616.2]These are the variables that we have taken into consideration for our research methodology.
Table 1: Telecom Research variables and its description S.No. Input variables Description
1.
2.
3.
4.
5.
OG_MOU(in Min)
OG_AIRTIME
R_OG_MOU(in Min)
R_OG_AIRTIME
NETARPU
Outgoing Minutes of Usage i.e. number of minutes for which subscriber made outgoing calls (excluding roaming OG_MOU). Outgoing Airtime revenue i.e. revenue generate from OG_MOU or balance deduction from subscriber's account.
Outgoing minutes of usage while roaming out of its home location/circle. Airtime revenue generated while subscriber is on roaming.
In Net ARPU we deduct all payouts charges such as (Access Deficit charges ADC, Interconnectivity charges e.t.c) from Gross ARPU which will give Net ARPU per subscriber. .
5.
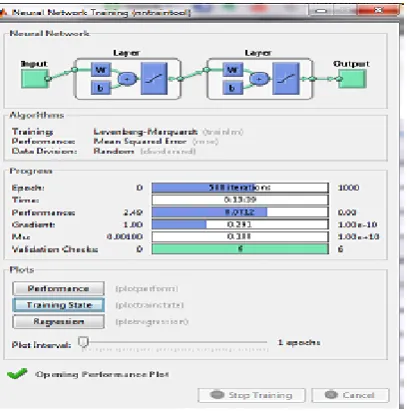
RESEARCH METHODOLOGY
[image:3.595.59.273.312.499.2]Table 2: Research Methodology
5.1 Description and Offers provided to the
Clusters
Cluster I: - We can observe comparatively equal roaming and call usage pattern with a medium overall usage pattern
Offer: - Recharge with Rs. 400 get 210 TT, 200 roaming TT and 300 SMS free, where TT is talk-time.
Cluster II: - This is the lowest revenue generating cluster with a low usage pattern. Roaming usage is higher than normal usage.
Offer: -
(i) Recharge with Rs 50 get 20 TT and 40 roaming TT.
(ii) Recharge with Rs 50 get 60 roaming TT.
Cluster III: - Here we can observe a low call usage pattern, and a very high roaming OG_MOU
Offer: - Recharge with Rs 500 get free 400 roaming TT and 100 normal TT
Cluster IV: - Here major portion of revenue is generated from outgoing calls and comparatively very small from roaming outgoing calls.
Offer:- Recharge with Rs 500 get 500 TT and 500 SMS free
Cluster V: - In this cluster major chunk of revenue comes from roaming charges, hence an attractive roaming offer can be provided. Call usage pattern is also high, hence another attractive offer based on call usage can be provided.
Offer: -
(i) Recharge with Rs. 1000 get 1200 roaming TT and 600 SMS free.
(ii) Recharge with Rs. 1000 get 1200 TT and 600 SMS free.
(iii) Recharge with Rs. 1000 get 600 TT, 600 roaming talk time and 600 SMS free.
6.
IMPLEMENTATION
1. Customer Segmentation: The technique used for customer segmentation is clustering. A cluster can be defined as a collection of objects which are ”similar” between them and ”dissimilar” to the objects belonging to other clusters. The similarity criterion that was used in this case is distance: two or more objects belong to the same cluster if they are ”close” according to a given distance (in this case geometrical distance).This is called distance-based clustering. Implementation uses ‘R’ tool, which is a Programming Environment for Data Analysis and Graphics. R is an integrated suite of software facilities for data manipulation, calculation and graphical display. Clustering analysis for customer segmentation and visualization is done using R.
2. Clustering Algorithm: We are using here CLARA clustering algorithm, which is Clustering large Application. Compared to k-means, CLARA deals with large data set. Instead of finding medoids for the entire data set, CLARA draws a small sample from the data set and applies the PAM algorithm to generate an optimal set of medoids for the sample. The run time complexity is O(n) instead of O(n2) as in PAM.CLARA addresses the noise sensitivity defect of K-means.
Fig 4: Implementation steps Variables I II III IV V
OG_MOU 0.6- 137.8
0.00-59.00
0-76 28-245 0-147
OG_AIRT
IME
0-87.58
0-30 0-60 0-189 0-137.5
R_OG_M
OU
0-173.08
0-101
0-242 0-106.7 0-226
R_OG_AI
RTIME
0-104.8
0-77.5
0-204.2
0-62.3 0-196.5
NET_ARP
U
91.0 -95.74
-300-37
78 -96.36
-139 – 139
[image:4.595.317.510.530.732.2]3. Cluster validation: Cluster validation refers to the problem whether a found partition is correct and how to measure the correctness of a partition. A clustering algorithm is designed to parameterize clusters in a way that it gives the best fit. A variety of measures aimed at validating the results of a clustering analysis and determining which clustering algorithm performs the best for a particular problem statement.
4. Prediction: Training is done using MATLAB system so that any new customer can be allotted to his/her corresponding segment based on his network usage.
7.
EXPERIMENTAL RESULTS
[image:5.595.329.528.71.266.2]Clustering is done using both k-means and CLARA Result of clustering is fed into neural network to train the system. Below are the two parameters of neural network performance graphs which show that CLARA outperforms the k-means as CLARA deals with the noise sensitivity defect of k-means.
Table 3: Comparison of K-means and CLARA
S. No.
Algorithm Mean
Square
root(MSE)
Execution
time(min)
1.
2.
k-means
CLARA
.10266
.077591
13.39
06.31
[image:5.595.324.531.293.500.2]Mean square value and execution time is less for CLARA than k-means. Consequently, CLARA is used for customer segmentation for yielding better results and efficiency.
Fig 5: k-means neural network performance parameter
[image:5.595.58.286.329.439.2]Fig 6: k-means neural network performance graph
[image:5.595.328.529.371.723.2] [image:5.595.66.270.503.709.2]8.
CONCLUSION
A computational model for telecom system using data mining and soft computing techniques was successfully designed. On one hand, data mining techniques were used to segment telecom customers into various sectors based on their similarity in network usage. K-means and CLARA are compared and experimental result shows that CLARA gives better result than K-means. Consequently, CLARA is used for customer segmentation whereas, on the other hand
,
techniques pertaining to artificial intelligence were implemented to train the system so that any new customer can be allotted to his corresponding segment based onhis
network usage. Pertaining to each segment several offers were also proposed.9.
REFERENCES
[1] Peter H. Sydenham and Richard Thorn, John Wiley & Sons, 2005 Artificial Neural Networks Ajith Abraham Oklahoma State University, Stillwater, OK, USA ,Handbook of Measuring System Design, Ltd. ISBN: 0-470-02143-8
[2] G.Grudnitski and A.Quang, 1996 “Important factors in neural networks’ forecast of gold futures prices,” in Proc. Of the 4th International Conference of Neural networks in
the Capital Market,pp-163-176.
[3] Jiawei Han and Micheline Lamber, Data Mining: Concepts and Techniques. Second Edition. Morgan Kaufmann Series.
[4] Zhenyu Zhang and Xiaoyao Xie, 2008 Research the Effectiveness of Neural Network for Telecom Planning Prediction, Key Laboratory of Information and Computing Science of Guizhou Province,IEEE.
[5] YU-TENG CHANG, applying data mining to telecom churn
[6] 2009 Management, International Journal of Reviews in Computing.
[7] Daniela Stan Raicu, 1999 A Data Mining Framework for Target.
[8] Adrian Costea, 2006 The analysis of the telecommunications sector by the means of data mining techniques, Journal of applied quantitative methods. [9] Camargo M, Jimenez D,Gallego L, 2005 Using of Data
Mining and Soft Computing Techniques for modeling bidding prices in power markets, Research Group PAAS. [10] Rob Potharst, Uzay Kaymak, Wim Pijls,2001 Neural
Networks for target selection in direct Marketing. [11] Zadeh, L.A. 2001 Applied Soft Computing. Applied Soft
Computing.
[12] Gary M. Weiss, Department of Computer and Information Science, Fordham University Data mining in Telecommunications.
[13] Yiu-Ming Cheung, 2003 A new generalized k-means clustering algorithm
10. AUTHORS PROFILE
SHWETA GUPTA
Shweta Gupta is a final year undergraduate student, in Bachelors of Technology, Information Technology, Bharati Vidyapeeth’s College of Engineering; New Delhi affiliated to GGS Indraprastha University (New Delhi). She is the founder of Indian Society of Technical Education (ISTE) Student sub chapter in the college. She is an active member of Research and Development team in Bharati Vidyapeeth. She is among the top rankers of the college and her area of interests is Data Mining, Artificial Intelligence, Information Retrieval, Natural Language Processing. She has published papers in international journals of repute.
SHIKHA RASTOGI
Shikha Rastogi is presently an Associate Professor of Information Technology Department in Bharati Vidyapeeth’s College of Engineering, New Delhi (GGSIPU). She has done B. Tech in Information Technology from U.P. Technical
University in 2006 and pursued M.Tech from Guru Gobind
Singh Indraprastha University with exceptional career Record.