Visualization of Linguistic and Knowledge using DAG of
Concept/Ontology
Sheak Rashed Haider
Noori
Department of Information science and engineering University of Trento, Italy.
Khandaker Tabin
Hasan
Department of Computer Science and Engineering American International University of Bangladesh
Md. Saddam Hossain
Mukta
Department of Computer Science and Engineering
Islamic University of Technology (IUT)
Md. Saifur Rahman
Department of Computer Science and Engineering Bangladesh University of Business and TechnologyABSTRACT
The capability to systematize and manage an emerging Linguistic and Ontology/Concept Knowledge is key to an editor's usability. Convenient and intuitive presentations and manipulations of a Word and its Concept, Concept's interlinking concepts and relations are essential. Concept hierarchies also have multiple inheritances, convenient and insightful presentations while keeping the associations straight is a challenge. Therefore, our aim is to create a visualization that will effectively display all this elements and at the same time let the user perform various operations easily on the Linguistic and Ontology/Concept Knowledge. This paper describes the management console for the Linguistic and Conceptual part.
General Terms
Knowledge management, linguistic and visualization.
Keywords
Concept, synset, gloss, knowledge, ontology.
1.
INTRODUCTION
The revolution of Internet and the Web takes the computer and information technology into a new age. The information on the web is growing very fast. The progress of information and communication technologies has made accessible a large amount of information, which have provided each of us with access to far more information than we can comprehend or manage. This emphasizes the difficulty with the resulting semantic heterogeneity of the diverse sources. Human knowledge is a living organism and as such evolves in time where different people having different viewpoints and using different terminology among people of different cultures and languages, intensify the heterogeneity of the sources even more. These introduce some concrete problems like natural language disambiguation, information retrieval and in-formation integration. Nevertheless, the problem is quite well known in almost every branch of knowledge and has been independently approached by several communities for several decades. To make this huge amount of existing information accessible and manageable while also solving the semantic heterogeneity problem, namely the problem of diversity in knowledge, and therefore support interoperability, it is essential to have a large scale high quality collaborative knowledge base along with a suitable structure as a common ground on which interoperability among people and different systems should be possible. It will play the role of a reference point for communication, assigning clear meaning by accurate disambiguation to exchanged information, communication and automating complex tasks.
However, successfully building large scale knowledge bases with maximum coverage is not possible by a single person or a small group of people without collaborative support. In this paper, we have presented our approach on information visualization and management of linguistic and concepts/ontologies. In our visualization method we represent ontology as a directed acyclic graph (DAG) [16]. Providing a visual hierarchy is one of the main goals in structuring information presentations. Presenting data as in graph is one way of structuring information. However it is well known that understanding and comprehensive analysis of data in graph structures is easiest if the size of the presented graph is small. Therefore we employ an incremental browsing method of the information space structure and visualizes in every moment only specific part of the information where its content depend on previous action.
Providing the facility for word, senses, synsets and gloss search are the basic operations in any thesaurus. The goal of visualization is to provide a meaningful context in which the user can explore the semantics of word from different points of view. Visualization and navigation structures should determine by analyzing these object characteristics and the pattern. For example, words can be shown in alphabetic ordered lists , synsets in structured format whereas for concept (i.e., ontology) the most suitable visualization would be hierarchical. These visualization solutions will allow users to focus only on the relevant part they are interested in.
In section 2, we have discussed different jargons of semantic web, linguistics and visualization tools, functional requirements are described in section 3. We have focused our methodology in section 3, 4, 5 and 6 along with some visualization and management techniques.
2.
BACKGROUND STUDY
2.1
Ontology
2.2
Knowledge Base services
Ontologies describe the concepts and the relationships between concepts which are used to represent a variety of domain knowledge, different viewpoints, scopes, and linked heterogeneous information sources, providing a vocabulary for those domain and a specification of the meaning of terms used in the vocabulary. Ontologies range from straightforward simple taxonomies, classifications, database schemas, to very complex with rich constructors of Description Logic, highly structured knowledge bases with complex relations, which may differ not only in their content, but also in their way of organization and implementation. In these days ontologies have been taking on not only in the research communities but also in many business communities as a means to share, reuse and process domain knowledge. It has proven to be a useful tool in the area of Knowledge management to build knowledge bases. As a result, there is a growing need for a system that provides various knowledge base related services, effective visualization [21][22], search and navigation and gives support to most of the activities involved in the knowledge base construction process. Many ontology models support multiple inheritances in the concept and relation hierarchies, Effective presentations of ontology interlinking concepts and relations with multiple inheritances are challenging. There exist many tools with ontology building methodologies, several visualization[21][22] methods for ontology visualization and navigation and also a number of languages are by now available for knowledge representation. The purpose of this paper is to present these tools, techniques and their features in order to understand current trained and future research in the area of Knowledge management. For design, management, and browsing of ontology effective visualization is needed. In general, bunches of work in visualization of ontologies exist. IsAViz9[20] is a standalone application for browsing and authoring RDF[15], built on AT&T's Graphviz[20] graph visualization software, is a widely used tool used to visualize RDF metadata. However it has limitations showing overall structure of a set of instances due to their layout. Katifori et al. [3] presented a very comprehensive survey on ontology visualization methods. They tried to review the research that has been done so far on ontology visualization, providing a summary of the existing methods with their pose and cons. They grouped the methods according to the six general categories of visualization types: Indented list, Node–link and tree, Zoomable, Space-filling, Focus+context[20] or distortion and 3D Information landscapes which were further categorized according to the number of space dimensions they employ: 2D or 3D. They investigated how those relate to the special requirements of an ontology visualization tool in relation to the tasks a user would like to perform with an ontology visualization tool. 3D methods exploit the third dimension to improve usage of space and/or usability whereas 2D methods don’t. However they argued, 3D visualization in general requires increased system resources in order for navigation and viewing to be smooth and without delays and, as a result, is probably not suitable for Web use. Furthermore, the 3D methods presented here employs more complex navigation methods and may be a little frustrating and disorienting for a novice user. In their discussion part they have shown according to [4] ontology features like the class hierarchy, the role relations, the properties, and the instances, 3D offers the possibility of a better representation while 2D can be some-what restrictive. As a counter they have said, 3D representations only a little bit improve the screen space problem while increasing the complexity of the interaction [5], further more navigation in a
3D space can be difficult for a novice user, while even simple tasks such as selecting an object can be problematic [6]. Herman et al. [7], presented representations of structured data, in particular the graph visualization techniques were discussed. They categorized graph visualization from the graph drawing or graph layout point of view. They point out the limitation of graph visualization raised due to size of the graph, in particular for big data sets i.e., thousands of nodes, as its makes the graph so dense that interaction with the graph becomes difficult and often make it impossible to navigate. To address the problems with 3D graph visualization techniques they mention inherent cognitive difficulties of 3D navigation in our current systems.
Shneiderman [8] categorizes visualization methods based on the data-type of the elements to be represented in the interface (linear, 2 dimensional, 3 dimensional, temporal, multidimensional, tree, network, workspace) and the task characterize based on how users interact with the visualization of a large amount of information: (overview, zoom, filter, details-on-demand, relate, history, extract).
In the last few years, many ontology-building tools have been developed, some of which we have presented above. A survey that covers very large numbers (more than 50) of tools that have ontology editing capabilities with comparisons can be found in[9], they have reviewed and analyze into a dozen different categories which covered the important functions and features of those tools . Ontology visualization is a particular sub area of graph visualization [18] that still have many implications because of the inherent complex structure of the ontologies. However it is clear that the main problem of current tools, regardless whether meant for restricted organizations or large communities, is that they are largely based on superimposed models, structures and terminology and many of them have a strong bond with a specific language (e.g., Ontolingua, OCML, LOOM etc). However all these tools and applications have contributed to a lot to the emergent research and development of the ontology community.
In descriptive ontologies, [13] concepts represent real world entities, e.g., the extension of the concept animal is the set of real world animals, which can be connected via relations of the proper kind. The motive of descriptive ontologies is to specify the terminologies used in their real meaning, according to the nature and the structure of the domain they model.
When a groups words of various part of speech (nouns, verbs, adjectives and adverbs) into sets of cognitive synonyms, can be defined synsets, [14] each expressing a distinct concept. In other words, each synset groups all the words with same meaning or sense.
3.
FUNCTIONAL OVERVIEW AND
REQUIREMENT DESCRIPTION OF
TARGET SYSTEM
we plan to investigate the feasibility to develop a system that is able to:
Provide efficient and effective way for browsing and searching the linguistic knowledge;
Provide efficient and effective way for browsing and searching the concept knowledge;
Support unskilled users in building their own taxonomies in a flexible and effective way.
Support user in linguistic and concept knowledge base evolution and customization;
Support user in managing multilingual linguistic knowledge
Import and manage existing linguistic and concept knowledge provided by experts;
[image:3.595.318.537.96.269.2]From an implementation point of view, the abovementioned tasks can be categorized into two different parts:
Fig 1: Linguistic and concept knowledge management system.
Search and navigation part: It includes Search, browsing words and its components such as synsets and concepts hierarchy.
Maintenance part: Operations on linguistics, for instance create a word or synset, delete a word or synset, update and delete a word or synset. And creation, update and remove relations.
All operations of creation of new knowledge, updating, deletions search and navigation will be pursued in the Knowledge Base through an Inference engine.
4.
OUR VISUALIZATION
TECHNIQUES
A common tendency is, during navigation people don’t inspect screens watchfully and read every word instead they scrutinize swiftly for relevant information according to their goal. Therefore the more structured and briefs the presentation of information, the more swiftly and effortlessly people can examine and understand it.
4.1
Search and navigation
Providing the facility for word search is one of the basic operations in any thesaurus. The goal of word visualization[19] is to provide a meaningful context in which
the user can explore the semantics of word from different points of view.
Words
computable
computation
computational
computational linguistics
computationally
compute
computed axial tomography
computed tomography
[image:3.595.50.290.291.452.2]computer
Fig 2: Visualizing word search
The idea is to show the search result as an alphabetically ranked list of words, as shown in figure 2, thus combining the use of keyboard and a scrolling list to make navigation more efficient. Basically, a specific word can be singled out easily from the alphabetically ranked list.
4.2
Search and navigation of Synsets:
Every word has a synset. While searching a synset, each synset organizes a set of words with same meaning according
Fig 3: Hierarchical tree browser with a horizontal layout for a file system.
[image:3.595.314.571.388.666.2]asymmetric. The most common example of such visualization[18][19] is the directory structure of a hierarchical file system. A set of synsets of a word can be presented as a blocks of information in a vertical linear list in the second column. Our visualization technique can manage the synsets in the following fashion:
4.2.1.1
Synsets category:
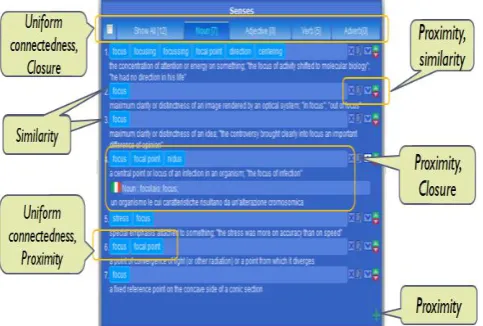
[image:4.595.322.566.237.429.2]Synsets are further categorized by parts of speech (POS). We assume users will start their search with words and they will get in to the synset through the words navigation. Therefore, the scope of the synset visualization[21][22] depends on the search word. In some cases, this list could be quite long, as it will include the synsets from all the part of speech (POS). We can use POS to further filter the query result and grouping the synsets into consistent categories. There are many alternative ways of showing POS groups. One possible way is to show them in an expandable vertical list. An alternative way is to show them in a Tab view. A tab view provides a convenient way to present information in a multipane format
Fig 4: Sysnets/Senses are grouped according to Principle of uniform connectedness, Proximity, Close and similarity
to give visual unity.
The tab control is displayed horizontally centered across the top edge of a content area.
4.2.1.2
Synsets rank:
Conceptually senses/synsets associated to words are arranged according to their rank in ascending order. This ordering is determined by frequency of use in semantically tagged corpora [10], thus the synset in rank 1 is the most frequently used.
4.2.1.3
Words Rank:
Some words that people use more frequently and there are some words those people use more rarely and this is an important psycholinguistic fact about the mental lexicon. There are many ways to determine the familiarity of a word. One good way is the frequency of use. Another alternative way that has been used by WordNet to indicate the familiarity is the frequency of occurrence and polysemy. According to them, the more frequently a word is used, the more different meanings it will have in a dictionary. [10]
4.3
Search and navigation of Concepts
Provision of Search[23] is the last hope when are lost in information space or simply do not know where are the desired information. Every synset has one concept. Concepts
are linked between them according to their semantic relationship and build a hierarchy of concepts. A concept hierarchy generally consists of associative and hierarchical relations. We can visualize the concept hierarchy in two different ways, from more general to more specific or from more specific to more general. If we consider the former, the concept expressed by the parent node is, as expected, more general than the concepts expressed by its children. In the other case, the direction would be opposite.
[image:4.595.39.281.286.449.2]The more intuitive way to represent a hierarchy of concepts is through a rooted tree where the root label is the name of the concept and internal and leaf nodes‟ labels represent either its child or parents depending on the view direction of the concept hierarchy. Such tree view mechanism is very well-situated and familiar for the user.
Fig 5: Concepts Panel.
One can easily expand and collapse the nodes and is capable to get a quick outline over the hierarchy. Notice that, if we consider parent child relationship, a concept can have multiple parents and multiple children. For example, if we consider Bird as root and view it from more general to more specific, the concept “Bird” has 5 parent concepts and 38 child concepts. Yet, for the wide number of relations and concepts, the illustrative potential of a tree might not be enough. A concept with multiple parents is not so easy to represent in combination with an effective representation of the relations. It is desirable for the visualization to indicate concepts with multiple parents and provide efficient means to view all direct ancestors of a concept. A common technique followed by many ontology editors is visualizing multiple inheritances by replicating child nodes under all their parents and many of the Hierarchical visualizations even do not sup-port this feature. However our intuition is DAG (directed acyclic graph) visualization instead of a tree might, in this case, help to overcome this visualization problem. This example also brings back the usefulness of filtering results.
From the above analysis we can identify some essential elements that will guide the way of displaying the DAG:
We should have a way to change the overall display mode of the concepts visualization. There are two display modes: “Show from parents to children” and “Show from children to parents”
There should be a Concept tree[17] that allows the navigation through the concepts. If the display mode “Show from parents to children” is selected, then the root will be treated as a parent concept[17] and its children will be shown subsequently. In the same way, if “Show from children to parents” is selected, then the root will be treated as a child concept and its parent(s) will be shown as subsequent children. Also, the kind of each relation (e.g., is-a, part-of) existing between concepts should be displayed in some way.
As the concept hierarchy is a DAG, there should have a way to visualize the multiple parents and children thus allowing the DAGs navigation in a natural way.
Often tree nodes label is not descriptive enough. Whenever it is needed, then concept descriptions should be displayed. Additional information can be given via tool-tips.
There are many ways to show and interact with the hierarchy of concepts. In the model below(see Figure 5), multiple parents are visualized in the “Parent/Children Box”. This box will always visualize the alternative parents/children (those not in the tree view) for the selected concept depending on the display mode. Selecting any parent from the list will add it to the tree as a parent of the currently selected node and show its parents in the Parent box. For instance, if “Change” is selected, it will become the new root of the tree (i.e., the user goes one level up following the desired path). As a consequence, the parents of “Change” will appear in the list, i.e. “focus”. The added value of our visualization lies in its expressivity. The concepts and their relationships between their child and between their parents are easy to detect.
Notice that here are different kinds of relations - including hierarchical (is-a, part-of) and associative ones (e.g. member, see also). Different kinds of relations can be emphasized using the standard icons also codifying the direction of the relation. The idea is we show the relation in textual form followed by a concept label. The interesting aspect of the visualization is that direction in the DAG[16] is related to semantic relations. For example to represent the concept “Dog” with the relation[17] “is-a” we use: >> [is a] Dog”. In the same way, assuming dog has multiple parents, to represent the DAG, we can use : >> [is a] Dog. Notice that either “<<” or “>>” is used according to the selection mode.
5.
MANAGEMENT
FUNCTIONLITIES
(CREATE/UPDATE/DELETE)
We clearly separate the CUD (create/update/delete) operations part from the search and navigation to avoid possible confusion. In the following sections, we describe in detail the CUD operations on words, senses, synsets, concepts and relations between them. We also present thepseudo-code for all operations. Like-wise search and navigation, the type of operation also varies from object to object. “CUD” operations can be divided into three different parts where each part is responsible for a set of related functionalities:
Components of Word
We identified the following components those are directly related with a word:
-A string that represents the word
-One or more derived or exceptional form of the morphological root of a word.
Components of Sense/Synset:
We identified the following components those are directly related with sense/synset:
- A natural language description of the sense/synset
- Part of speech of the sense/synset; possible values are “Noun”, “Adjective”, “Verb” and “Adverb”.
- A set of words associated to the sense/synset;
Components of Relation:
We identified the following components those are directly related with relation:
-A list of predefined relations (relation kind). Possible relations can be hierarchical (e.g., is-a, part-of) and associative.
- A source Concept - A target Concept.
5.1
Managing Words, Synsets and
Concepts
It is important to underline that for us the notion of synset is central. The user can manage words and con-cepts through a synset. In particular, the user can perform the following operations on words and synsets:
5.1.1
Create Synset
There are three different scenarios in which a user can create a synset:
Create a synset as a new root concept
Create a synset (and corresponding concept) as child of an existing concept
Create a synset to be associated with a concept that has no synset in that language
In all the cases above the synset is created by specifying its first word.
5.1.2
Update a Synset
Updating a synset can be done in the following ways: By adding a word to the synset
By removing a word from the synset By updating the rank of a word in the synset By updating the rank of a synset among the synsets By changing gloss and POS of the synset
5.1.3
Delete a Synset:
Deleting a synset can be done in two ways: Deleting the synset and keeping the concept Deleting the synset together with the corresponding
concept
5.1.4
Create a relation:
Linking the (conceptcorresponding to the) synset with an existing concept.
5.1.5
Delete a relation:
Remove an existing relation among two concepts.
5.1.6
Update a relation:
In the subsequent section, as a proof of concept we are only giving how to create a synset as a new root concept.
5.2
Create a synset as a new root
concept
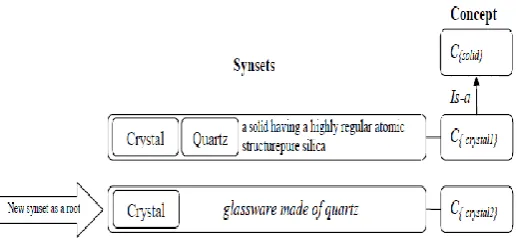
[image:6.595.33.292.205.327.2]By the term “root concept” we mean here a concept that is not linked with any other concept present in the system. This situation can arise when one does not know exactly where in the concept hierarchy this new concept could be placed. The creation of a synset corresponding to a root concept entails several sub-sequent steps (figure 6 describes the steps).
Fig 6: Add a new synset “crystal” as a new root concept
First we need to provide the necessary information that are required to build the synset, namely: a word for a given lemma; the description of the word in terms of sense gloss that would describe the word meaning in natural language; the Part Of Speech of the word sense (i.e., noun, adjective, adverb or verb); and the language of the word that would say which language this word belongs to. Finally, there is the need to build a concept that would be the language independent representation of that specific synset.
All operations that are required to create a synset can be merged into a single function with the following parameters
CreateSynset(lemma : String; pos : String ; gloss : String; String; lang: Locale). This procedure creates a word together with a new synset and concept thus it links the sense with the synset and concept. The glosss belongs to the synset as it represents the set of words with the same sense in a language. GetWord(lemma) is a select procedure which finds the corresponding word of a given lemma in the KB. If any word corresponding to that lemma than it returns the word, null otherwise. CreateX() procedure is used to create the persistence instance in the database. For the sake of limited spaces, we could not show the other operations.
6.
DEALING WITH MULTIPLE
LANGUAGES
[image:6.595.301.561.478.613.2]One synset can have corresponding synset(s) in other languages. Therefore, there should be a way to visualize the senses associated to a word in different languages while also maintaining the context. One intuitive way of performing this operation is expand the synset block and showing the words associated to the same senses in different languages as a separate block under that corresponding sense. To give a visual impression, we can add flags to synset blocks so to indicate its corresponding language (e.g, for Italian ). However, in this way, we can show only synset‟s information at a time, but to get whole information in another language we need a different way to change the language for the whole interface. There are two different ways to dealing with multiple language (1) general view, in which case the change of the language would affect the whole interface (2) specific view, in which case the language change would affect only the specific part of the interface.
Fig 7: It will create a new word incase a word for the given lemma and in the given language does not exist
Fig 8: Concept node details
6.1
General View
One way to allow the user to select the language is to show a set of flags where each flag represent a language on the top of the system and allow the user to select any of them. However, this approach does not scale enough when languages are too many. One alternative way is to put all the supported languages by the system in a dropdown list and allow the user to select one from there. Moreover, we have to consider also one more thing that is the CUD operations. When the language will be change by the user what will be the active language for the operations. A user can change the language
CreateSynset
It creates a synset and a new root concept
lemma = is a string;
gloss = the natural language description of the synset; pos = the part of speech
L = the language of the new synset; w = the word for the new synset; s = the new synset for the word; c = the new root concept
1. CreateSynset(lemma, gloss, pos , L ){
2. w := GetWord(lemma, L)
3. if (w = null) {
4. w := CreateNewWord(lemma, L); }
5. s := CreateNewSynset(w, pos, gloss);
[image:6.595.48.285.500.688.2]at any point of time during the navigation or search processes. To deal with this point we introduce the concept of “working language”. If the user sets a language and initiates search for a word then the chosen language setting is considered as the working language of the system, and it will apply also for the subsequent CRUD operation. To indicate the system’s current working language a small flag on the top of the system can be used.
6.2
Spotlight View
At any point of time during navigation, the user might want to see a specific part of the information in another language. For example, an Italian user who also speaks English might want to see the English description of an Italian sense. We introduced the idea of Spotlight view to visualize the specific part of a information (e.g., a sense in another language) in other language or languages while maintaining the context. We can do this in two different ways:
1. Selecting any specific part (e.g., synset or concept) and changing the working language. This will affect the selected object as well as those information that are linked with it. For example, if a synset is selected and we change the language, then the concept of this synset and the concept hierarchy will change according to the chosen language.
2. Visualizing the information in different languages simultaneously by expanding the sense block. In this case, the block will be expanded and the senses/synset in other languages will appear as a separate block under that corresponding sense. On the right side of each sense/synset block there can be a flag indicating the language (e.g, for Italian ) of the corresponding block.
7.
DESIGN PRINCIPLE
The console is divided into two different parts , this grouping we made according to the kind of operations , precisely : 1) “Search and navigation” and 2) “CUD (create/update/delete)” part. Further, the “Search and navigation” part is divided into three different panels namely: (a) Words panel (b) Synsets panel and (c) Concepts panel. Each part is responsible for a set of related functionalities. In visualization theory it is illustrated how parts of a whole working together to achieve a specific goal.[10] From operational point of view “Search and navigation” and CUD operations are different. Therefore it is essential to supply clear visual[11] clues to identify the separation among them and understand which interface elements are related to one another so that the end user of the application can promptly identify organization and make sense of how to use or interact with it.
The principal of Proximity and Similarity have obvious relevance to the layout design. According to Proximity principal objects that are close to one another are tend to be perceived as group , we arranged all the navigation panels closer together horizontally and all the CUD related panels closer together horizontally on the bottom. This particular arrangement of panels gives us an impression as to which interface panels are related to one another. To make the user visual communication even stronger towards the grouping we applied the principle[12] of similarity. According to the Similarity principle there are many ways (e.g., color, size, shape, dimension, texture, and orientation etc) to make objects to be perceived as being related. In some of the cases, we have used Gestalt principles[10] to address the perception of the whole formed with discrete visual elements and serves as a useful guideline for graphical user interface design. Figure 9 describes our whole implementation console which shows each of the panels individually and one of the operating sequences could be found.
In our design to make the search and navigation parts similar therefore related, and so the CUD parts, we applied the size property, in particular the height of the panels.
We make the height of the entire search and navigation panels the same. In the same way we make the height of all the panels dedicated to CUD are same. The combination of these two properties enables us to make a clear separation between search and navigation. The peculiarity of this prototype is that it is very “space efficient” while maintaining the navigation context. In addition to structural clarity, this design provides simple navigational structure to explore the challenging manifestation of the complexities of linguistics and concept knowledge.
8.
CONCLUSION
We have presented our approach on information visualization and management of linguistic and concepts/ontologies. In our visualization method we represent ontology as a directed acyclic graph (DAG). This graph structure is based on a tree hierarchy and a Parent/Children List to visualize and navigate the resulting concept hierarchy as a DAG based on the sense/synset selection from the Senses panel. Because the visualization of all the connections between the concepts can be cluttering, we provide the user the possibility to filter the relations and get the requested part of the ontology. We also rationalized the design with appropriate theories wherever needed.
9.
REFERENCES
[1] N.F. Noyn and Mcguiness D. L, Ontology development 101: A guide to creating your first ontology‖. In Stanford Knowledge Systems Laboratory Technical Report KSL-01-05 and Stanford Medical Informatics Technical Report SMI-2001-0880, 2001.
[2] Fausto Giunchiglia, Biswanath Dutta, Vincenzo Maltese, ―Faceted Lightweight Ontologies‖. Conceptual Modeling: Foundations and Applications 2009: 36-51 [3] Katifori, A., Torou, E., Halatsis, C., Lepouras, G. &
Vassilakis, C.. A Comparative Study of Four Ontology Visualization Techniques in Protégé: Experiment Setup and Preliminary Results, Proceedings of the IV 06 Conference. 2006
[4] A. Bosca, D. Bomino, and P. Pellegrino. Ontosphere: more than a 3d ontology visualization tool. In SWAP, the 2nd Italian Semantic Web Workshop.
[5] C. Plaisant, J. Grosjean and B.B. Bederson, “SpaceTree: Supporting Exploration in Large Node Link Tree, Design Evolution and Empirical Evaluation,” In Proceedings of IEEE Sym-posium on Information Visualization, pp. 57-64, 2002.
[6] A. Cockbrun and B. McKenzie, Evaluating the Effectiveness of Spatial Memory in 2-D and 3-D Physical and Virtual Environments. In Proc. ACM Conf. Human Factors in Computing Systems (CHI 2002), pp. 203-210, 2002.
[7] Herman, I., Melanc¸On, G., Aand Marshall M. S. Graph visualization and navigation in information visualization:
A survey. IEEE Trans. Visual. Comput/ Graph. Vol. 6, No. 1, January–March. 24–43. 2000.
[8] . Shneiderman, "The Eyes Have It: A Task by Data Type Taxonomy for Information Visu-alizations." Proc. 1996 IEEE Visual Languages, Sept. 1996, pp. 336-343. [9] George A. Miller. WordNet: A Lexical Database for
English. Communications of the ACM Vol. 38, No. 11: 39-41, 1995.
[10] J. Johnson. Designing with the Mind in Mind: Simple Guide to Understanding User Interface Design Rules. Elsevier, 2010.
[11] Spence Robert. nformation Visualization. Addison-Wesley, ACM Press,2001.
[12] An User Centric Interface for The Management of Past , Present and Future Events, Khandaker Tabin Hasan, 1-132. Phd Thesis.
[13] Fausto Giunchiglia, Biswanath Dutta , Vincenzo Maltese , Faceted lightweight ontologies, Conceptual Modeling: Foundations and Applications 2009: 36-51.
[14] Fausto Giunchiglia, Vincenzo Maltese, Feroz Farazi, Biswanath Dutta: GeoWordNet: A Resource for Geo-spatial Applications. ESWC (1) 2010: 121-136.
[15] RDF, see at: http://www.w3.org/RDF/
[16] Fausto Giunchiglia, Maurizio Marchese, Ilya Zaihrayeu: Encoding Classifications into Lightweight Ontologies. J. Data Semantics 8: 57-81 (2007).
[17] Fausto Giunchiglia, Mikalai Yatskevich, Pavel Shvaiko: Semantic Matching: Algorithms and Implementation. J. Data Semantics 9: 1-38 (2007).
[18] Paul Andr´e, M.L. Wilson, Alistair Russell, D.A. Smith, and Alistair Owens. Continuum: designing timelines for hierarchies, relationships and scale. In Proceedings of the 20th annual ACM symposium on User interface software and technology, pages 101–110. ACM, 2007.
[19] D. J. Mackinlay, George G. Robertson, and Robert DeLine. Developing calendar visualizers for the information visualizer. In Proceedings of the 7th annual ACM symposium on User interface software and technology, UIST ’94, pages 109–118, New York, NY, USA, 1994.
[20] Michael Denny. Ontology Building: A Survey of Editing Tools
http://www.xml.com/pub/a/2002/11/06/ontologies.html . [21] Gerald M. Karam. Visualization using timelines. In
ISSTA, pages 125–137, 1994.
[22] Allen B. Robert. Visualization, causation, and history. In Proceedings of the 2011 iConference, iConference ’11, pages 538–545, 2011.