Locally Adaptive De-Speckling of SAR Image using
GCV Thresholding in Directionlet Domain
Sethunadh R
Vikram Sarabhai Space Centre Indian Space Research Organisation (ISRO)
Trivandrum, Kerala, India
Tessamma Thomas
Department of Electronics
Cochin University of Science & Technology Cochin, Kerala, India
ABSTRACT
Speckle noise usually occurs in Synthetic Aperture Radar (SAR) images due to coherent radiation. Speckle reduction is a mandatory step prior to the processing of SAR images. Here a novel de-speckling scheme is presented which is in line with the wavelet transform based schemes with several modifications due to the implementation of directionlet transform. As in any transform based de-speckling schemes, the directionlet based de-speckling also involves mainly three steps. First transform the input image using an orthogonal transform, then threshold the transform coefficients using a non-linear algorithm and finally reconstruct the image using the modified coefficients. The effectiveness of a despeckling algorithm basically depends on two factors- one is the efficient representation of the image to be despeckled using a local, directional and multi resolution expansion and second is the efficient computation of an optimal threshold. Here the first requirement is met by using a locally adaptive directionlet transform and the second by optimal threshold computation using Generalized Cross Validation (GCV) technique. Experimental results on simulated and actual SAR images show that minimizing GCV in the directionlet domain results in better de-speckling performance when compared to minimizing it in the wavelet domain. The proposed scheme outperforms many of the traditional de-speckling schemes in terms of numeric and perceptual quality.
General Terms
SAR Image de-speckling
Keywords
Directionlet Transform, SAR image, De-speckling, Generalized Cross Validation.
1.
INTRODUCTION
SAR imaging has emerged as an important tool for earth observation and resource monitoring. It has applications in high-resolution remote sensing, mapping, surveillance etc. The minimum constraints on time-of-day and atmospheric conditions make SAR imaging ideal for many airborne systems and remote sensing satellites. The SAR imaging system is based on coherence radiation in that the noise level increases with the magnitude of the radar back scattering [1]. SAR images are inherently degraded by multiplicative speckle, which makes them more difficult to analyze and interpret. The speckle degrades the quality of the images and makes interpretation, analysis and classification difficult. Therefore, some speckle reduction scheme is necessary prior to the processing of SAR images.
The speckle noise can typically be modeled as a multiplicative independent and identically distributed (iid) random noise.
The de-speckling of SAR image involves a preprocessing step consisting of a logarithmic transformation to converts the multiplicative noise model to an additive noise model. The effect of speckle in SAR images can be reduced either during the image formation time or later. The former method is based on multi-look incoherent averaging [1] which improves the SAR image by averaging the uncorrelated images from non-overlapping spectrum. But this causes reduction in spatial resolution. The later method is based on image domain filtering like spatial filtering or transform-domain filtering. The spatial filtering schemes include Frost filter [2], Kuan Filter [3], Lee filter [4] and Gamma MAP filter [5]. These schemes use a defined filter window to estimate the local noise variance of the speckled image and perform the individual unique filtering process. Even though these techniques, with low computational complexity, greatly reduce the speckle level in homogeneous areas they over smooth heterogeneous areas in the image due to losses at contours and edges in images.
The transform domain filtering mainly involves thresholding of wavelet coefficients for noise removal. This scheme in different forms were successfully applied by different authors for speckle removal in SAR images [6, 7, 8]. These methods rely on the principle that the noise will predominantly dominate the wavelet coefficients at finer scales and a few large coefficients only will represent the relevant information of the image. Thus, effective thresholding of the noisy wavelet coefficients is possible. Comparative study between spatial and wavelet transform-domain filtering for SAR images show that the wavelet-based approach is among the best for speckle removal [9].
separable convolution and filter design due to the non-rectangular division of frequency spectrum.
The directionlet transform was proposed by Vladen et al as an anisotropic perfect reconstruction and critically sampled basis functions with directional vanishing moments along any two directions [15]. At the same time it retains the simplicity of standard separable 2-D WT in terms of 1-D processing and filter design.
Finding an optimal threshold plays a key role in the transform domain filtering. Since the work of Donoho & Johnstone [16] who proposed the most popular soft thresholding strategy, many alternative methods have come forth. Donoho and Johnstone pioneered the theoretical formalization of filtering additive independent and identically distributed (i.i.d) Guassian noise via thresholding wavelet coefficients [17]. The universal threshold choice proposed by Dohono yield overly smoothed images as the threshold value can be unwarrantedly large due to its dependence on the number of samples. Later many other threshold computation schemes like SURE, Bayes etc were proposed by many authors. These were successfully implemented in wavelet based denoising schemes. The main drawback in all these schemes is that they require the knowledge of amount of noise present in the image to compute an optimum threshold.
The GCV technique proposed by Jansen et al [18] was proven to be an effective statistical way for estimating an optimum threshold for noise removal in many denoising application. The main advantage of GCV method is that it can be used to estimate the optimal threshold without having the knowledge of the noise variance. The GCV is only based on the input data and its minimum is a good approximation for the optimal threshold. It was proved that the minimum of the GCV is an asymptotically optimal threshold for denoising applications. This paper investigates the possibility of using GCV in SAR image de-speckling based on an optimized, locally adaptive and scale dependent thresholding scheme in directionlet domain.
The rest of the paper is organised as follows. In section 2, the theoretical concepts of Directionlet Transform are presented. Section 3 explains the speckle noise model and GCV thresholding scheme. The proposed speckle reduction algorithm based on directionlet is presented in section 4. Experimental results with simulated and actual speckle images and the comparison with traditional de-speckling schemes are given in section 5
.
2.
DIRECTIONLET TRANSFORM
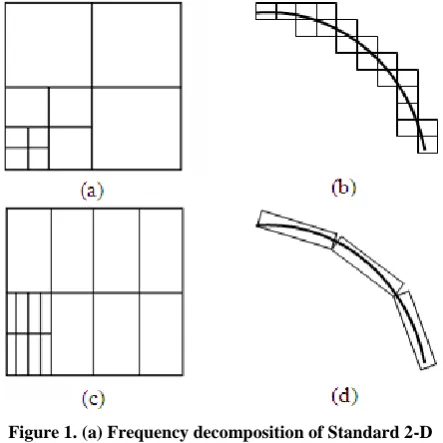
The standard 2-D Wavelet Transform (WT) is realized using 1-D transforms containing filtering and sub sampling operations along vertical and horizontal directions. The number of these 1-D transforms is same at each scale in 2-D WT as shown in figure 1(a). The main problem with this type of isotropic nature is that it cannot properly capture the anisotropic discontinuities present in images. This is because the directions of the transforms and discontinuities in images are not matched and the transforms fail to provide a compact representation of two dimensional signals. Many wavelets intersect the discontinuity and this leads to many large magnitude coefficients as shown in figure 1(b). So due to the spatial isotropy of its construction, the standard 2-D WT is an inefficient tool for analysing 2-D signals like images.
In the anisotropic wavelet transform (AWT(n1,n2)), the
number of transforms applied along the horizontal and vertical directions is unequal, that is there are n1 horizontal and n2
vertical transforms at each scale, where n1 is not necessarily
equal to n2. The iteration process is continued in the low pass
sub-band, like in the standard wavelet transform as shown in figure 1(c). The elongation of the basis functions of the AWT(n1, n2) is determined by a factor called anisotropic ratio,
ρ = n1/n2.The AWT can trace the discontinuity efficiently with
fewer significant coefficients compared with standard WT due to the spatial anisotropy of its construction as shown in figure 1(d).
Figure 1. (a) Frequency decomposition of Standard 2-D WT and (b) its basis functions. (c) Frequency decomposition of AWT (2,1)and (d) its basis functions.
The anisotropic wavelet transform is implemented as a stage transformation. The AWT (2, 1) produces eight bands as shown in Figure 2. At the first stage the rows of the image to be transformed are low pass (L) and high pass (H) filtered and down sampled by two. In the next step each column of the row filtered image is again low pass (L) and high pass (H) filtered and down sampled by two. The output of this will have four sub band images labeled as LL, HL, LH and HH. As a next step each row of these sub band images are again low pass (L) and high pass (H) filtered and down sampled by two. This will produce eight bands viz. HHH, HHL, HLH, HLL, LHH, LHL, LLH, and LLL. Now the LLL subband image goes through the same process of filtering and down sampling to form the next stage of the structure.
The main problem with AWT is directional interaction. The lattice based transform can avoid the directional interaction. Here the discrete space is first partitioned using integer lattices before performing 1-D filtering along lines across the lattice. Any integer lattice Λ is a sub-lattice of the cubic lattice Z2. Here the lattice Λ can be represented by a non-unique generator matrix MΛ.
MΛ = (1)
Here a1, b1, a2, b2∈ Z. and d1 and d2 are two linearly
independent integer vectors. The linear combination of these two vectors will form the points of the lattice Λ. The cubic lattice Z2 can be partitioned into cosets of the lattice Λ.
[image:2.595.318.540.205.427.2]pixels along the vector d1 (transform direction) in each of the
cosets separately. Since these operations are applied in each cosets separately, the pixels retained after this are clustered along the vector d2 (alignment direction). This type of lattice
based transform, which will avoid directional interaction, is called Skewed AWT, denoted as S-AWT (MΛ, n1, n2). The
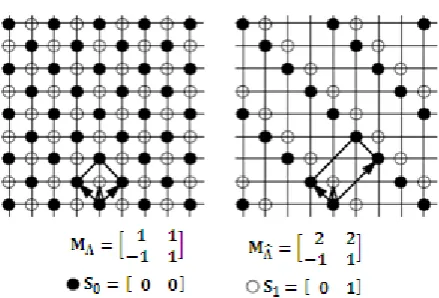
[image:3.595.55.276.183.329.2]basis functions of S-AWT are called directionlets, which can be effectively used for directional analysis of images. An example of construction of directionlets based on integer lattices is shown in Fig. 3 for pair of direction (45º, -45º).
Figure 2. Filtering scheme for the AWT (2, 1), where one step of iteration is shown.
Figure 3.An example of construction of directionlets based on integer lattices for pair of directions (45º, -45º).
The directionlet transform is not shift invariant due to the presence of down sampling operation involved. The down sampling operation results in a time-variant translation and has difficulties preserving original image discontinuities in the directionlet domain. So shift invariance is a desirable property for image denoising applications. The Undecimated Directionlet Transform (UDT) can be constructed by avoiding the down sampling operation in the decomposition level. Thus the approximation and detail coefficients at each decomposition level are having the same length as the original signal. Here in the proposed scheme UDT was used for the decomposition of SAR images.
3. SPECKLE NOISE MODEL AND GCV
BASED THRESHOLDING
Here the speckle noise model [1] and the basic concepts of GCV thresholding [18] are reviewed.
3.1 Speckle noise model
Here the following model of a discrete noisy image is considered:
(2)
Where y is the input noisy image, f is the unknown desired image and e is the multiplicative speckle noise, which typically can be modeled as a multiplicative i.i.d. Gaussian noise. Logarithmic transformation of speckled image converts the multiplicative noise model to an additive noise model.
(3)
Here ln is the logarithmic transform operator. If W is a non redundant, orthogonal discrete wavelet transform operator then a multi-resolution representation of y is given by the equation
(4) This can be represented as
(5)
The wavelet transform concentrates the important image features in a limited number of wavelet coefficients and the noise energy to all the coefficients. So the noise has small influence on the large signal coefficients. To reduce the contribution of these small noisy coefficients, a soft thresholding operation is applied to all the wavelet coefficients except those of the lowest scale. A soft threshold operation will set all the wavelet coefficients below the threshold (between to ) to zero, while others are shrunk in absolute value to obtain .
(6)
Finally, the speckle-reduced image is obtained from the synthesis part of the discrete WT of the enhanced subband image . The main problem here is the selection of an appropriate threshold. If this threshold is large, important image features will be lost. On the other hand, a small threshold will result a still noisy image. The optimal threshold for subband j, optimizes the mean square error
(7)
Where is the number of coefficients in the subband j, is the vector of threshold applied noisy coefficients and is the vector of noise-free coefficients. Here, because is unknown the function is not computable and hence it cannot be used to compute an optimal threshold .
3.2 Generalized Cross Validation
In GCV technique, the original image f is assumed to be regular so that fi can be approximated by a linear combination
of its neighbors. So by considering the estimate of yi
(represented as ), as a combination of its neighbors, we can eliminate the noise in this particular component. This is repeated for all the components and the compromise can be estimated as Ordinary Cross Validation (OCV) using the following equation:-
(8)
The estimate of yi can be computed in many ways. By
[image:3.595.58.278.359.508.2]
(9)
Where is the number of wavelet coefficients that were replaced by zero. This is a function of known parameters of the input image and is independent of the noise variance. It was established by Jansen et al [18] that minimizing the mean square error is equivalent to minimizing the GCV. So the value corresponding to the minimum of the GCV function can be used as the optimal threshold.
4. DE-SPECKLING IN DIRECTIONLET
DOMAIN
A transform based on direction of texture with edge information in an image can greatly improve its sparse representation and also the precision of estimation of correct threshold. Thus it is important to identify the dominant direction of texture before thresholding. The directionality in an image is a local feature which can vary over space. Therefore it is ideal to find out the directionality in an image locally after spatially segmenting it into small patches. The directionlet transform can have anisotropy and directional vanishing moments along any two directions with rational slopes. In the proposed scheme the input image is first segmented in a quad tree structure and directionlet transform is taken along multiple directions from the set
These sets are chosen in such a way that the cubic lattice is not divided into more cosets [15]. The best pair of directions ∈ is chosen for each segment indexed by n as follows [15].
∈
where represent the wavelet coefficients which are produced by applying directionlets to the nth segment along the pair d of directions. The assigned pair of transform directions of each patch across the input image forms a directional map of that image and provides the best matching between transform and locally dominant directions for that segment. For segments with no apparent dominant directions, the pair ( ) is assigned by default to smooth segments, for the reason of simplicity of implementation of the directionlet.
After identifying the dominant direction in each spatial segment, multi scale directionlet transform is applied along the dominant directions and the directionlet coefficients are selected for thresholding using GCV. In the directionlet decomposition, the subbands HHHk, HHLk, HLHk, HLLk,
LHHk, LHLk and LLHk, k=1, 2, 3….J are called the details,
where k is the scale, with J being the largest scale in the decomposition. The subband LLLJ is the low resolution
residual. The directionlets retain orthogonality from standard wavelet transform and the coefficients in the subbands are independent and identically distributed with zero mean. Thus the image noise model presented in section 3 is applicable for directionlets also. The directionlet coefficient Yij from the
detail subbands are used for optimal threshold computation using GCV technique to obtain ij. The denoised estimate is
then , where is the inverse directionlet transform operator. The full de-speckling algorithm proposed in the paper can be summarised in three steps as follows:-
Step 1: Directionlets and Directional Map
The noisy image is first quad tree segmented till a desired level of segmentation is achieved.
Make a logarithmic transformation (log (y+1.0)) of the segmented image to convert multiplicative noise to additive noise. Here 1 is added to prevent zero become -∞ after logarithmic transformation.
Apply directionlet transform to the segments along the
pair of directions
Compute optimal pair of directions for each segment using equation (10)
Compute the multi scale directionlet transform along the dominant directions
Step 2: Threshold Computation
For each subband, except the LLLj subband, compute
the GCV threshold which minimizes the parameter given in equation (9).
Apply the computed threshold to the subband coefficients using soft thresholding rule to estimate the best value for the noise-free coefficients
Step 3: Reconstruction
Reconstruct the image from the above processed sub-bands and the low-pass residual (LLLj) using inverse
directionlet transform and the directional map.
Invert the logarithmic transformation to obtain the despeckled image
5. RESULTS AND DISCUSSIONS
In this section, we demonstrate the efficacy of the proposed method using a simulated and an original SAR image. Here we have used Equivalent Number of Looks (ENL) as the performance parameter for assessing the performance of speckle reduction. ENL is a commonly used parameter to measure the smoothing effects in the de-speckled image, which is defined as:
(11)
Where and are the mean and variance values respectively over a homogeneous area in the image. Since the mean value reflects the average brightness of a SAR image, the sustainment of it is important to image calibration. Variance of image denotes the range at which the pixels in an image deviate from the mean. A lower Variance gives a cleaner and smoother image. So the denoised image should sustain the mean of image and decrease its variance and therefore should have a higher ENL. However ENL is not a good measure of despeckling performance in heterogeneous areas of an image. Thus the subjective quality of the despeckled image through visual examination is also important.
were shrunk using soft thresholding with a threshold value computed for each subband and sub-levels through GCV method. The LL subband in WT and LLL subband in directionlet scheme were kept unchanged. To reduce computational complexity, the GCV was computed only for 512 pixels for a segment of size 32X32. These pixels were selected using an equidistant sampler. A typical GCV curve of a sub-band of directionlet transform is shown in Figure 5.
Figure5. Typical GCV Curve of a sub-band of directionlet Transform
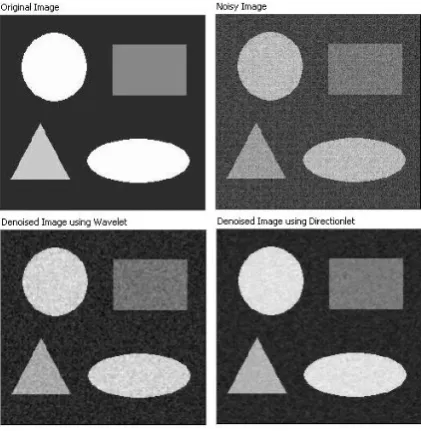
Fig. 6 shows a simulated SAR image, its noisy version and despeckled images obtained by wavelet and directionlet based schemes. The simulated image contains three regions- viz. a circle, a rectangle and a triangle of intensity 150, 200 and 250 respectively on a background of intensity 80. The original image is multiplied by Gaussian noise of mean 1 and variance 0.05. The one-dimensional data extracted from 110th row of the test image is given in figure 7. It is clearly evident from these figures that the noise reduction is much better in directionlet based scheme than the WT based one.
Figure.6. Image de-speckling using the proposed method applied on simulated SAR image. Noise free image (top left), noisy image (top right), de-speckled image using WT (bottom left), de-speckled image using directionlet (bottom
right).
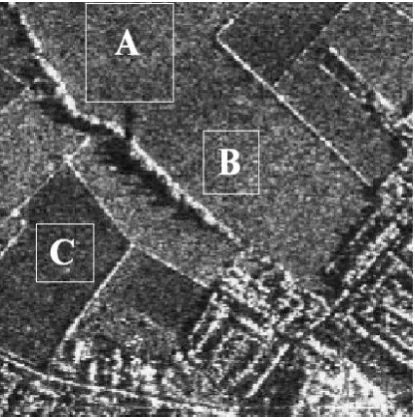
Fig. 8 shows a real noisy SAR image of Bedfordshire. A visual comparison of the despeckled images obtained by different methods is given in figures 9 to 13. Three
[image:5.595.319.532.232.533.2]homogeneous regions used to compute the ENL has been highlighted in the noisy SAR image. Since Bedfordshire is an amplitude SAR image, the ENL was computed using equation (11) in amplitude format. The ENL values obtained by the different methods are listed in Table 1. Note that the proposed method provides a substantial improvement in terms of ENL over the other methods, means it de-speckles the noise more efficiently. Also the visual quality of the de-speckled image using the proposed scheme is evidently better because of sharper edges and texture. The Gamma MAP filter smoothes speckle noise and gives better ENL among tradition schemes, but edges are blurred and regions around the edges contain significant artifacts. Even though the wavelet based scheme removes speckle effectively Gibbs phenomena exists in uniform regions and also the edges are blurred.
Figure 7 One-dimensional data extracted from 110th row of test image given in figure 6.These plots are presented in
the order from top to bottom: Original image (in blue colour) and speckled image (in red colour), Original image
[image:5.595.62.273.463.679.2]and de-speckled image using wavelet and directionlet
Table.1. ENL values for the different Despeckling schemes applied on Bedfordshire image
Despeckling Scheme
ENL Region
A
Region B
Region C Real SAR Image 2.98 3.39 2.72
Frost Filter 7.01 8.31 6.89
Lee Filter 8.69 10.95 10.52
G MAP Filter 9.29 12.29 9.611
[image:5.595.319.541.625.756.2]Figure.8. The original SAR image of Bedfordshire
[image:6.595.325.533.78.487.2]Figure.9 The de-speckled image using Frost filter
Figure.10 The de-speckled image using Lee filter
[image:6.595.65.271.304.512.2]Figure.11. The de-speckled image using Gamma MAP filter
Figure.12 The de-speckled image using wavelet based scheme
[image:6.595.65.272.511.738.2] [image:6.595.324.535.533.741.2]6. CONCLUSIONS
In this paper a novel SAR image de-speckling scheme based on multi directional and anisotropic wavelet transform called directionlet is presented. The GCV based thresholding scheme employed in wavelet domain has been extended to the directionlet domain to extract the better directional features of directionlets. The main advantage of the GCV based thresholding is that the knowledge of the noise level is not required for the optimum threshold computation. Since the directionlets possess spatial anisotropy and better directional capabilities, GCV thresholding in directionlet domain results in visually appealing de-speckling results, with improved performance parameters. Experimental results on real SAR image show that the proposed method achieves effective despeckling performance compared with traditional spatial filtering and wavelet based schemes in terms of both subjective visual quality and details preservation. Future work is to find out a faster method to identify the dominant local directions in an image and applying more effective threshold schemes in directionlet domain.
7.
ACKNOWLEDGMENTS
The authors would like to thank the editor and the anonymous reviewers for valuable comments and suggestions that helped to improve the clarity of presentation of this paper.
8.
REFERENCES
[1] J.W. Goodman, “Some fundamental properties of speckle,” J. Opt. Soc. Amer., vol. 66, pp. 1145–1150, Nov. 1976.
[2] V. S. Frost, J. A. Stiles, K. S. Shanmugan, and J. C. Holtzman, “A model for radar images and its application to adaptive digital filtering of multiplicative noise,” IEEE Trans. Pattrn Anal. Machn Intell., vol.4, pp.157–166, 1982.
[3] D. T. Kuan, A. A. Sawchuk, T. C. Strand, and P. Chavel, “Adaptive noise smoothing filter for images with signal-dependent noise,” IEEE Trans. Pattern Anal. Machine Intell., vol. 7, pp. 165–177, 1985.
[4] J. S. Lee, “Speckle analysis and smoothing of synthetic aperture radar images”, Computer Graphics Image Processing, 16(4), pp. 24-32, 1981.
[5] A. Baraldi and F. Parmigiani, “A refined Gamma MAP SAR speckle filter with improved geometrical adaptivity,” IEEE Trans. on Geosci.and Remote Sensing, vol. 33, pp. 1245–1257, Sept. 1995.
[6] Argenti F, Alparone L. “Speckle removal from SAR images in the undecimated wavelet domain” IEEE Trans. Geosci. Remote Sensing, 2002, 40(11): 2363–2374. [7] T. Bianchi, F. Argenti, and L. Alparone,
“Segmentation-based MAP despeckling of SAR images in the undecimated wavelet domain,” IEEE Trans. On Geoscience and Remote Sens., vol. 46, no. 9, pp. 2728– 2742, Sep. 2008.
[8] F. Argenti, T. Bianchi, A. Lapini, and L. Alparone, “Fast MAP Despeckling based on Laplacian-Gaussian modeling of wavelet coefficients,” IEEE Geosci. Remote Sens. Lett., vol. 9, no. 1, pp. 13–17, Jan. 2012.
[9] L. Gagnon and A. Jouan, “Speckle filtering of SAR images-A comparative study between complex-wavelet
based and standard filters,” Proc. SPIE, vol. 3169, pp. 80–91, 1997.
[10] Q. Sun, L. Jiao, and B. Hou, “Synthetic aperture radar image despeckling via spatially adaptive shrinkage in the nonsubsampled contourlet transform domain,” J. Electron. Imag., vol. 17, no. 1, pp. 013013(1)– 013013(13), Mar. 2008.
[11] R Tao, H Wan, and Y Wang ‘Artifact-Free Despeckling of SAR Images Using Contourlet’ IEEE Geosciences and remote sensing letters, vol. 9, No. 5, September 2012 [12] B. B. Saevarsson, J. R. Sveinsson, and J. A.
Benediktsson, “Speckle reduction of SAR images using adaptive Curvelet domain”, in Proc. of IEEE Int. Geosci. and Remote Sensing conf., 2003, pp. 4083-4085. [13] W Zhang, F Liu, L Jiao, B Hou, S Wang, and R Shang
‘SAR Image Despeckling Using Edge Detection and Feature Clustering in Bandelet Domain’ IEEE Geo. and remote sensing letters, vol.7, No. 1, January 2010 [14] B. Hou, X. Zhang, X. Bu, And H. Feng, ‘SAR Image
Despeckling Based On Non-sub-sampled Shearlet Transform’ IEEE Journal of selected topics in Applied Earth Obs. and Remote Sens., Vol. 5, No. 3, June 2012 [15] VladanVelisavljevic, BaltasarBeferull-Lozano, Martin
Vetterly and Pier Luigi Dragotti.“Directionlets: Anisotropic Multi directional Representation with Separable Filtering”, IEEE Transaction on Image processing, Vol 15 Issue 7, pp.1916-1933, July 2006 [16] D. L. Donoho, “Denoising by soft-thresholding,” IEEE
Trans. on Info. Theory, 41(3), pp. 613-627, May. 1995. [17] D. L. Donoho, and I. M. Johnstone, "Ideal spatial
adaptation via wavelet shrinkage," Biometrika, 81, pp. 425-455, 1994.
[18] M. Jansen, M. Malfait and A. Bultheel, “Generalized cross validation for wavelet thresholding,” Signal Processing, 56(1), pp. 33-44, Jan 1997.
9. AUTHOR BIOGRAPHY
Sethunadh R received his B. Tech degree in Electronics & Communication Engg. from University of Kerala and M. Tech degree in digital electronics with first rank from Cochin University of Science and Technology, Cochin, India. He started his career in airworthiness certification at Indian Defence Research and Development Organisation (DRDO) in 1995. Since 1997 he has been with Vikram Sarabhai Space Centre, Indian Space Research Organisation (ISRO), engaged in launch vehicle development program. He is also pursuing his Ph. D at Department of Electronics, Cochin University of Science and Technology. His research interest includes image processing, computer vision, signal processing, test automation etc.