Evaluation of Different Time and Frequency Domain
Features of Motor Neuron and Musculoskeletal Diseases
Shaikh Anowarul Fattah
Department of EEE
Bangladesh University of Engineering & Technology Dhaka-1000, Bangladesh
A. B. M. Sayeed Ud Doulah, Marzuka Ahmed
Jumana
2, Md. Asif Iqbal
3Department of EECE
Military Institute of Science and Technology (MIST) Dhaka, Bangladesh
ABSTRACT
Motor neuron and musculoskeletal diseases are the most frequently inherited muscular disorders. Motor neuron diseases are mostly found among people within 35-70 years of age, which selectively affect the motor neurons. Amyotrophic lateral sclerosis (ALS) is the most common variant of motor neuron diseases that progressively degenerates the motor cells in the brain and spinal cord, so that the muscles no longer receive signals to move. As a result, the body becomes paralyzed, which means that the muscles no longer work. On the other hand, one of the most common musculoskeletal diseases is myopathy which causes the weakness of the muscles. Muscle cramps, tautness and spasm are also associated with myopathy. One of the possible ways to investigate the indispensable features of the ALS and myopathy diseases independently in individuals is to analyze the electromyography (EMG) signals that are basically electrical signals originated from the muscles. In this paper, a classification scheme is developed to distinguish the ALS or myopathy affected signals from the normal ones based on some time and frequency domain operations, such as autocorrelation, zero crossing rate and Fourier transform. It is found that the proposed time and frequency domain features extracted from the EMG signals exhibit distinguishable characteristics for the case of ALS and myopathic diseases. For the purpose of classification, K-nearest neighborhood classifier is employed in a leave-one out cross validation technique. In order to show the classification performance, an EMG database consisted of 6 normal subjects aged 21-37 years, 6 ALS patients aged 35-67 years, and 6 myopathic patients aged 19-63 years is considered. From the experimentation on this database, it is found that the proposed method is capable of distinctly separating the ALS and myopathic patients based on the respective EMG signals.
General Terms
Biomedical signal processing, pattern recognition, data classification.
Keywords
Amyotrophic lateral sclerosis (ALS), autocorrelation, electromyography (EMG), feature extraction, Fourier transform, KNN classifier, myopathy, zero crossing rate.
1.
INTRODUCTION
Apart from clinical diagnostics, different biomedical signals can serve as reliable source of disease classification. The electromyography (EMG) signal is a biomedical signal that is used for analyzing different features of muscle activities [1-2]. It is obtained via electrical response generated in muscles
complicated characteristics since it is dependent on the anatomical and physiological properties of muscles and controlled by the nervous system. A good understanding of the EMG signal can lead to successful clinical diagnosis for different biomedical applications. One of the important application areas is the identification of motor disability. The structural unit of contraction is the muscle fibre. An EMG signal is the train of motor unit action potential (MUAP). The shapes and firing rates of MUAPs in EMG signals render significant source of information for the diagnosis of neuromuscular disorders.
The EMG signal can be acquired either invasively by inserting the wire or needle electrodes directly in the muscle or non-invasively by using conductive elements or electrodes on the skin surface. The surface EMG (sEMG) is a more popular approach of recording the information present in the muscle action potentials. In the process of acquiring sEMG signal from the electrodes mounted directly on the skin, it is found that the signal consists of all the MUAPs occurring in the muscles. As these action potentials occur at random intervals, the generated voltage corresponding to the EMG signal may be either positive or negative. Combination of the muscle fiber action potentials generated from all the muscle fibers of a single motor unit, namely the MUAP, can be detected by a skin surface electrode (non-invasive) placed near this field, or by a needle electrode (invasive) inserted in the muscle [3]. In view of analyzing the EMG signal, generally it is first picked up from the electrodes, amplified using differential amplifiers and then pre-processed to eliminate low- and high-frequency noises and possible artifacts. Finally, the noise-reduced signal is rectified and averaged in some format to indicate the EMG amplitude. Surface EMG is the more common method of measurement, since it is non-invasive and can be conducted by personnel other than physicians with minimal risk to the subject. Measurement of sEMG is dependent on a number of factors and its amplitude varies from the microvolt to a low millivolt range [1]. The time and frequency domain properties of the sEMG signal depend on different factors, such as the timing and intensity of muscle contraction, the distance of the electrode from the active muscle area, the properties of the overlying tissue (e.g. thickness of overlying skin and adipose tissue), the electrode and amplifier properties and the quality of contact between the electrode and the skin [4-5].
International Journal of Computer Applications (0975 – 8887) Volume 43– No.23, April 2012
messages from the brain to the spinal cord and lower motor neurons send messages from the spinal cord to the muscles. Hence the motor neurons are the most important part of the body's neuromuscular system. The ALS disease damages motor neurons in the brain and spinal cord. It causes these motor neurons to shrink and disappear, so that the muscles no longer receive signals to move. As a result, the muscles become smaller and weaker. Gradually the body becomes paralyzed, which means that the muscles no longer work. The ALS can occur among young individuals, but it most commonly affects people between the ages of 35-70, with a slight male predominance. It is difficult to diagnose in the early stages because its symptoms may mimic other disorders. However, there are some clinical signs which may be treated as indication of damages either in the upper or in the lower motor neurons. A lower motor neuron lesion is characterized by muscle atrophy, weakness, fasciculation and cramps [6-7].
In general, myopathy is the disease of muscles. Muscle injury, infection, inherited disorders affecting muscle functions and thyroid diseases may cause myopathy. Myopathies which are caused by inherited genetic defects, by endocrine inflammatory and by immune inflammation are known as muscular dystrophies, polymyositis and dermatomyositis, respectively. Weakness of the large muscles (muscles of the center– proximal muscles) around the neck, shoulders and hip are the symptoms of myopathies observed frequently. Myopathy can be inherited from birth, but it is found mostly between the ages of 20 to 50. Women have chances of being infected by myopathy twice than the men. Sometimes regular therapy minimizes the severity of the disease. Again if less responsive to the treatment, especially in the case of inherited myopathies, condition of the patient worsens with time [8]. In view of classifying the ALS and myopathy diseases, one possible way could be analyzing the characteristics of the EMG signal. In order to observe the effect of ALS or myopathy diseases on the recorded EMG signal, in most of the cases, changes in values of some selected parameters are monitored and these individual parameters are achieved as a consequence of processing the EMG signal in time and frequency domains [9-10]. The objective of this paper is to develop a scheme to classify the ALS patients, myopathic patients and normal persons based on distinguishable characteristic features of the EMG signal. In this respect, some time and frequency domain features of the EMG signal are proposed with detailed experimental validation considering some standard EMG databases.
2.
PROPOSED METHOD
2.1
EMG Signal Analysis
Most of the biomedical signals exhibit a complex nature. Only a few of them, such as electrocardiogram (ECG) and electroencephalogram (EEG) have extensively studied in literature. Time variation pattern of the EMG signal is also very complicated in nature and thus it would not be a convincing approach to classify them directly based on the time variation of the data as observed. The variation in data pattern of the EMG signals obtained from a normal person and that obtained from an ALS or myopathic patient are generally not uniquely distinguishable. As a result, further detailed analysis using both temporal and spectral
representations would be definitely helpful in EMG data classification. It is well known that different time and frequency domain analyses turn out to be very effective for the analysis of transient signals [11]. Considering the computational simplicity and well acceptance in clinical practice, in this paper, fast Fourier transform (FFT) is used to obtain frequency domain features and for time domain, autocorrelation and zero crossing rates are utilized.
2.2
Frequency Domain Feature Extraction
2.2.1
Spectral feature
In order to investigate the spectral characteristics of the EMG signal, in the proposed method, only magnitude spectrum of the EMG signal is taken into consideration. Especial attention has been given on some specific spectral characteristics, such as spectral energy distribution pattern at different frequencies, tendency of concentrating maximum energy at any particular frequency, and average and peak spectral amplitude and frequency. For the purpose of spectral analysis, short time Fourier transform is employed, which is most widely used for the data analysis in areas, such as biomedical signal and image processing [12]. In particular, the fast Fourier transform (FFT) is used for determining the magnitude spectrum of the EMG signal. It is expected that within a short duration of the EMG data, the spectral behavior remains consistent. Hence from a long duration of the EMG recording, for short time spectral analysis, smaller frames are extracted by using windowing techniques. However, effect of windowing in time domain may generate unwanted ripples in spectral domain.
2.2.2
Mean Frequency
In the proposed feature extraction method, the frequency locations and amplitude values of the peaks of the magnitude spectra of the EMG signals at different frames have been carefully investigated. It is found that these values exhibit significant variation at different frames of the EMG data both in case of normal persons and patient’s groups. It is found that none of these parameters are consistently distinguishable. As an alternate, in this paper, we propose to utilize the mean frequency as spectral feature. Considering the product of the frequency and corresponding amplitude at each frequency points of the magnitude spectrum, the mean frequency is computed by taking the average of all such products throughout the entire spectrum. Since in this case both frequency and amplitude values have been given equal weights and all frequencies in the range are considered, a better feature consistency is thus expected.
2.3
Time Domain Feature Extraction
2.3.1
Autocorrelation
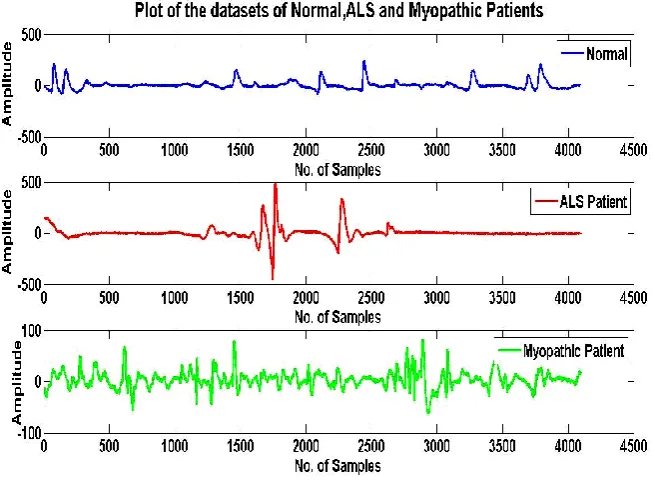
Fig. 1: EMG data pattern of a normal person, the ALS patient and the myopathic patient.
frames of EMG data have been investigated.For an N-length sequence of EMG data x(n), its autocorrelation function rx(m)
can be computed as
(
)
1
(
)
(
)
,
10
m N
n
x
x
n
x
n
m
N
m
r
(1)
where m denotes the correlation lag.
2.3.2
Zero-crossing rate (ZCR)
The zero-crossing rate (ZCR) expresses the number of times a signal crosses the axis of abscissas. It can be defined as
1
1
)]
1
(
sgn[
)]
(
sgn[
2
1
Nk
k
x
k
x
N
ZCR
(2)
where
0
,
1
0
,
1
]
sgn[
x
x
x
The random temporal fluctuations of the EMG signal may serve as distinguishable feature. Hence, the ZCR is also considered as a distinguishable feature to comment on the detection of diseases.
2.4
Classification
In pattern recognition, the k-nearest neighborhood algorithm (KNN) is one of the most reliable but simple method of classifying objects based on closest training examples in the feature space. KNN is a type of instance-based learning where the function is only approximated locally and all computations are deferred until the classification. In this paper, for the classification of the EMG data into two classes based on the time and frequency domain features, the KNN classifier is employed. Identification of ALS and myopathy affected signals are done through the classifier using this algorithm.
3.
EXPERIMENTAL DESIGN
For the purpose of experimentation, EMG signals recorded from different locations of the muscle with different levels of insertion are used. The experimental dataset is consisted of EMG signals collected from a group of normal persons and two groups of patients, one group with the ALS disease and the other one having the myopathy disease. In the normal control group, there are 6 normal subjects, 2 females and 4 males, all within the age limit 21-37 years. All of them are in general good physical shape and none had signs or history of neuromuscular or musculoskeletal disorders.The ALS patient group is consisted of 6 patients, 2 females and 4 males aged 35-67 years. Besides clinical and electrophysiological signs compatible with the ALS, 4 of them died within a few years after onset of the disorder, supporting the diagnosis of the ALS. In the myopathy patient group, there are 6 patients; 3 females and 3 males aged 19-63 years. All of them have sign of clinical and electrophysiological myopathy. The brachial biceps muscles were used in this study because they were the most frequently investigated in the normal and two patient groups [14].
International Journal of Computer Applications (0975 – 8887) Volume 43– No.23, April 2012
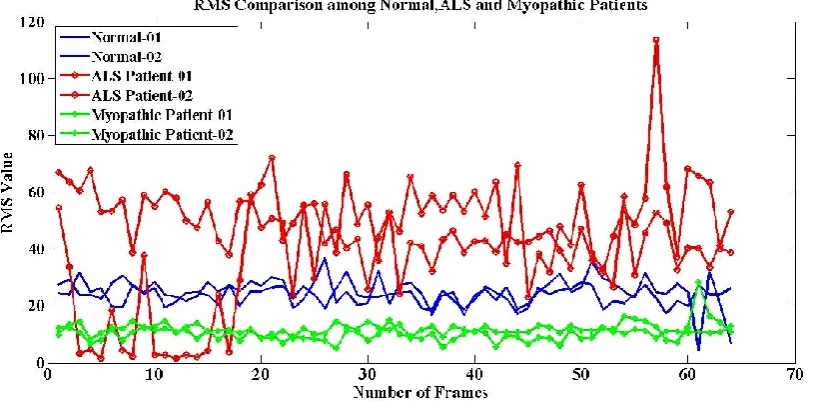
Fig. 2: RMS values obtained from each frame of the EMG data of normal person, ALS and myopathic patients.
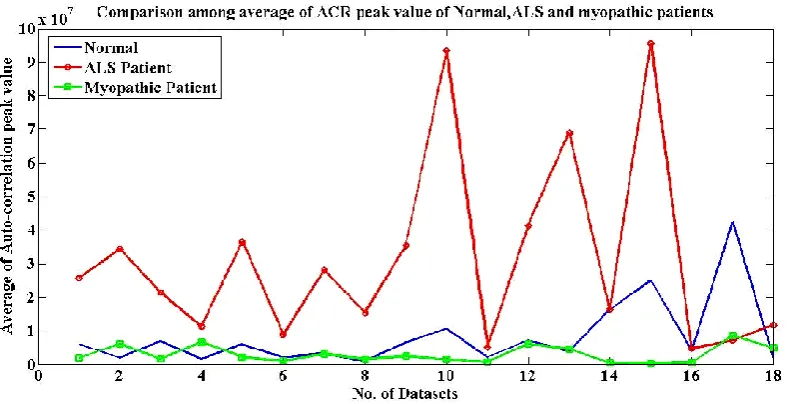
Fig. 3: Variation of average of peak value of the FFT with number of datasets for normal person, ALS and myopathic patients.
of the EMG data considering two normal persons, two ALS patients and two myopathic patients are plotted. It is found from the analytical results as well as from Fig. 2 that the RMS values corresponding to the ALS patients fluctuate abruptly in the initial and final frames but exhibit a stable range of values between 30 and 56 in the middle frames of every datasets. On the other hand, RMS values corresponding to a normal person and a myopathic patient show a steady range of values which does not exceed 28 and 20, respectively for all the frames in a dataset. Finally, 25 frames (from the 30th frame to the 55th frame) are selected out of 64 frames of the normal persons, ALS patients and myopathic patients for further processing to extract different features.
Since the energy of the EMG signal is mostly concentrated in the low frequency regions, a low pass filter is used to reduce the effect of high frequency regions. The low pass filtered EMG signal is then used for feature extraction. Proposed time and frequency domain features, such as magnitude spectrum, mean frequency, autocorrelation and ZCR are computed on an
individual frame basis. For all the cases of normal persons, the ALS patients and myopathic patients, average results obtained from 25 frames of every datasets are considered to construct the feature vector. Finally the KNN classifier is employed to classify the normal persons, the ALS patients and the myopathic patients.
4.
RESULT AND DISCUSSION
[image:4.595.103.496.314.507.2]Fig 4: Variation of average of autocorrelation peaks with number of datasets for normal person, ALS and myopathic patients.
Fig 5: Variation of average of ZCR values with number of datasets for normal person, ALS and myopathic patients.
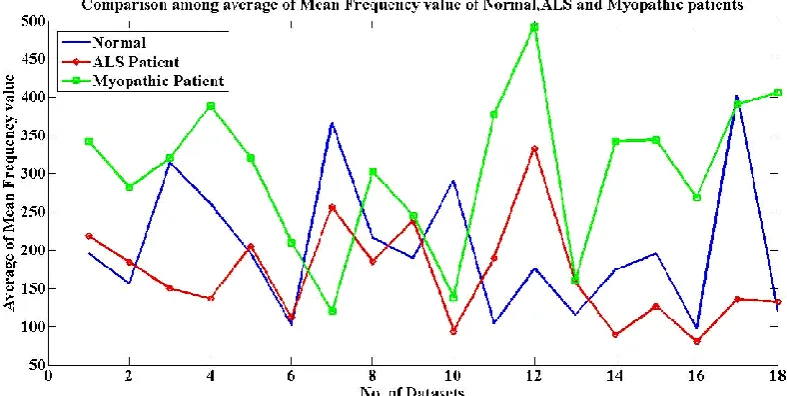
In Fig. 4, average zero lag values of the autocorrelation function of different datasets corresponding to normal persons, the ALS patients and the myopathic patients are shown. Here also a similar distinguishable behavior is observed among the normal persons, ALS and myopathic patients. It is clearly observed from Figs. 3 and 4 that the proposed features offer a high degree of separability between the two classes, which ensures a better classification accuracy. In Fig. 5, the average ZCR values of EMG signals of different datasets corresponding to normal persons, the ALS patients and the myopathic patients are shown. Unlike the previous two cases, in this case the degree of separability is not much satisfactory. In Fig. 6 the average mean frequency values of the magnitude specta of different datasets corresponding to normal persons, the ALS patients and the myopathic patients are shown. Here also a moderate degree of separability is obtained. Hence, it is expected that in comparison to the last two features, namely the ZCR and mean frequency, the first
In order to show the classification performance, each feature has been tested using the KNN classifier. The most widely used leave-one-out cross validation algorithm is utilized for the testing purpose. In this case, among several datasets only one dataset is taken away at a time for the purpose of testing against the remaining all datasets. Excluding the test dataset, remaining datasets are used for the training of the classifier. Depending on the classifier output value as defined in the group parameter of the classifier, the EMG signals are classified as normal or ALS or Myopathy affected EMG signals. Some statistical performance measures, such as specificity, sensitivity and accuracy are computed to investigate the classification performance. These statistical performance measures are defined as follows:
Specificity: Number of correctly classified normal subjects/number of total normal subjects.
Sensitivity: Number of correctly classified ALS (or myo-pathic) subjects/number of total ALS (or myomyo-pathic) subjects.
[image:5.595.97.499.315.507.2]International Journal of Computer Applications (0975 – 8887) Volume 43– No.23, April 2012
Fig 6: Variation of average of mean frequency values with number of datasets for normal person, ALS and myopathic patients.
Table 1. Performance of the proposed method in classifying the ALS patients and normal persons
Feature Accuracy
(%)
Sensitivity (ALS)
(%)
Specificity (%)
Spectral peak 100 100 100
Mean Frequency
63.9 66.7 61.1
Autocorrelation 100 100 100
[image:6.595.55.280.510.620.2]ZCR 69.5 72.2 66.7
Table 2. Performance of the proposed method in classifying the myopathic patients and normal persons
Feature Accuracy (%)
Sensitivity (Myopathy)
(%)
Specificity (%)
Spectral peak 66.7 61.1 72.2
Mean Frequency
69.5 61.1 77.8
Autocorrelation 86.1 88.9 83.3
ZCR 66.7 77.8 55.6
Tables 1 and 2 show the classification performance of the proposed method considering each feature individually. In each case, two class problem is considered, i.e., in Table 1, classification between the ALS patients and normal persons while in Table 2, classification between the myopathic patients and normal persons. From Table 1 it is seen that the highest success rate of 100% is obtained for both the autocorrelation and magnitude spectrum (obtained from the FFT) features. In Table 2, maximum accuracy is obtained 86.1% for the autocorrelation feature. In Table 3, overall performance of the proposed method is shown considering all
Table 3. Performance of the proposed method in classifying the ALS and myopathic patients
Feature Accuracy
(%)
Sensitivity (ALS)
(%)
Sensitivity (Myopathy)
(%)
Spectral peak 100 100 100
Mean Frequency
86.1 88.9 83.3
Autocorrelation 100 100 100
ZCR 77.8 72.2 83.3
As expected, the highest success rate of 100% is obtained for both the proposed autocorrelation and spectral peak based features. It is apparent from the table that the features like ZCR and the mean frequency provide relatively poor classification performance.
5.
CONCLUSION
class feature separability. Because of the robustness of the proposed features, even use of a simple KNN classifier can result in 100% classification accuracy for the case of spectral peak and autocorrelation based features.
6.
REFERENCES
[1] J. V. Basmajian and C. J. De Luca, Muscles Alive. Their Function Revealed by Electromyography. Baltimore: Williams & Wilkens, 1985.
[2] S. M. Rissanen, M. Kankaanpää, M. P. Tarvainen, J. Nuutinen, I. M. Tarkka, A. Meigal, O. Airaksinen, and P. A. Karjalainen, “Extraction of typical features from surface EMG signals in Paarkinson’s disease,” 11th International Congress of Parkinsons’s Disease and Movement Disorders, Istanbul, Turkey, 2007.
[3] M. B. I. Reaz, and M. S. Hussain, and F. M. Yasin “Techniques of EMG signal analysis: detection, processing, classification and applications,” Biological Procedures Online, vol. 8, no. 1, pp. 11-35, 2006. [4] B. Neogi, S. Ghosal, A. Ghosh, R. Darbar, S. Ganguly,
and B. Brahma, "Approach towards the characteristic interpretation of Electromyography (EMG) signal with clinical study," Recent Advances in Intelligent Computational Systems (RAICS), pp.788-791, 2011. [5] R. F. M. Kleissen, J. H. Buurke, J. Harlaar, and G.
Zilvold, “Electromyography in the biomechanical analysis of human movement and its clinical application,” Gait Posture, vol. 8, no. 2, pp. 143-158, 1998.
[6] National Institute of Neurological Disorders and Stroke (NINDS). "ALS (Amyotrophic Lateral Sclerosis) Fact Sheet," NIH Publication No. 10-916, 2010. Available: http://www.ninds.nih.gov/disorders/amyotrophiclateralsc lerosis/detail_ALS.htm.
[7] P. K. Kasi, “Characterization of motor unit discharge rate in patients with Amytrophic Lateral Sclerosis (ALS),” Worcester Polytechnic Institute, May 2009.
[8] National Institute of Neurological Disorders and Stroke (NINDS). "NINDS Myopathy information page," NIH Publication, 2011. Available: http://www.ninds.nih.gov/ disorders/myopathy/myopathy.htm.
[9] H. D. Katzberg, D. F. Barros, B. Widrow,C. S. Cho, and
Y. T. So, “Analysis of continuous diaphragm electromyographic signal: Results from a patient with amyotrophic lateral sclerosis,” Muscle & Nerve., vol. 43, no. 6, pp. 801–806, 2011.
[10]E. H. Lambert, “Electromyography in amyotrophic lateral sclerosis,” pp. 135-153. In: F.H. Norris, L.T. Kurland (Eds.) “Motor neuron diseases: research in amyotrophic lateral sclerosis and related disorders,” New York, Grune and Stratton, 1969.
[11]L. Cohen, “Time-frequency analysis,” Englewood Cliffs, Prentice-Hall; New Jersey, USA, 1995.
[12]A. Phinyomark, P. Phukpattaranont, and C. Limsakul, "Feature reduction and selection for EMG signal classification," Expert Systems with Applications, vol. 39, no. 8, pp. 7420-7431.
[13]A. F. Kohn, “Autocorrelation and Cross-correlation Methods,” Wiley Encyclopedia of Biomedical Engineering, Ed. Metin Akay, New Jersey: John Wiley & Sons, 23 pp, 2006.