Distance-based Stable Election Protocol (DB-SEP) for
Heterogeneous Wireless Sensor Network
Said Benkirane
MATIC Laboratory Faculty of SciencesChouaib Doukkali University El Jadida - Morocco
Abderrahim Benihssane
MATIC Laboratory Faculty of SciencesChouaib Doukkali University El Jadida - Morocco
M.Lahcen Hasnaoui
Department of ComputerSciences Faculty of sciences Sidi Mohamed Ben
Abdillah University Fez – Morocco
Mohamed Laghdir
MATIC Laboratory Faculty of sciencesChouaib Doukkali University El Jadida - Morocco
ABSTRACT
Preserving the consumed energy of each node for increasing the network lifetime is an important goal that must be considered when developing a routing protocol for wireless sensor networks. The main objective of cluster-based routing protocol is to efficiently maintain the energy consumption of sensor nodes by involving them in multi-hop communication within a cluster and by performing data aggregation and fusion in order to reduce the number of transmitted messages to the base station (sink) and transmission distance of sensor nodes. In this paper we propose a new approach called (DB-SEP) which cluster heads are selected on the basis of their initial energy and their distances between them and the sink.
Experimental results show that our approach performs better than the other distributed clustering protocols such as SEP in terms of energy efficiency and lifetime of the network.
General Terms
Wireless Sensor Networks, Distributed Protocols, Clustering
Keywords
Energy Efficiency, Network Lifetime, Heterogeneous Network, Distance-Based.
1.
INTRODUCTION
A wireless sensor networks (WSN) is composed of a large number of sensor nodes that are often deployed in ad hoc manner in an environment without infrastructure to monitor physical or environmental conditions, such as temperature, sound, pressure, etc. and to cooperatively pass their data through the network to a main location via de base station (BS) also called sink.
Since the base station in sensor networks is usually a node with high processing power, high storage capacity and the battery used can be rechargeable.
Data are collected at a sensor node and transmitted to the BS directly or by means of other nodes. All collected data for a specific parameter like temperature, pressure, humidity, etc are processed in the BS and then the expected amount of the parameter will be estimated. In these networks, the position of sensor nodes need not be engineered or pre-determined, which allows random deployment in inaccessible terrains or disaster relief operations [1].
Communication protocols highly affect the performance of WSNs by an evenly distribution of energy load and decreasing their energy consumption and thereupon prolonging their
for prolonging the lifetime of WSNs [2]. Among the proposed communication protocols, hierarchical (cluster based) ones have significant saving in the total energy consumption of wireless micro sensor network [3][4][5].
In these protocols, the sensor nodes are grouped into a set of disjoint clusters. Each cluster has a designated leader, the so-called cluster-head (CH). Nodes in one cluster do not transmit their gathered data directly to the BS, but only to their respective cluster-head.
However, it is approved that the use of the clustering technique reduces communication energy than direct transmission (DT) and minimum transmission-energy (MTE) routing [3].
In this paper, we proposed a new approach, called DB-SEP, based on the initial energy of nodes and the distance between them and the sink to determine near nodes and far nodes in order to give more chance to nearest nodes to be cluster heads by modifying the election probability value for every type of nodes.
DB-SEP is autonomous and more energy efficient, and simulation results show that it prolongs the network lifetime much more significantly than the other clustering protocols such as SEP and LEACH.
The rest of the paper is organized as follows: Section 2 contains the related work done. Section 3 explains the heterogeneous network and radio energy dissipation model. Section 4 presents the SEP Protocol, followed by section 5 which describes our approach. Section 6 shows the simulation results and finally Section 7 gives concluding remarks.
2.
RELATED WORK
There are two kinds of clustering schemes. The clustering algorithms applied in homogeneous networks are called homogeneous clustering schemes, where all nodes have the same initial energy, such as LEACH [3], PEGASIS [6], and HEED [7], and the clustering algorithms applied in heterogeneous networks are referred to as heterogeneous clustering schemes [8], where all the nodes of the sensor network are equipped with different amount of energy, such as SEP [9], M-LEACH [10], EECS [11], LEACH-B [12] and DEEC [13].
Low-Energy Adaptive Clustering Hierarchy (LEACH) [3] is proposed in Heinzelman et al., which is one of the most fundamental protocolframeworks in the literature. LEACH is a clustering based protocol architecture utilizes randomized rotation of the Cluster-Heads (CHs) to uniformly distribute the energy budget across the network. The sensor nodes are grouped into several clusters and in each cluster, one of the sensor nodes is selected to be CH. Each node will transmit its data to its own CH which forwards the sensed data to the BS finally. Both the communication betweensensor nodes and CH and that between CHs and the BS are direct, single-hop transmission.
PEGASIS [6] is a chain based protocol which avoids cluster formation and uses only one node in a chain to transmit to the BS instead of using multiple nodes. Heinzelman et.al. [14] proposed LEACH-centralized (LEACH-C), a protocol that uses a centralized clustering algorithm and the same steady-state protocol as LEACH. O. Younis, et.al [7] proposed HEED (Hybrid Energy-Efficient Distributed clustering), which periodically select cluster heads according to a hybrid of the node residual energy and a secondary parameter, such as node proximity to its neighbors or node degree. G. Smaragdakis, I. Matta, A. Bestavros proposed SEP (Stable Election Protocol) [9] in which every sensor node in a heterogeneous two-level hierarchical network independently elects itself as a cluster head based on its initial energy relative to that of other nodes. Li Qing et.al [13] proposed DEEC (Distributed energy efficient Clustering) algorithm in which cluster head is selected on the basis of probability of ratio of residual energy and average energy of the network.
3.
HETEROGENEOUS NETWORK AND
RADIO ENERGY DISSIPATION MODEL
3.1
Heterogeneous Network Model
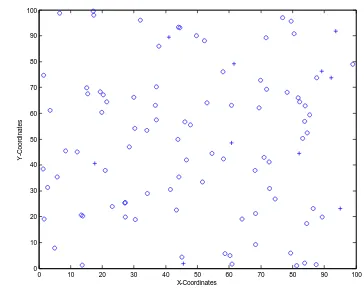
In this study, we describe the network model. Assume that there are N sensor nodes, which are uniformly dispersed within a M x M square region (Figure.1). The nodes always have data to transmit to a base station, which is often far from the sensing area. The network is organized into a clustering hierarchy, and the cluster-heads execute fusion function to reduce correlated data produced by the sensor nodes within the clusters. The cluster-heads transmit the aggregated data to the base station directly. We assume that the nodes are stationary. In the two-level heterogeneous networks, there are two types of sensor nodes, i.e., the advanced nodes and normal nodes. Note E0 the
initial energy of the normal nodes, and m the fraction of the advanced nodes, which own a times more energy than the normal ones. Thus there are Nm advanced nodes equipped with initial energy of E0 1 + a , and N 1 − m normal nodes
equipped with initial energy of E0. The total initial energy of
the two-level heterogeneous networks is given by:
Etotal = N 1 − m E0+ NmE0 1 + a = NE0(1 + am) (1)
[image:2.595.331.513.79.224.2]
Figure.1. 100 nodes randomly deployed in the network
(o normal node, + advanced node).
3.2
Radio Energy Dissipation Model
According to the radio energy dissipation model proposed in [14] (Figure 2) and in order to achieve an acceptable Signal-to-Noise Ratio (SNR) in transmitting an L-bit message over a distance d, the energy expended by the radio is given by:
ETx l, d = lEelec + lϵfsd
2 , 𝑑 < d 0
lEelec + lϵmpd4, 𝑑 ≥ d0 (2)
Where Eelec is the energy dissipated per bit to run the
transmitter ETx or the receiver ERx circuit, and ϵfsd2 and
ϵmpd4 depend on the transmitter amplifier model used and d is
the distance between the sender and the receiver.
To receive this message the radio expends energy:
ERx l = lEelec (3)
Figure.2. Radio Energy Dissipation Model.
4.
SEP PROTOCOL
A Stable Election Protocol for clustered heterogeneous wireless sensor networks (SEP) [9] is developed for the two-level heterogeneous networks, which include two types of nodes, the advance nodes and normal nodes according to the initial energy. The rotating epoch and election probability is directly correlated with the initial energy of nodes.
The probability threshold, which each node 𝑠𝑖 uses to
determine whether itself to become a cluster-head in each round, is as follow:
𝑇 𝑠𝑖 = 𝑝𝑖
1− 𝑝𝑖(𝑟 𝑚𝑜𝑑 𝑝 𝑖1) 𝑖𝑓 𝑠𝑖 ∈ 𝐺
0 𝑜𝑡𝑒𝑟𝑤𝑖𝑠𝑒
(4)
0 10 20 30 40 50 60 70 80 90 100
0 10 20 30 40 50 60 70 80 90 100
X-Coordinates
Y
-C
o
o
rd
in
a
te
[image:2.595.325.543.431.534.2]Where 𝐺 is the set of nodes that are eligible to be cluster heads at round 𝑟. In each round 𝑟, when node 𝑠𝑖 finds it is eligible to
be a cluster head, it will choose a random number between 0 and 1. If the number is less than threshold 𝑇 𝑠𝑖 , the node 𝑠𝑖
becomes a cluster head during the current round.
Also, for two-level heterogeneous networks, 𝑝𝑖is defined as
follow:
𝑃𝑖=
𝑃𝑛𝑟𝑚 =
𝑝𝑜𝑝𝑡
1 + 𝑎𝑚 if si is the normal node
𝑃𝑎𝑑𝑣 =
𝑝𝑜𝑝𝑡(1 + 𝑎)
(1 + 𝑎𝑚) if si is the advanced node
(5)
Simulations showed that SEP performs better than several homogeneous protocols like LEACH.
5.
DB-SEP PROTOCOL
According to the Radio Energy Dissipation Model, the minimum required amplifier energy is proportional to the square of the distance from the transmitter to the destined receiver (Tx−Amplifier α d2) [16]. So the transmission energy consumption will augment greatly as the transmission distance rises. It means that the CHs far from the BS must use much more energy to send the data to the BS than those close to the BS. Therefore after the network operates for some rounds there will be considerable difference between the energy consumption of the nodes near the BS and that of the nodes far from the BS.
In our approach, nodes with the less energy than the other nodes and the nodes with more distance from the BS have the smallest chance to be selected as a cluster-head for current round.
We consider that after deployment phase, the BS (Sink) broadcasts a “hello” message to all the nodes at a certain power level. Each node can compute its approximate distance (𝐷𝑖) to
the BS based on the received signal strength.
Therefore, we introduce new probabilities for every type of nodes according to initial energy and distances of nodes from the base station to favor nodes besides the more energizing and nearest of the BS to become cluster heads as follow:
Let Di is the distance between node si and the base station
and Davg is the average distance between nodes and the sink.
If distance Di < = Davg we take:
𝑃𝑛𝑟𝑚 = 𝑝𝑜𝑝𝑡
(1+𝑎𝑚 ) * (1 - 𝐷𝑖
𝐷𝑎𝑣𝑔)
And (6)
𝑃𝑎𝑑𝑣 =(1+𝑎𝑚 )𝑝(1+𝑎𝑚 )𝑜𝑝𝑡 * (1 - 𝐷 𝐷𝑖
𝑎𝑣𝑔) Else, we keep:
𝑃𝑛𝑟𝑚 = 𝑝𝑜𝑝𝑡
(1+𝑎𝑚 )
And (7)
𝑃𝑎𝑑𝑣 =
(1+𝑎𝑚 )𝑝𝑜𝑝𝑡
(1+𝑎𝑚 )
The average distance Davg is given by:
𝐷𝑎𝑣𝑔 =𝑁1 𝑁𝑖=1𝐷𝑖 (8)
The value of Davg can be approximated as:
𝐷𝑎𝑣𝑔≃ 𝑑𝑡𝑜𝐶𝐻 + 𝑑𝑡𝑜𝐵𝑆 (9)
Where:
dtoCH Is the average distance between the node and the associate cluster head.
dtoBS Is the average distance between the cluster head and the
sink (figure 3).
We assume that the nodes are uniformly distributed and the sink is located in the center of the field then according to [14][17], we get:
dtoCH = 2kπM And dtoBS = 0.765M2 (10)
Where k is the number of clusters and it will be calculate as follow:
𝑘 = 𝐸𝑓𝑠 𝐸𝑚𝑝
𝑁 2𝜋
𝑀 𝑑𝑡𝑜𝐵𝑆2
(11)
[image:3.595.328.514.356.556.2]Thus we can use equations (9), (10), (11) to calculate, dtoCH , dtoBS and finally Davg.
Figure.3. 𝐝𝐭𝐨𝐂𝐇 and 𝐝𝐭𝐨𝐁𝐒 .
After, each node uses the probability threshold mentioned in
(4) to determine whether itself to become a cluster-head in
each round.
5.1
Communications between Cluster heads
and member nodes
5.2
Communications between Cluster heads
and the sink
Each node sends its data during their allocated transmission time to the respective associate cluster head. The CH node must keep its receiver on in order to receive all the data from the nodes in the cluster. When all the data is received, the cluster head node performs signal processing functions to compress the data into a single signal. When this phase is completed, each cluster head can send the aggregated data to the sink.
The consumed energy of cluster head CHi is composed of three parts: data receiving, data aggregation and data transmission. Then:
E CHi = milEelec + (mi+ 1)lEDA+ l(Eelec + ϵfsd2 ) (12)
[image:4.595.342.513.223.332.2]Where: mi is the sum of members in associate cluster and d=Di distance between CH and the BS, in this case d < d0 (figure.4).
Figure. 4. Distances between CH and the Sink
6.
SIMULATION RESULTS
We evaluate the performance of DB-SEP protocol using MATLAB software. We consider a wireless sensor network with N = 100 nodes randomly distributed in a 100m × 100m field. We assume the base station is in the center of the sensing region. We ignore the effect caused by signal collision and interference in the wireless channel and we have fixed the value of d0 at 70 meters.
[image:4.595.58.280.285.402.2]The radio parameters used in our simulations are shown in TABLE 1. The protocols compared with DB-SEP include LEACH and SEP.
Table 1. Radio characteristics used in our simulations
Parameter
Value
𝐸𝑒𝑙𝑒𝑐 5 nJ/bit
𝜖𝑓𝑠 10 pJ/bit/𝑚2
𝜖𝑚𝑝 0.0013 pJ/bit/𝑚4
𝐸0 0.5 J
𝐸𝐷𝐴 5 nJ/bit/message
𝑑0 70 m
Message size 4000 bits
𝑝𝑜𝑝𝑡 0.1
We define stable time as time until the first node dies (FND), and unstable time the time from the fist node dies until the last node dies. In other words, lifetime is the addition of stable time and unstable time.
We define also HNA (half of nodes alive): the half of total number of nodes that have not yet expended all of their energy.
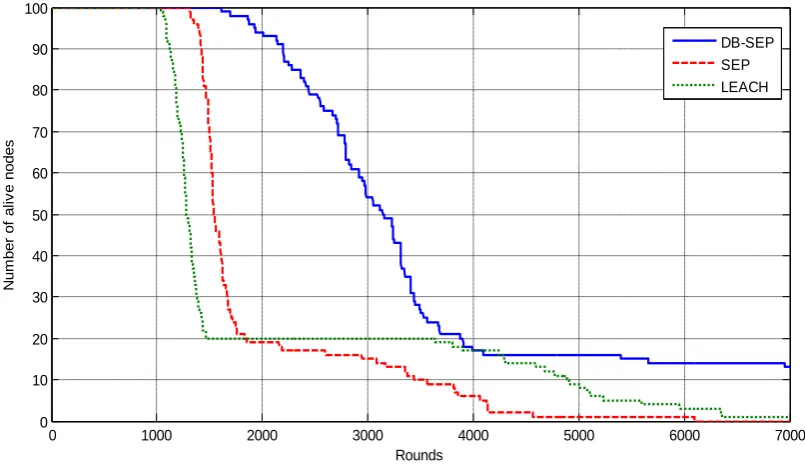
Figure 5. Number of nodes alive over time (m=0.2 and a=3)
According to the figure 5 we notice that the stable time of DB-SEP is large compared to that of LEACH and SEP. The stable time metric is important to be longer in the sense that it gives the end user with reliable information of the sensing area. This reliability is crucial for sensitive application like
tracking fire in forests. SEP performs better than LEACH. This metric is important to be narrow in order to give clear idea about time of reenergizing the WSN to extend the network lifetime and to avoid unreliable information from sensing field.
0 1000 2000 3000 4000 5000 6000 7000
0 10 20 30 40 50 60 70 80 90 100
Rounds
N
u
m
b
e
r
o
f
a
li
v
e
n
o
d
e
s
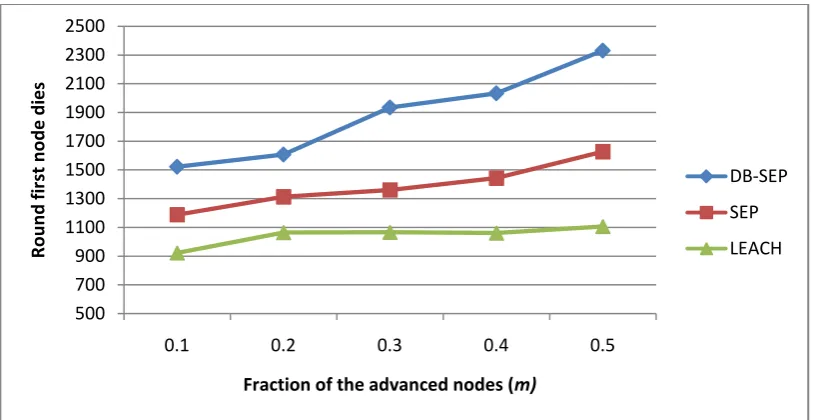
[image:4.595.92.495.438.670.2]Figure 6. Round first node dies when m is varying.
Second, we run simulation for our proposed protocol DB-SEP to compute the round of the first node dies when varying m and compare the results to LEACH and SEP protocols.
[image:5.595.100.504.393.654.2]We increase the fraction m of the advanced nodes from 0.1 to 0.5, Figure 6 shows the number of round when the first node dies. We observe that DB-SEP performs better than LEACH and SEP.
Figure 7. Total remaining energy over time of LEACH, SEP and DB-SEP (m=0.2 and a=3)
Figure 7 shows the remaining energy over time for all simulated protocols and it reveals that DB-SEP consumes less energy in comparison to the others which helps to extend the network lifetime. Here approximately 23% of energy is saved at round 1000 and 12.50% at round 5000 by using DB-SEP.
This is because in our approach we took in consideration distances between nodes and the sink, therefore cluster heads situated far from the base station consume more energy than cluster head situated near the base station that saves the total energy of the network.
500 700 900 1100 1300 1500 1700 1900 2100 2300 2500
0.1 0.2 0.3 0.4 0.5
R
o
u
n
d
fi
rst
n
o
d
e
d
ie
s
Fraction of the advanced nodes (m)
DB-SEP
SEP
LEACH
0 1000 2000 3000 4000 5000 6000 7000
0 10 20 30 40 50 60 70 80
Rounds
T
o
ta
l
R
e
m
a
in
in
g
E
n
e
rg
y
i
n
J
o
u
le
s
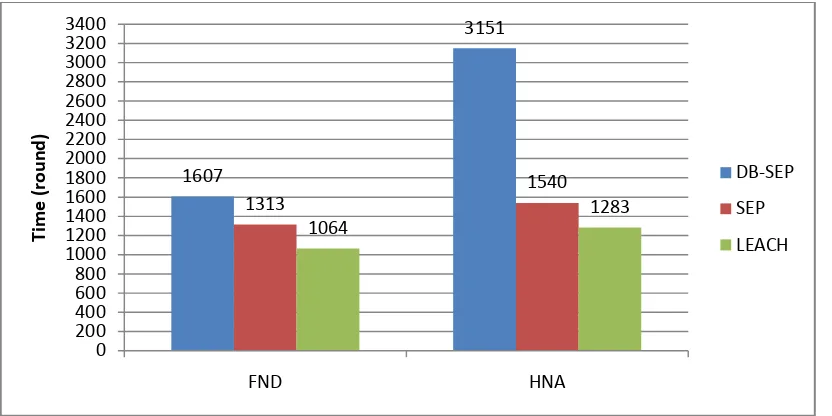
Figure 8. FND and HNA (m=0.2 and a=3)
Figure 8 shows the comparison between all nodes in terms of FND and HNA when m=0.2 and a=3, obviously we can remark that our protocol DB-SEPcontains a large period of stability time than LEACH and SEP, that increases the efficiency of the network.
We notice the same results for HNA that DB-SEP performs better than the others simulated protocols.
When the half number of nodes have expended all of their energy, the network become inefficient.
7.
CONCLUSION
In this paper we have describe DB-SEP, an energy-aware adaptive clustering protocol used in heterogeneous wireless sensor networks and compared it to the LEACH and SEP protocols. In DB-SEP, every sensor node independently elects itself as a cluster-head based on its initial energy and the distance separates it of the base station. Therefore, nodes close to the base station and contain more energy than the other nodes have more chance to be selected as a cluster-head for current round.
DB-SEP uses the tow levels hierarchical concept which offers a better use and optimization of the energy dissipated in the network. Results from our simulations show that DB-SEP provides better performance for energy efficiency and network lifetime.
8.
REFERENCES
[1] F. Akyildiz, W. Su, Y. Sankarasubramaniam, E. Cayirici, A survey on sensor networks, IEEE communications magazine 40 (8) (2002)102–114.
[2] Al-Karaki J. N. and A. E. Kamal, “Routing Techniques in Wireless Sensor Networks: A Survey”, IEEE Journal of Wireless Communications, vol. 11, no. 6, Dec. 2004, pp. 6–28.
[3] W.R. Heinzelman, A.P. Chandrakasan, H. Balakrishnan, Energy efficient communication protocol for wireless microsensor networks, in: Proceedings of the 33rd Hawaii International Conference on System Sciences
[4] Ossama Younis, Marwan Krunz, and Srinivasan Ramasubramanian, “Node Clustering in Wireless Sensor Networks: Recent Developments and Deployment Challenges,” IEEE Network (special issue on wireless sensor networking), vol. 20, issue 3, pp. 20-25, May 2006.
[5] A. Abbasi and M. Younis. A survey on clustering algorithms for wireless sensor networks. Computer Communication, 30(14-15):2826–2841, 2007.
[6] S. Lindsey, C.S. Raghavenda, PEGASIS: power efficient gathering in sensor information systems, in: Proceeding of the IEEE Aerospace Conference, Big Sky, Montana, March 2002.
[7] O. Younis, S. Fahmy, HEED: A hybrid, energy-efficient, distributed clustering approach for ad hoc sensor networks, IEEE Transactions on Mobile Computing 3 (4) (2004) 660–669.
[8] Dilip Kumar, Trilok C. Aseri, R.B. Patel, EEHC: Energy efficient heterogeneous clustered scheme for wireless sensor networks, .elsevier, Computer Communications 32 (2009) 662–667.
[9] G. Smaragdakis, I. Matta, A. Bestavros, SEP: A Stable Election Protocol for clustered heterogeneous wireless sensor networks, in: Second International Workshop on Sensor and Actor Network Protocols and Applications (SANPA 2004), 2004.
[10] V. Mhatre, C. Rosenberg, Design guidelines for wireless sensor networks: communication, clustering and aggregation, Ad Hoc Network Journal 2 (1) (2004) 45– 63.
[11] M. Ye, C. Li, G. Chen, J. Wu, EECS: an energy efficient cluster scheme in wireless sensor networks, in: IEEE International Workshop on Strategies for Energy Efficiency in Ad Hoc and Sensor Networks (IEEE IWSEEASN2005), Phoenix, Arizona, April 7–9, 2005. 1607
3151
1313
1540
1064
1283
0 200 400 600 800 1000 1200 1400 1600 1800 2000 2200 2400 2600 2800 3000 3200 3400
FND HNA
Ti
m
e
(r
o
u
n
d
)
DB-SEP
SEP
[12]Depedri, A. Zanella, R. Verdone, An energy efficient protocol for wireless sensor networks, in: Autonomous Intelligent Networks and Systems (AINS 2003), Menlo Park, CA, June 30–July 1, 2003.
[13]L. Qing, Q. Zhu, M. Wang, "Design of a distributed energy-efficient clustering algorithm for heterogeneous wireless sensor networks". ELSEVIER, Computer Communications 29, pp 2230-2237, 2006.
[14]W. R. Heinzelman, A. P. Chandrakasan, and H. Bala-Krishnan, “An Application-specific Protocol Architecture for Wireless Microsensor Networks,” IEEE Transactions on Wireless Communications, 1, No. 4, pp. 660–670, 2002.
[15] V. Loscri, G. Morabito, S. Marano, ”A Two-Levels Hierarchy for Low- Energy Adaptive Clustering Hierarchy (TL-LEACH)”. In 0-7803-9152-7/05/20.00 2005 IEEE.
[16] Khadivi A. and M. Shiva, “FTPASC: A Fault Tolerant Power Aware Protocol with Static Clustering for Wireless Sensor Networks”, Proc. of IEEE Int. Conf. on Wireless and Mobile Computing, Networking and Communications, Montreal, Canada, Jun. 2006, pp. 397-401.