Munich Personal RePEc Archive
Costing-out the Big Bang: Impact of
external shocks on the Armenian
economy at the outset of transition
Avanesyan, Vahram and Freinkman, Lev
AVAG Solutions, The World Bank
December 2002
Online at
https://mpra.ub.uni-muenchen.de/10012/
Working Paper No. 03/01
Costing-out the Big Bang:
Impact of External Shocks on the Armenian Economy at the Outset of
Transition
Vahram Avanesyan AVAG Solutions avag@arminco.com
Lev Freinkman World Bank
lfreinkman@worldbank.org
January 2003
Abstract
The views expressed in this Working Paper are those of the author(s) and do not necessarily represent those of the Armenian International Policy Research Group. Working Papers describe research in progress by the author(s) and are published to elicit comments and to further debate.
This paper explores factors of economic decline in the small republican economies of the former USSR. It develops quantitative estimates of the costs of major transitional shocks for Armenia during the early transition, including the direct impact of terms of trade shock (price shock), direct impact of external demand shock (market loss), direct impact of fiscal shock (loss of transfers), as well as secondary effects of all the above shocks, defined as a further decline in macroeconomic aggregates due to a weakening of the overall domestic demand. These estimates are obtained within a single framework, built on a detailed input-output model for Armenia, and using the actual 1987 data.
Table of Contents
Introduction
1.Analytical Framework ……….. 4
2. Armenia: depth and factors of economic decline in the early 90-s………. 8
Initial conditions: Industrial structure and endowments ………. 8
Major transitional shocks ... 10
Balance of payment for Armenia ... 12
3. Quantitative analysis of external shocks for Armenia ... 15
Data ... 15
Armenian pre-transition economy in world market prices………. 15
Price shock ... 16
Demand shock... 20
Evaluation of the secondary effects and the overall impact of shocks ... 23
4. Conclusions: comparative impacts of various shocks... 26
Annex 1. The procedures for conversion of input-output accounts into the world market prices ……….………. 30
Annex 2 .………. 31
Introduction
The average depth of recession in Central and Eastern European economies, especially in the Former Soviet Union (FSU), during the early years of transition was very significant, especially given the mostly peaceful character of the transformation. For economists and other observers, this came unexpectedly and has not yet been fully explained. From the analytical perspective, this economic decline may be attributed to two groups of factors:
(i) unavoidable costs of transition associated with the disappearance of explicit and implicit subsidies, economic liberalization, and political disintegration; and
(ii) excessive and potentially avoidable costs that relate to mistakes in the reform strategy, e.g., delays pertaining to critical structural reforms, too rapid a pace of transformation, and/or inconsistencies in stabilization efforts.
Moreover, Armenia and several other economies in transition were affected by regional conflicts that made an additional contribution to the economic decline of the early 90-s.
It seems rather important to be able to separate the relative contributions of these various groups of factors. This is worth doing not just from a historical and/or theoretical perspective, but also due to its importance for ongoing policy discussions on reform strategies in several countries in transition. In many countries, Armenia included, the transition has thus far produced considerable losses in average household incomes. This made general public attitudes towards both government economic policies in the 90-s and market reforms quite negative. The public perception seems to ignore unavoidable costs of transition and to overestimate costs of reforms, and, therefore, tends to over-criticize those who implemented the early market reforms.
This paper aims to develop quantitative estimates of the costs of major transitional shocks (i.e. for “unavoidable costs”) for Armenia during the early transition, including:
a) Direct impact of terms of trade shock, defined as deterioration of real incomes due to economic liberalization and shifts in domestic prices towards prices of the world market;
b) Direct impact of external demand shock (market loss), defined as export losses due to the opening of traditional export markets to global competition and the deterioration of overall demand in these traditional markets;
c) Direct impact of fiscal shock, defined as removal of traditional explicit budget and quasi-budget external transfers;
d) Secondary effects of all the above shocks, defined as a further decline in macroeconomic aggregates due to weakening of the overall domestic demand, which was triggered by external factors a), b), and c).
These estimates are obtained within a single framework, built on a detailed input-output model for Armenia. The model allows one to estimate the direct and indirect effects of these shocks by changing main external parameters of the model, such as prices, demand (external and domestic), and fiscal transfers. We also compare our estimates for total unavoidable costs of transition with the actual economic contraction in Armenia in 1988-1994. We then use this comparison as an indirect measure of “avoidable” costs of transition – costs associated with “wrong” reform policies of the early 90-s.
1. Analytical Framework
This paper follows the framework suggested by Rodrick (1992) for the analysis of output trends in Central Europe during the early transition, which distinguishes between price shocks, shocks related to a loss of traditional markets, and secondary effects, associated with an income multiplier. We expand this approach to include fiscal shocks, associated with the elimination of fiscal and quasi-fiscal transfers to Armenia from the consolidated budget of the FSU1.
It is worth clarifying that we are interested in estimating the impact of transitional shocks on the country’s incomes, not just on outputs and/or value added created in the local economy. This is an important clarification, partially in light of the highly provocative paper by Anders Aslund (2001), in which he calls the major initial output contraction in transition economies a “myth”. He argues that the pre-transition output was largely inflated, and, more importantly, that a large chunk of what was produced was not actually needed – many enterprises in manufacturing subtracted value instead of producing it. Therefore, the actual decline in value added produced has been much smaller than the data on gross output may suggest.
1
It seems important to distinguish between two parts of the problem. First, while it is true that most firms in socialist manufacturing were less productive than those in the West and were subsidized by low input and energy prices, it is not parallel to say that most of them were “value subtractors.” It is worth avoiding an over-statement of the low productivity issue. A more balanced assessment suggests that after opening local markets for international competition, domestic producers in all transition economies lost a considerable part of their domestic market to more productive external competitors, and this indeed resulted in a significant decline in the total locally generated output, employment, and value-added2, which had direct implications for total domestic consumption. Second, in addition to this effect of increased competition, incomes were affected by another and seemingly much more powerful process: the disintegration of the Soviet bloc resulted in the elimination of various types of cross-border income transfers. However, as Aslund describes it, this kind of income loss should not be linked to the economic transition and costs of reforms. These are the costs of the political process, the price paid by the newly independent states for their political independence.
The comparative analysis of contributions made by various transitional shocks to the output decline is not well documented. In the first part of the 90-s, a considerable amount of research was conducted to explore the magnitude of term-of-trade (TOT) shocks in the FSU3, while other types of shocks (market and transfer losses) received much less attention, primarily due to a lack of data.
However, a TOT-based approach, i.e. one aimed at comparative analysis of changes in export and import prices after the price shock, cannot generate comprehensive estimates of transitional shocks because:
a) It does not cover other transitional shocks related to a loss of traditional markets and transfers;
b) It covers only direct income losses and does not include indirect effects on the economy through inter-sectoral linkages.
Moreover, the TOT-based approach has a more general methodological constraint. The whole traditional TOT concept of price shock analysis relates to the examination of the impact of price movements on balance of payment (BOP) and debt, but not on GDP and incomes. The implicit assumption is that after the TOT has changed and an additional gap in balance of payments has emerged, some financing of this new gap could be found (at least in the short term) and no immediate impact on demand (and GDP) would follow. Thus, the major concern within this traditional approach relates to the impact of terms-of-trade shock on debt and exchange rates, which may in turn later affect GDP (but indirectly). But the situation in the FSU in the early 90-s was different because the newly independent states did not have much access to external financing. They could not respond to the price shock by increasing borrowings, but instead had to make drastic cuts in
2
And, as is the case for any liberalization, related gains from increased value added in expanding competitive/exporting sectors came with some delays.
3
imports and consumption. Thus, it is important to reflect this specificity of the trade shock’s impact in the FSU in the underlying model.
An even more important methodological constraint on estimating the effect of price shock within the TOT-based approach relates to difficulties of conversion of TOT index (which is a measure of price changes) into meaningful estimates of domestic income losses. Equation (1) presents the most logical way to estimate the share of gross domestic income lost due to price changes. It is calculated as a difference between two trade balances, in old and new prices, divided by GDP, and utilizing an appropriate index of price changes.
InLoss = (TrBal (1) – TrBal (0)*Defl) / (GDP(0)*Defl) , where: (1)
InLoss – losses in real incomes, caused by terms of trade changes
TrBal (1) and TrBal (0) – nominal trade balance after and before the price shock, in new and old prices respectively
GDP(0) – GDP of the base year
Defl – deflator, reflecting the magnitude of price change
The problem with this formula in relation to the economies in transition derives from the fact that it is very difficult to measure pre-transition GDP in new (i.e. world market) prices. Because the official Soviet exchange rate (1 Rbl = 1.67$) was heavily overestimated, it cannot be used, while its proxies for formula (1*) are not easily available.
InLoss = (TrBal (1) – TrBal (0)* InExRate) / (GDP(0)* InExRate) , (1*)
where InExRate – a proxy for exchange rate between Soviet ruble and $US
Researchers have had to develop various second best techniques to address this problem. For instance, David Tarr (1993, 1994) introduced the following formula to assess the TOT impact on the GDP, which tries to avoid the exchange rate problem:
TOT Impact = TOT Index * Intensity of trade, where: (2)
TOT Index – the ratio of changes in export and import prices,
Intensity of trade – the share of trade flows (export and import combined) in GDP
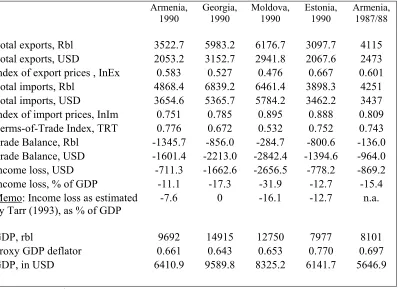
Table 1 provides the results of our alternative estimates and compares them with those reported by Tarr (1994). Note that we use the same original 1990 trade and price data for 105 sectors of the Soviet economy as Tarr did. In three out of four cases we obtained much larger estimates of the direct impact losses than those reported by Tarr. In particular, we estimated that direct income loss in Armenia amounted to 11.1percent of 1990 GDP, compared to 7.6 percent of GDP, as estimated by Tarr.4
Table 1. Direct Income losses in selected FSU states as a result of a switch to world market prices. Preliminary estimates deriving from the TOT approach.
Armenia, 1990
Georgia, 1990
Moldova, 1990
Estonia, 1990
Armenia, 1987/88
Total exports, Rbl 3522.7 5983.2 6176.7 3097.7 4115 Total exports, USD 2053.2 3152.7 2941.8 2067.6 2473 Index of export prices , InEx 0.583 0.527 0.476 0.667 0.601 Total imports, Rbl 4868.4 6839.2 6461.4 3898.3 4251 Total imports, USD 3654.6 5365.7 5784.2 3462.2 3437 Index of import prices, InIm 0.751 0.785 0.895 0.888 0.809 Terms-of-Trade Index, TRT 0.776 0.672 0.532 0.752 0.743 Trade Balance, Rbl -1345.7 -856.0 -284.7 -800.6 -136.0 Trade Balance, USD -1601.4 -2213.0 -2842.4 -1394.6 -964.0 Income loss, USD -711.3 -1662.6 -2656.5 -778.2 -869.2 Income loss, % of GDP -11.1 -17.3 -31.9 -12.7 -15.4 Memo: Income loss as estimated
by Tarr (1993), as % of GDP
-7.6 0 -16.1 -12.7 n.a.
GDP, rbl 9692 14915 12750 7977 8101 Proxy GDP deflator 0.661 0.643 0.653 0.770 0.697 GDP, in USD 6410.9 9589.8 8325.2 6141.7 5646.9
Note: TRT=InEx/InIm
Source: Tarr (1993), own estimates
The last column of Table 1 contains our own estimates for Armenia for 1987/88 that are based on the completely different approach developed below in this paper and explained in the following sections. The approach derives from re-estimating the entire pre-transition Armenian economy in world prices through a desegregated input-output model (IOM). We believe that this is a much more accurate approach to assessing an exchange rate proxy InExRate and thus the overall impact of the trade shock on incomes. Note that our earlier proxy estimate for Armenia’s (column 1: 11.1 percent of GDP) is much closer to this estimate derived from the IOM model (last column: 15.4 percent of GDP) than Tarr’s estimate. This may suggest that Tarr’s estimates for Armenia (and likely
4
for Georgia and Moldova) underestimate income losses. It is also worth noting that, based on our estimates, one could argue that Armenia was less affected by the price shock than Georgia and Moldova.
Another traditional difficulty with the assessment of transitional shocks derives from the lack of reliable data on inter-republican income transfers in the former USSR. In Soviet times, balance of payments was never properly estimated for the former Soviet republics. Brown and Belkindas (1990) show that standard Soviet statistics of output and consumption were not helpful in developing an accurate measure of income redistribution in the FSU. This is because the main macroeconomic aggregates were seriously distorted, in particular by a biased accounting of main taxes and subsidies. Also, the Soviet statistics of national output and trade did not account for most services and did not reflect a regional breakdown of consumption of all-union services, such as defense.
At the same time, Brown and Belkindas (1990) suggest a framework for developing proxy BOP estimates. These could be based on the traditional trade balance and then adjusted for balance of major channels of inter-republican financial redistribution, such as profit tax, turnover tax, investment funds of sectoral ministries, and budget subsidies. Brown and Belkindas believe that such financial adjustments could be obtained from Central Bank sources. They also report on the Estonian BOP of late 80-s, which was reconstructed based on various local sources of information. We follow this approach to estimate Armenian BOP for 1987 in the next section.
2. Armenia: depth and factors of economic decline in the early 90-s
Initial conditions: Industrial structure and endowments
Armenia was one of the most industrially developed parts of the former Soviet Union. In the period between 1960 and 1987, the Armenian economy experienced a period of rapid growth, with a gross output increase of 830percent. Being a part of the Soviet industrial complex, the Armenian industrial sector was specialized in the production of chemicals, electronics, radio- and electromechanical components, tools and instruments, precious metals and stones processing, and agricultural processing.
Table 2. Development indicators for selected FSU economies in 1990
Armenia Georgia Kyrgyz Republic
Russian Federation
USSR
Average salary, Rubles 241.3 214.0 219.2 297.8 274.6
Average deposit in Savings Bank, Rubles
2,794 2,459 1,416 1,732 1,734
College educated population, %*
13.8 15.1 9.4 11.3 10.8
College graduates per 10,000 inhabitants
31 30 21 27 26
Number of doctors per 10,000 inhabitants
43 59 36 46.9 44.2
Output of industrial consumer goods per capita, Rubles
1,740 1,546 884 1,664 1,598
Industrial employment, % of total
30.3 20.3 19.1 30.2 26.6
Infant mortality per 1000 newborn
18.6 15.9 30.0 17.4 21.8
Life expectancy at birth 71.8 72.8 68.8 69.3 69.3 *Among population 15 years of age and older.
Source: Goskomstat (1990)
The Armenian economy was relatively open, with the volume of external trade amounting to 103percent of GDP in 1987, which was rather common for the smaller FSU republics. 1987 exports in domestic currency terms amounted to more than 50percent of GDP, and the trade balance was close to zero. The manufacturing sector dominated overall exports, making up more than 95percent of the total. Among the individual sectors, the light industry5 had the biggest share, at 37.7percent, followed by machinery, food and chemical industries with 25.2, 14.3 and 10.0percent respectively. At the same time, before independence, Armenia was practically isolated from the rest of the world. For instance, in 1988 only about 2percent of Armenian exports were shipped outside of the FSU.
Armenia also had a rather developed network of research facilities, with 25.3 thousand people involved in R&D6 in 1991, of which 17.2 thousand were researchers.
5
Light industry includes textiles, footwear, leather, and garments among its primary components.
6
They received 400-500 patents per year in Soviet times. Even in 1998, after a considerable contraction, almost a hundred of organizations reported that they were involved in R&D.
Major transitional shocks
The pre-transition structure of Armenia’s economy, especially industry, proved to be quite vulnerable to external shocks. This was primarily due to the role played by big industrial plants that produced mostly intermediary goods, with both suppliers and customers located in the rest of the FSU. These “core” industrial enterprises did not have a sufficient volume of internal linkages to other Armenian firms, and at the same time they had too little of their own marketing and development capacity, which would dramatically limit their ability to respond to external shocks, including through changes in their output mix and/or by entering new export markets7. Most of the industry operated on the “enclave” model (i.e., without a strong local base to support sustainable development). Such a high dependence on export of parts, components, and tools (especially for defense use) to other FSU states, which accounted for about 40percent of total industrial export, as well as on imports of raw materials, played a critical role in the steep decline of industrial output in the early 90-s.
Another large chunk of industrial exports were derived from light manufacturing, such as textiles, garments, and footwear. Both the productivity of these companies and the quality of their output was low by international standards, which made them vulnerable to trade liberalization.
Overall, the old industrial core of the Armenian economy could not be sustained after the disintegration of the FSU and market liberalization due to a number of factors that included:
a) a sharp decline in defense and other final demand in Russia and other FSU states; b) the low competitiveness of Armenian goods, especially in the consumer sector, after
energy and other subsidies had been withdrawn: FSU markets were lost to competitors from lower-cost countries, e.g. Turkey and China;
c) political factors that pushed Russian producers (e.g. in defense industries) to switch to local suppliers;
d) new cost factors, such as increased transportation costs for Armenian goods;
e) excessive size of many traditional enterprises, which, when external markets were lost, could not be efficiently re-oriented to work primarily for the domestic market; most of them cannot be profitable at a low rate of capacity utilization.
In short, the vulnerabilities of Armenia’s industrial structure could be summarized as “too many of the wrong enterprises operated in the wrong sectors.” As in several other small FSU economies, most industrial output in Armenia was produced in sectors that were implicitly subsidized. These subsidies were derived either from lower prices of energy, metal and raw materials or through protection from international competition or
7
both. All such economies, in which energy and other primary sectors were relatively under-developed, were significantly affected by the price shock in early transition that was triggered by price and trade liberalization.
[image:12.612.85.524.276.449.2]Table 3 illustrates cross-sectoral differences in the price response to liberalization in the early transition. In the first years of transition, prices in “good” sectors (i.e., those that benefited from price liberalization) grew 4-7 times faster than in the “bad” ones (i.e., sectors that had been either subsidized or over-priced or both). Price liberalization, which was largely completed in Armenia by 1995, exposed three main sectors of the Armenian economy (machinery, light/textiles, and food processing) to a severe income contraction. Overall, about ¾ of the total industrial production and 77percent of total exports were affected by the negative price shock.
Table 3. Armenia: price indexes by industrial by-sectors, 1988-94 (1988 = 100)
Total Industry 1,127,214 Positively affected sectors:
Electric energy 3,973,007
Chemical and petrochemical 4,638,476
Non-ferrous metallurgy 4,015,691
Negatively affected sectors:
Food industry, incl. flour-mills 1,122,099
Light industry 652,388
Machinery and metal processing 852,317
Sector with a neutral impact
Forestry and wood processing 2,775,967
Construction materials industry 2,629,977
Source: NSS
Table 4 presents a simple measure of structural pre-transition vulnerability for selected FSU economies. It compares the shares of “good” and “bad” sectors in the total industrial output before the transition, and adjusts this ratio for contribution of the industry into GDP generation. The constructed index provides a clear distinction between energy and metal exporting FSU economies (such as Azerbaijan and Kazakhstan) and energy and metal importing ones. The table suggests that the Baltic states, Moldova, and Kyrgyzstan were the most vulnerable to the price shocks (for these economies, the index exceeds 1.8). Compared to these states, the industrial structures of Georgia and Armenia (before the earthquake) were slightly less vulnerable. However, as a result of additional distortions that emerged after the earthquake, by 1990 the index for the Armenian economy8 increased to the levels of those in Moldova and Kyrgyzstan.
8
Table 4. Index of structural vulnerability for selected FSU states.
Armenia, 88
Armenia, 90
Azerbaija n
Estonia Latvia Georgia Kazakhsta n
Kyrgyz Republic
Moldova
All Industry 100.0 100.0 100.0 100.0 100.0 100.0 100.0 100.0 100.0 `
Heavy Industry 54.1 61.3 47.4 44.8 46.7 39.1 64.0 44.1 39.8
Fuel and Energy 3.9 3.5 14.1 5.9 2.6 3.5 13.0 5.0 3.5
Electricity 3.7 4.1 0.0 2.4 5.2 4.1 3.5
Fuels 10.5 1.8 0.0 1.1 7.8 0.9 0.0
Ferrous and Non-ferrous Metallurgy
4.1 3.2 3.4 0.0 1.3 3.8 16.5 4.4 1.0
Chemicals and Petrochemical Industry
6.9 4.0 5.7 6.5 9.1 3.7 6.5 0.6 3.1
Machine Building and Metalworking
31.6 32.8 16.0 14.1 26.8 14.3 15.9 24.6 17.8
Forestry,
Woodworking, and Pulp and Paper
2.3 2.1 1.7 8.1 3.2 3.3 2.8 1.5 3.4
Construction Materials 5.3 4.7 2.8 4.4 3.6 5.1 5.7 4.4 3.9
Light Industry 24.4 24.6 17.4 18.5 19.1 21.2 15.6 27.5 21.1
Textiles 11.3 9.7 12.5 12.8 12.2 9.5 20.4 9.9
Garments 9.3 10.4 3.2 3.1 7.5 4.2 5.0 7.2
Leather and Shoes 3.9 4.5 1.6 2.5 1.3 1.8 2.1 3.9
Food Industry 16.7 13.2 22.8 24.1 25.1 37.4 16.2 24.9 39.1
Processed Foods 8.9 20.0 4.7 32.9 6.5 18.3 28.6
Meat and Dairy Products
4.0 2.6 12.2 3.6 9.2 6.5 7.9
Fish 0.3 0.3 7.2 0.9 0.5 0.0 0.2
Other industries 4.8 1.0 12.3 12.6 9.1 2.4 4.2 3.6 0.0
“Good” sectors (energy, metal, chem.)
14.9 10.7 23.2 12.4 13.0 11.0 36.0 10.1 7.6
“Bad” sectors (light, mash., food)
72.7 70.5 56.2 56.7 71.1 72.9 47.7 76.9 78.0
Ratio 4.9 6.6 2.4 4.6 5.4 6.6 1.3 7.6 10.3
Share of industry in GDP
35 30.2 22 39.6 35.1 22.9 21 26.4 20
Index of structural vulnerability
1.71 2.00 0.53 1.81 1.91 1.52 0.28 2.02 2.05
Source: Belkindas and Ivanova (1995) and own estimates
Balance of payment for Soviet Armenia
a) purchases made by migrants (Armenia had negative balance of Rbl 300 mln9); b) the balance of financial flows, having obtained the following information on main financial inter-republican flows for Armenia: budget transfers and subsidies; profit and turnover taxes; investment grants funded by sectoral ministries; payroll taxes and pension payments.
We believe that, before the transition, Armenia’s deficit of trade account (merchandise only) amounted to approximately 5.4percent of GDP. These estimates do not reflect the balance of service account, for which it seems difficult to get any reliable statistics. Given the fact that the service sector in the USSR was heavily under-developed compared to the industry and traditional infrastructure, and because most services were locally consumed, inter-republic trade in services was relatively small, except for tourism and travel, for which our estimates amounted to -3.2percent of GDP. In addition, given the lack of official statistics, we may simply speculate that Armenia, as well as some other smaller FSU republics, were likely to run a deficit for trade in other services. This is because they had non-proportional access to educational, health, and R&D services provided free or almost free by centrally located institutions (in Moscow and other major urban centers in the rest of the FSU) that were funded from the union budget10. This may amount to a further increase of 1.5percent of GDP in Armenia’s current account deficit.
Overall, our estimates suggest that, before the transition, Armenia has been running a negative balance of trade in goods and services on the order of 10percent of GDP (sum of lines 1 and 4).
Finally, we looked into the intensity of financial flows between Armenia and the central budget of the former USSR. It is worth noting that the system of inter-budgetary transfers in the FSU was rather complicated, with a number of parallel channels. In recent research, it is not uncommon to simplify the picture of fiscal re-distribution between the former Soviet Republics by over-emphasizing the role of budget transfers/subsidies provided by the central budget to republican budgets. As it is shown in Table 5, such inter-budgetary transfers (line 11) represented only one of several re-distribution channels, and in the case of Armenia it was relatively insignificant (about 2percent of GDP).
Our estimates suggest that Armenia indeed received a considerable amount of financial resources from the central budget, which were coming mainly through the investment financing (12.7percent of GDP) done by the USSR sectoral ministries of their mostly industrial projects located in Armenia. In addition, Armenia received transfers through the USSR pension system (3.3percent of GDP). Overall, however, the balance of current transfers in Armenia was negative (-6.6percent of GDP) due to major tax payments made by Armenian enterprises to the USSR budget. This is an important source of funding: it suggests that, despite getting some budget subsidies, on balance Armenia did not receive transfers from the central budget to support its current incomes and consumption.
9
As reported by Brown and Belkindas (1990).
10
The overall current account deficit in Armenia in 1987 was very large, in excess of 16percent of GDP, and was financed primarily by the USSR central investment budget (which would be an equivalent of FDI in the more traditional BOP presentation). The remaining deficit financing was coming through central government financing of all-union services such as defense (for which we do not have information) and through worker remittances.
While from the transition perspective, this was quite a high deficit of both trade and current accounts, we believe its actual impact on post-1991 developments in Armenia was modest. When the traditional central sources of investment financing disappeared after the collapse of the USSR, this loss (all other factors remains intact) could be almost fully compensated through Armenia’s gains associated with the disappearance of taxes to the union budget (lines 8 and 9).
[image:15.612.85.486.440.701.2]We estimate that on a net basis, Soviet Armenia received annual financial transfers on the order of 6-8percent of GDP. As follows from the analysis below, this is a much smaller amount than the implicit price subsidy received by the Armenian economy. The bottom line of our analysis of the 1987 BOP suggests that the withdrawal of USSR financial transfers (i.e., direct impact of fiscal shock) was relatively small when compared to other transitional shocks. If Armenia was affected by only a fiscal shock, it would have been able to mostly preserve the status quo, by financing its investment program from its own savings, including those that had earlier been taxed away.
Table 5. Reconstruction of Armenian BOP, current mln rbl, 1987
Nominal % of GDP 1. Trade balance (merchandise) = 2+3 -436 -5.4 2. Merchandise trade balance -136 -1.7
3. Purchases by migrants -300 -3.7
4. Balance in services = 5+6 -380 -4.7
5. Travel and tourism -260 -3.2
6. Education, health, and R&D (*) -120 -1.5 7. Current Transfers = 8+9+10+11 -530 -6.6 8. Turnover tax payable to USSR union budget -616 -7.6 9. Profit tax payable to USSR union budget -331 -4.1 10. Deficit of pension payments financed from USSR
union budget
271 3.3 11. Inter-budgetary transfers (net) 146 1.9
12. Balance of Current account = 1+4+7 -1346 -16.6 13. Investment financed from the union budget sources 1030 12.7
14. Net Borrowings -64 -0.8
15. Discrepancy = 12+13+14 380 4.7
Memo: Net Financing received = 7+13+14 436 5.4
Memo: GDP 8101
3. Quantitative analysis of external shocks for Armenia
We aim to obtain four types of estimates.
First. We start with the actual input-output table of Armenia for 1987 and convert all its relevant entries into the world market prices. By doing this, we construct an illustrative picture of the Armenian economy in 1987, as it would have operated in an environment where all but a limited number of products are traded at world market prices, including in domestic transactions. The main input and output indicators obtained at this stage serve for an evaluation of the direct price shock effect. They are also used as the main data source for further analysis.
Second. We estimate the direct impact of the external demand shock based on the actual dynamic of Armenian exports to Russia, which was Armenia’s major trading partner in 1987.
Third. We evaluate the secondary effect – the impact of domestic demand shock triggered by terms of trade changes and external demand deterioration. This reflects a usual effect of multiplier: initial income losses of exporters, importers, and the Government being transmitted to their suppliers as well as to recipients of budget transfers. This estimate is based on the initial input-output table, in which a much lower final domestic demand has been introduced.
Fourth. We estimate the cumulative impact of external and domestic shocks described above.
Data
The base year for our analysis of the pre-transition Armenian economy is 1987, which is the most representative year from the late Soviet period. Due to the 1988 earthquake, indicators for the following years, 1988-91, especially those related to output, exports, imports, and budget transfers, seriously deviated from their baseline of the mid 80-s. At the same time, 1987 was the last year for which data for the disaggregated input-output table are available. We used the IOM with the 110 main economic sectors.
Most data on the real sector are from the various publications of the Armenian National Statistical Service (NSS). Financial information was also provided by the Central Bank of Armenia (CBA) and the Ministry of Finance of Armenia.
The price and trade data are from the USSR Goskomstat and were provided for 105 sectors, o/w 100 in industry (manufacturing, mining, and energy), 2 in agriculture, 3 in services.
We have constructed price conversion coefficients for each sector of the traditional FSU industrial classification. This is done based on the export and import data in domestic original and world prices that are available from the USSR Goskomstat for each republic, including Armenia. This procedure is very similar to the one done by Tarr (1994) and Orlovski (1993), and resulted in a similar set of coefficients. To convert Input-Output accounts into world market prices for each sector, we followed the procedure described in Annex 1.
[image:17.612.82.532.290.539.2]Table 6 reflects the main results of our re-estimation of the Armenian economy into the world market prices (WMP). We received a picture of the economy that had a GDP of US$ 5.2 billion (in 1987 dollars), which is equivalent to $1400 of GDP per capita. It also remains a highly open economy, with exports reaching 47percent of GDP, and the overall degree of openness reaching 113percent.
Table 6. Armenian economy in world market prices, results of conversion, 1987
1987 Domestic
Price Terms
1987 World Market Price Terms (Option 1)
1987 World Market Price Terms (Option 2)
Thousands of Rubles
Thousands of US Dollars
Price Conversion Coefficients, dollars per 1
ruble
Thousands of US Dollars
Price Conversion Coefficients, dollars per 1
ruble
Output 16,381,684 12,044,537 0.74 11,211,090 0.68
Intermediary Inputs 8,280,381 6,827,089 0.82 6,789,715 0.82 Gross Domestic Product (GDP) 8,101,303 5,217,448 0.64 4,421,374 0.55
Export 4,114,937 2,472,846 0.60 2,472,846 0.60
Import 4,250,804 3,437,308 0.81 3,437,308 0.81
Trade Balance -135,867 -964,461 N/A -964,461 N/A
- as % of GDP -1.70 -18.50 N/A -0.22 N?A
Total final demand 8,201,928 6,167,347 0.75 5,385,836 0.66 Private Final Consumption 4,395,203 2,405,270 0.55 2,314,701 0.53
Government Consumption 1,025,536 1,025,536 1.00 728,370 0.71
Gross Capital Formation 2,685,070 2,736,541 1.02 2,342,765 0.87
Note: Options 1 and 2 differ in a way of estimating the non-tradable part of the economy and they are described in Annex 1. All further analysis and simulations are based on the results of conversion received under Option 1.
Price shock
In line with the discussion in Section 1, we have been using two measures of the terms of trade shock:
prices of the reference (1987) year divided by total export (import) volume in world market prices of the same year.
• Imputed Trading Loss (TL) measures losses in real Gross Domestic Income caused by terms of trade changes and calculated by subtracting the trade balance in world market prices from trade balance in current domestic prices, deflated by an appropriate index (see also formulas (1) and (1*) above). To assess the sensitivity of our results, we used three different deflators: import price index (TL import), export price index (TL export) and final demand index (TL demand).11
[image:18.612.81.532.415.673.2]Table 7 presents our main results for the impact of the price shock. Given the structural weaknesses of the Armenian economy discussed above, the shift towards world market prices indeed produced significant negative changes in terms of trade and generated substantial income losses. The decline in export prices was much deeper than the one for import prices. The deterioration of the trade balance amounted to about 17percent of (dollarized) GDP, from –1.7percent to –18.5percent of GDP. Obviously, income losses of this magnitude would have a lasting downward effect on the economy, pushing it to a new lower level of equilibrium. The size of the losses, while still very significant, was somewhat smaller in 1988-89. This is in part due to the administrative price reform introduced in the USSR in the late 80-s, which resulted in somewhat diminished discrepancies between the world market and domestic prices. This is also due to a major change in the composition of import flow to Armenia after the earthquake.
Table 7. External Trade, Terms of Trade Index and Trading Losses, 1987-1990
1987 1988 1989 1990
Export, Import and trade balance in world market prices (millions of dollars of the reference year)
Export in world market prices 2 472.90 2 247.90 2 333.60 2 062.80 Import in world market prices 3 437.00 3 611.60 3 711.00 3 676.30 Trade Balance -964.10 -1 363.70 -1 377.40 -1 613.50
Export, import, and trade balance in actual prices (million of current rubles)
Export in current prices 4 114.90 3 767.00 3 658.80 3 522.70 Import in current prices 4 250.80 4 876.30 4 897.80 4 868.40 Trade Balance -135.90 -1 109.30 -1 239.00 -1 345.70
Hypothetical Trading Losses (TL) (million dollars)
TL import -882.43 -701.74 -587.16 -825.49
11
1987 1988 1989 1990
TL export -854.22 -542.10 -438.63 -597.31 TL final demand -861.91
Export-Import price indices
(volumes in rubles of the reference year = 100)
Total Exports Price Index 60.10 59.67 63.78 58.56 Total Imports Price Index 80.86 74.06 75.77 75.51 Total Final Demand Index 75.19
Terms of Trade Index 74.33 80.57 84.18 77.55
Source: Own calculations based on Goskomstat and Armstat statistics.
Note: World price estimates for 1988, 1989 and 1990 are from Goskomstat, and own estimates are for 1987.
[image:19.612.76.534.72.251.2]In addition, at the sectoral level several core industries (especially food processing, textiles, and garments) experienced a substantial deterioration in their gross operating margins (defined as the difference between values of output and input per unit of output) due to unfavorable changes in relative prices. Table 8 and Figure 1 show the scale of this impact. They suggest that the overall consequences of the price liberalization were even more negative than as shown by the macro level data. In addition to the initial income loss, a number of domestic enterprises became unviable in the new price environment and had to stop operations completely.
Table 8. Gross operating margins before and after converting to world market prices and world market price conversion ratios for 25 main industrial sectors, 1987
Sectors
Output. in thousands of current
1987 rubles
Gross Operating Surpluses (in 1987
ruble prices)
Gross Operating Surpluses (in world
market prices)
Gross operating Margin in 1987 ruble prices
Gross operating Margin in world market
prices
Output Price Conversion
Ratio
Input Price Conversion Ratio
Output/ Input Relative
price change
Garments 689.580.00 94.567.00 9.327.18 13.71% 4.12% 0.33 0.36 0.90
Tools and Parts 686.488.00 173.794.00 16.473.01 25.32% 3.57% 0.67 0.87 0.77
Knitted Products 617.555.00 306.454.00 55.645.90 49.62% 28.82% 0.31 0.44 0.71
Meat Products 567.332.00 15.956.00 124.346.34 2.81% 33.10% 0.66 0.46 1.45
Electro-Technical Parts 530.230.00 158.625.00 158.529.85 29.92% 28.66% 1.04 1.06 0.98
Wines 514.300.00 204.450.00 -12.561.44 39.75% -17.46% 0.14 0.27 0.51
Radio, Electronics Parts 495.091.00 155.934.00 97.315.99 31.50% 22.80% 0.86 0.97 0.89
Leather 459.620.00 146.687.00 37.420.97 31.91% 20.07% 0.41 0.48 0.85
Power 339.832.00 140.019.00 123.470.94 41.20% 24.34% 1.49 1.92 0.78
Other Instruments and
Machinery 315.041.00 21.824.00 52.543.60 6.93% 16.68% 1.00 0.90 1.12
Cotton Products (Tex-
tile and Garments) 268.677.00 26.014.00 -14.528.14 9.68% -15.29% 0.35 0.45 0.78
Sectors Output. in thousands of current 1987 rubles Gross Operating Surpluses (in 1987 ruble prices) Gross Operating Surpluses (in world market prices) Gross operating Margin in 1987 ruble prices Gross operating Margin in world market prices Output Price Conversion Ratio Input Price Conversion Ratio Output/ Input Relative price change
Tobacco 267.429.00 102.656.00 3.174.48 38.39% 3.86% 0.31 0.48 0.64
Non-Ferrous Metals 261.530.00 41.045.00 143.116.41 15.69% 33.80% 1.62 1.27 1.27
Dairy Products 255.661.00 24.217.00 38.975.31 9.47% 26.07% 0.58 0.48 1.22
Wool Products (Tex-
tile and Garments) 244.885.00 71.513.00 4.821.06 29.20% 7.64% 0.26 0.34 0.77
Other Industries 233.086.00 47.869.00 28.935.35 20.54% 9.47% 1.31 1.49 0.88
Pre-fabricated Concrete 187.308.00 25.194.00 -49.312.83 13.45% -31.45% 0.84 1.27 0.66
Alcohols 180.075.00 168.425.00 7.047.54 93.53% 46.42% 0.08 0.70 0.12
Fruit & Vegetables 171.011.00 18.584.00 18.179.21 10.87% 17.86% 0.60 0.55 1.09
Machinery/Equipment
Repair 143.518.00 37.606.00 30.990.45 26.20% 21.59% 1.00 1.06 0.94
Confections 133.704.00 41.669.00 13.169.78 31.17% 20.97% 0.47 0.54 0.87
Bread and Bakery
Products 129.836.00 9.702.00 7.320.30 7.47% 8.85% 0.64 0.63 1.02
Synthetic Rubber 126.406.00 45.910.00 12.830.30 36.32% 13.51% 0.75 1.02 0.74
Furniture 121.661.00 36.960.00 -17.347.90 30.38% -34.49% 0.41 0.80 0.52
Machine Tools 110.503.00 27.192.00 39.927.04 24.61% 30.40% 1.19 1.10 1.08
Weighted Average 26.26% 17.62% 0.65 0.74 0.87
Source: Own estimates
[image:20.612.80.566.70.369.2]As may be seen from Table 8, the relative price changes for inputs outpaced those for outputs for 18 out of the 25 top industries. As a result, in world market price terms, gross operating margins declined below 10percent for 10 industrial sectors, indicating that these sectors most probably would become uncompetitive in the new price environment. Table 9 provides estimates for the magnitude of the potential output contraction due to low profitability. It reveals that conversion to WMP could result in more than 40percent of industrial output becoming unprofitable.
Table 9. Industries with low gross operating margins after conversion to World Market Prices, out of 100 industrial sectors
Gross Operating
margins Number of Industries
Output in 1987 current prices (million rubles)
As percent of total 1987 Industrial Output
(percent)
Negative 39 1978 18.4%
5% and less 44 3760 34.9%
10% and less 48 4424 41.1%
[image:20.612.85.534.543.624.2]Figure 1. Price shock effect on gross operating surpluses in main sectors
Demand shock
During the first years of transition, the deterioration in Armenia’s export performance was much more severe than the declines in GDP and output. As suggested in Table 5, in 1987 Armenian exports had a value of about US$ 2.5 billion in world market prices, or 47percent of GDP. Despite some recent improvements (1999-2002), current volumes of manufacturing exports account for not more than 20percent of its pre-transitional level.
Although there were several factors that contributed to this export collapse, including economic blockade and other supply side restrictions, the loss of external markets and extensive changes in relative prices seems to have made a key contribution to this process.
There were three main components of the overall decline in external demand for Armenian goods in 1992-1993:
1. Overall decline in import demand in the FSU, as well as a shift in the commodity composition of imports, caused by the collapse of regional income aggregates;
2. Decline in the share of inter-FSU countries trade in the total FSU external trade, derived from the competitive pressures from the rest of the world;
-0.40 -0.30 -0.20 -0.10 0.00 0.10 0.20 0.30 0.40 0.50
POWER
FERROUS
NON-FERROUS CHEMICALS
MACHINERY
WOOD&PAPER
CONSRUCTION MATER. LIGHT INDUSTRY
FOOD PRODUCTS
Weighted Average Gross operating surpluses per unit of output (1987 ruble terms)
3. Additional commodity/sector specific factors: in Armenia this effect was the most profound in the defense industry, as Russia and other FSU states went through a major (and well deserved) contraction in defense spending in the early 90-s; when this spending partially recovered later in the period, Armenian exports in the sector were effectively replaced by components and parts produced domestically by Russian firms.
Our evaluation of the direct impact of external demand shock on Armenian export is based on the following assumptions and proxies:
• Due to data limitations, changes in exports to Russia are selected to represent the demand trend for the entire FSU market. (Export to Russia are estimated to account for more than 70percent of the total Armenian export in 1987)
• Armenian exports to Russia in the base year (1987) were converted into WMP with the price conversion factors that correspond to the entire Armenian export to the FSU.
• It is assumed that the trend in Russia’s demand for Armenian exports was similar to Russia’s demand for overall FSU export; in other words, it is assumed that Armenian goods remained competitive in the Russian market relative to the similar goods produced in the other FSU republics, i.e. no substitution took place of Armenian import by imports from the rest of the FSU.
• Only Armenia’s main export sectors were analyzed; we reviewed trends in Russian imports from the FSU for five leading sectors: machinery, light industry, food processing, power, and chemicals. Those sectors combined represented more than 85percent of the total Armenian export in 1987.
• It was additionally assumed that export demand in the (defense-related) part of the machinery sector declined by an additional 50percent compared to the decline reflected in the data on (mostly civilian) machinery imports, as reported by official statistics.
These main assumptions are summarized in Table 10. We estimate that the FSU demand for main Armenian manufacturing goods declined by 3-10 times, with the power (electricity) and machinery (engineering) sectors being the most affected.
The decline in Armenian export to Russia/FSU for each industrial sector was estimated as the product of two sector-specific import indices for Russia:
a) total index of import decline, calculated as the ratio of the total 1994 Russian imports in this sector (in US dollars) to the 1987 imports, valued in world market prices; and
Table 10. Impact of the demand shock on Armenia’s export to the FSU: specific estimates and assumptions.
Estimated after shock export demand, % of
1987 level
Contribution of individual factors (total = 100)
Imports decline in
the FSU Competition
Sector specific
factors
Power and Fuel 10% 100% 0% 0%
Chemicals 35% 53% 47% 0%
Machinery 10% 45% 5% 50%
Light 24% 50% 50% 0%
Food processing 17% 80% 20% 0%
[image:23.612.85.526.580.712.2]
Table 11 summarizes the main results of the external demand shock. It suggests that because of this, Armenia lost about $2 billion in industrial exports (about 80percent of its export 1987 level or 25percent of its total pre-transition industrial output), which is equivalent to a loss of about $715 million or 8percent of the pre-transition GDP.
Table 11. External Demand Shock -- Direct Impact
Export in the Base year. in Domestic
Prices
Export in the Base year. in World market
prices
Export Decline due
to demand Shock. as % of Export
in WMP
Export value. adjusted to
External Demand Shock
Export Losses due to External Demand Shock
Direct Impact on the produced gross
value added
1000 Rubles 1000 USD percent 1000 USD 1000 USD 1000 USD
Power and Fuel 36 800 54 925 10% 5 493 -49 433 -18 150
Metallurgy 140 271 177 533 35% 62 136 -115 396 -43 367
Chemicals 409 479 306 356 35% 107 225 -199 131 -104 637
Machinery 1 038 095 977 309 10% 100 201 -877 109 -386 436
Light 1 549 540 508 572 24% 122 057 -386 514 -155 981
Food 589 784 183 860 17% 31 347 -152 513 -36 954
Other Industries 330 249 257 807 35% 90 233 -167 575 -84 596
Total Industry 4 094 218 2 466 363 21% 518 691 -1 947 672 -776 823
Evaluation of the secondary effects and the overall impact of shocks
For evaluation of the cumulative impact of the shocks described in the previous sections, we developed a further expansion of our basic input-output model. The model is presented in Annex 2. The basic idea was to see to what extent losses in income aggregates that are derived from price and demand shocks would affect the total domestic demand, and thus output and GDP. The model was developed based on several assumptions and simplifications.
Specifically, while it appears from our analysis in the previous sections that gross operating margins for some industries deteriorated to an unsustainable level or even became negative, in our analysis in this section we ignored this finding. In other words, we allowed individual industrial sub-sectors to continue their operations, even though they generated negative gross value added.12
We estimated the cumulative effect of transitional shocks under three different sets of assumptions.
1. Initially we produced the most restrictive scenario (A). It assumes:
• full shift of the economy to world market prices
• full demand shock
• unchanged domestic demand structure
• low level of the trade deficit, which was assumed to remain at the original pre-transition level of 1.7percent of GDP
The third assumption above is very restrictive and requires additional clarification. In a scenario A, we disregarded the fact that any changes in relative prices would alter domestic demand, consumption and saving patterns. It is obvious that market liberalization triggered a major shift in domestic demand that could produce some additional (and generally unknown) impact on the overall level of demand in the economy, depending on its particular structure. Unfortunately, in a country with no history of the market economy, there is no rational way for modeling the private sector’s potential demand response of to such drastic relative price and real income changes.
2. In the second scenario (B) we relaxed the 3rd assumption above, i.e. we allowed for a shift in domestic demand in response to both the new income levels and the evolving institutional structure of the economy. We assigned new values to the shares of various components in the final demand by making them equal to actual demand shares observed in 1996. We selected 1996 because this was the first post-stabilization year in Armenia, and the national account statistics seems to be much more reliable than for earlier years that were characterized by high inflation. These old and new shares are summarized in
12
Table 12, which indeed suggests that they are substantially different from those in the pre-transition economy. This indicates that, during the first half of the 90-s, the Armenian economy evolved in a rather traditional way, i.e. it responded to the shocks in a way that is very similar to other market economies that went through liberalization and income decline. In particular, the share of private consumption in the total demand increased considerably, while within private consumption the shares of energy, food processing, agriculture and services had expanded. This could be interpreted as a sign that the Armenian economy was indeed largely liberalized in terms of removing domestic trade and price restrictions.
[image:25.612.82.532.331.537.2]
3. The third scenario (C) is based on an additional relaxation of the 4th assumption above regarding the trade balance. We now assumed that during transition Armenia gained access to considerable financing of its trade deficit that increased in this scenario from the pre-transition level of 1.7percent to 32.7percent of GDP, which was the actual level of trade deficit in 1996.13
Table 12. Structure of the Final Domestic Demand: 1987 current prices, 1987 world market prices, and 1996 current prices
Percent (Share in nominal GDP) Percent (Share in Total final demand)
1987 Current
Prices
1987 World Market Prices
1996 Current
Prices
1987 Current
Prices
1987 World Market Prices
1996 Current
Prices
Final Domestic demand 101.2% 117.7% 132.7% 100.0% 100.0% 100.0%
Final Consumption 68.5% 67.0% 104.2% 67.7% 57.0% 78.5%
Private Final Consumption 55.9% 48.2% 97.4% 55.2% 41.0% 73.4%
Food, beverages, tobacco 30.0% 20.9% 72.6% 29.7% 17.7% 54.7%
Clothing and footwear 8.9% 4.2% 4.9% 8.8% 3.6% 3.7%
Gross rents, fuel and power 2.6% 5.6% 7.0% 2.5% 4.8% 5.2%
Household equipment 6.0% 6.8% 1.7% 5.9% 5.8% 1.3%
Transport and communication 4.4% 6.6% 3.6% 4.4% 5.6% 2.7%
Miscellaneous goods and services 3.9% 4.1% 7.6% 3.9% 3.5% 5.8%
Government Consumption 12.7% 18.8% 14.2% 12.5% 16.0% 10.7%
Gross Capital Formation 33.1% 50.6% 21.1% 32.7% 43.0% 15.9%
Balance of imports and exports -1.7% -17.7% -32.7% -1.7% -15.0% -24.7%
Gross Domestic Product 100.0% 100.0% 100.0% 98.8% 85.0% 75.3%
Note: Government Consumption includes household consumption of services in public education and health, while Private Consumption excludes both.
The selected results for all three scenarios are shown in Table 13.
Table 13 suggests that the full downward effects of transitional shocks in Armenia were indeed very large. In Scenario B the estimated GDP shrank to only 15.2percent of its 1987 dollarized value, while in Scenario C it diminished to 29.8percent of the 1987 value.
13
Table 13. Main estimates for cumulative shock impact, in million $US
Initial, 1987 Memo: Scenario A Scenario B Scenario C
WMP estimates
Isolated Impact of
the Price
Shock Restrictive
Demand shift
Increased trade deficit
Output 12044 8185 1751 1880 3524 GDP proxy 5217 3412 746 793 1555
as % of original GDP 100 65.4 14.3 15.2 29.8
Export 2472.8 2472.8 526.9 526.9 526.9 Import 3437.3 2531.2 539.6 540.7 1029.7 Trade balance -964.5 -58.4 -12.7 -13.8 -502.8
As % of GDP -18.5 -1.7 -1.7 -1.7 -32.3
In both cases the results derived from the model are worse than the Armenian GDP’s actual lowest level in the 90-s, which was 41percent of 1987 GDP in 1993. And this is despite the fact that the actual export in 1996 was only US$ 290 million, i.e. 1.8 times lower than the value estimated by the model.
This suggests that the economy actually performed much better that one may expect based on its initial conditions and the severity of the shocks. The actual nominal GDP in 1996 (US$ 1,599 million) was close to the one projected under Scenario C and almost twice as high than the one in Scenarios A and B. This means that, in the real economy, the economic agents made a considerable adjustment to cope with the external shocks, which resulted in a better utilization of resources14. This scale of actual adjustment in the economy was even greater because, as mentioned before, the real shocks were stronger due to political and other factors, such as the earthquake, war, and blockade.
Why did the economy perform better than one could expect? In our interpretation, market liberalization and economic reforms in general were the primary reason for this success. Liberalization provided economic agents with new incentives, which made them interested in adjusting their behavior, including through better utilization of available resources, more adequate production mix, and more rational consumption. From the very beginning, reforms in Armenia brought very positive results, in the sense that they pushed the economy to a more productive development path than that which existed in the pre-transition period. Therefore, we believe that our results provide considerable support for the hypothesis that, under “the no-reforms scenario,” the impact of external shocks on the Armenian economy would have been much more painful. In other words, we did not find any evidence that the economy incurred any losses in excess of those which were unavoidable in the environment of severe external shocks, i.e. we identified no additional, “avoidable” costs associated with economic reforms.
14
4. Conclusions—comparative impacts of various shocks
[image:27.612.79.529.228.459.2]Table 14 compares the size of various external shocks. The full impacts of price and demand shocks are very similar and amount to about one third of the initial 1987 GDP, while external financing of the trade deficit helps to recover about 15percent of the initial GDP by pushing up domestic demand.
Table 14. Impacts of various shocks, million $US
Shock
impact
% of original GDP
Residual GDP, after shock
% of original GDP Initial GDP 5217
Direct TOT impact -- losses in the trade balance
-860 -16.48 4357 83.52 Full TOT impact -1806 -34.62 3411 65.38
Multiplier (1)
2.1
Direct impact of external demand loss (2) -2665 -51.08 Total full impact of TOT and external
demand
-4471 -85.70 746 14.30 Effect of shift in domestic demand 47 0.9 793 15.20 Full gain from external financing ($500
mln)
762 14.61 1555 29.81 (1) It is interesting to note that the actual multiplier is very close to the conventionally assumed value of 2
(Rodrik, 1992).
(2) In excess of the price shock effect
Our results provide a rather dramatic picture of transitional challenges in Armenia. The full impact of external shocks was a loss of close to 85percent of the original GDP. We also obtained some evidence that several other small FSU economies were likely to be affected by shocks of the same magnitude. Armenia was not the most vulnerable republican economy in the USSR.
Thus, a quick recovery of the pre-reform income levels was impossible and is still impossible in Armenia (at least without losing its political independence). This understanding should be more broadly publicized in order to adjust public expectations. It should also be taken into account when the government designs its industrial policy.
A large part of the core of the traditional industrial sector in Armenia cannot be recovered. Its production cannot be re-oriented toward world markets without major investments, and Armenia does not have domestic savings of such magnitude. As a result, the country is facing the challenge of re-industrialization: building a largely new industrial structure that would be based on different types of industries, be linked to different types of markets, and have enterprises of different, much smaller size. This is a longer term restructuring process.
The basic driver of such restructuring seems to be export. Starting from the premise that Armenian development has to be export-oriented, the next question to ask is how to insert Armenian enterprises into global supply chains. Given Armenia’s existing endowments, there are two prospective types of supply chains for the country. Each, however, offers quite different development opportunities for Armenia, and each needs a special government strategy.15
• Labor-intensive goods such as garments, footwear, basic assembling of consumer goods, etc.
This is a traditional specialization for many low- and middle-income countries. The major lesson for Armenia is that a key to success in this direction relates to developing strong links with global retailers that lead to an intensive transfer of managerial and marketing expertise.
• Knowledge- and information-intensive goods and services such as software and development of electronic components.
This could be the most attractive option for Armenia and, in fact, it has some chances of happening. India is a country from which Armenia could learn how to facilitate industrial expansion in this direction. Israel could be an interesting model to follow five or ten years down the road (but less so now).
In reality, future development will unavoidably combine these two strategic directions. However, the proportions in which they would mix are important. This will depend on a number of factors, such as the speed of upgrading management skills in the skill-based sectors, the country’s capacity to promote itself as an attractive place to make skill-based investments, and trends in both the stock of human capital and capabilities in the education system.16
15
These ideas were suggested to us by Yevgeny Kuznetsov.
16
Annex 1. The procedures for conversion of input-output accounts into the world market prices
1. Tradables:
Sectoral Outputs:
• export prices were used for total output conversion for all sectors with export to output ratios in 1987 equal or more than 50percent and import to total domestic demand ratios equal or less than 50percent;
• export-import weighted average prices for sectors with less than 50percent export to output ratios and less than 50percent import to domestic demand ratios; and for sectors with more than 50percent export to output and more than 50percent import to domestic demand ratios;
• import prices were used for all sectors with less than 50percent export to output and more than 50percent import to domestic demand ratios.
Sectoral Inputs (Intermediary consumption):
• inputs were converted by using corresponding output world market reference prices obtained as set out above.
Sectoral Gross value added (GVA)
• For all sectors GVA was estimated as the difference between sectoral Output and Input, done so in world market prices, as above.
2. Non-tradables:
It is worth noting that for non-tradable sectors re-estimation into the world market prices is much less trivial and requires making a number of simplifications. We explored only one possible approach, in which we assumed that when the economy moves to the world market prices for tradables, producing the previous amount of services/non-tradables in each sector would require the same volume of material inputs and some “reasonable” amount of gross value added to cover costs of the factors of production. The problem with this approach is that one has to predetermine the level of gross value added (GVA). We considered two options for calculating GVA in the non-tradable part of the economy as below, of which Option 1 was actually used for model simulations.
Outputs: For all sectors Output = Input + GVA.
Inputs: The same approach as was used for tradable sectors.
GVA: (Option 1)
GVA: (Option 2)
For each non-tradable sector:
• Compensation of employees: Actual (in 1987 current prices) wage bill levels are deflated with the world market conversion coefficient (1 ruble = US$ 0.54), Which is derived from our estimates for final private consumption;
• Consumption of fixed capital: Actual (in 1987 current prices) depreciation costs are deflated with the world market conversion coefficient (1 ruble = US$ 1.02) obtained for gross capital formation; and
F- final consumption and gross capital formation
FP – final private consumption
G- government consumption
CF- Gross capital formation
(1) : (3) – indicate staged of iterations17.
‘I- .i for columns and j for rows in the input–output table
GDE- is for Gross Domestic Expenditures or Gross Domestic Demand
17
REFERENCES
Aslund, Anders. 2001. The Myth of Output Collapse after Communism. Carnegie Endowment Working Papers. No. 18 (March).
Belkindas, Misha V. and Matthew J. Sagers. 1990. A Preliminary Analysis of Economic Relations among Union Republics of the USSR: 1970-1988. Soviet Geography. pp. 629-656.
Belkindas, Misha V. and Olga V. Ivanova. 1995. Foreign Trade Statistics in the USSR and Successor States. Studies of Economies in Transition. Issue 18. World Bank. Washington, DC
Brown, Stuart S. and Misha V. Belkindas 1990. Who’s Feeding Whom? A Balance of Payments Approach to Soviet Interrepublic Relations. Georgetown University. Department of Economics. Working Paper #90-21. (December).
Berg Andrew, Eduardo Borensztein, Ratha Sahay. and Jeronim Zettelmeyer (1999). The Evolution of Output in Transition Economies: Explaining the Differences. IMF Working Paper No. 73.
Goskomstat. 1990. Narodnoye Khozyaistvo SSSR v 1989 Godu. Moscow, Statistika.
Minasyan G.G., Gevorgyan M.A., Mkrtchyan M. Ts. 1995. Ekonomicheskaya Politika Perekhodnogo Perioda (methodologiya i analysis). M. Delo LTD.
Orlowski, Lucjan. 1993. Indirect Transfers in Trade among Former Soviet Union Republics: Sources, Patterns and Policy Responses in the Post-Soviet Period. Europe-Asia Studies. 45(6).
Rodrik, Dani. 1992. Making Sense of the Soviet Trade Shock in Eastern Europe: A Framework and Some Estimates. in M. Blejer, Calvo, Corichelli, and Gelb (Eds) Eastern Europe in Transition: From Recession to Growth. World Bank Discussion Paper No. 196. Washington, DC.
Tarr, David G. 1994. The Terms-of-Trade Effects of Moving to World Prices in Countries of the Former Soviet Union. Journal of Comparative Economics. 18 (1).
Tarr, David G. 1993. How Moving to World Prices Affects the Terms-of-Trade in 15 Countries of the Former Soviet Union. Policy Research Working Papers 1074. World Bank. Washington, DC.