© 2018, IRJET | Impact Factor value: 7.211 | ISO 9001:2008 Certified Journal | Page 3084
Social Network Analysis using Data Segmentation and Neural Networks
Ahan M R
1, Honnesh Rohmetra
2, Ayush Mungad
31 Dept of Mathematics, BITS Pilani K K Birla Goa Campus, India 2Dept of Computer Science & Information Systems, BITS Pilani, Pilani Campus, India
3Dept of Computer Science & Information Systems, BITS Pilani, Pilani Campus, India
---***---Abstract -
Social Network analysis is one of the most important data analysis methods, where we gather data from the social media and network of a customer. With a lot of research and using different data segmentation and machine learning techniques we gather a deep insight of the kind of profile/category the customer belong to. Furthermore, we explore the possibility of leveraging this model and applying it in various other entities by using K-Means clustering and Natural language Processing into a multi class regression model. Further, we also interpret the model by analyzing the various attributes and use mathematical methods of Graph theory and information gain, to fit the model into an Artificial Neural network(ANN) and produce results as described in the paper.KeyWords: Machine Learning, Loan Default, Data Analysis, Data Segmentation, Graph Theory, Customer Behaviour Analysis.
1. INTRODUCTION
With the advancement of technology, the data and information collected by humans, is experiencing a rapid increase. The information is greatly contributing in analysis and predictions of newer results and produce accurate strata of data, to make decisions based on data analysis algorithms.
Data Segmentation is a particular topic which works mainly in segmenting data and classifying them into different classes based on the clusters formed. Different Machine Learning techniques are beneficial in designing the decision boundary to cluster the data points available.
Social Network is a dense network of various data entries which can be use productively to produce meaningful results, by which a sentimental analysis along with decision trees, we can come to conclusion on the kind of customer background, the person holds and helps in easy delivery of products based on the segmentation of people.
Our main aim, is to segment the target region/area of customers into classes based on significant features which would positively help the company to have a better marketing impact, therefore, minimizing their budget for the same and improving the profit by inducing this model.
Graph: A graph is represented as a pair of sets (V,E), where V is the set of vertices and E is set of edges connecting different vertices. There are two types of graphs, for this particular problem, we define Multi Graph, a type of directed graph as a connection from one person to other, as it is a mutual connection.
1. Data Preprocessing
© 2018, IRJET | Impact Factor value: 7.211 | ISO 9001:2008 Certified Journal | Page 3085 1.1. Data Description
The data is extracted using the APIs available on the respective social media applications. The major ones, as used particularly is Graph API by Facebook and REST API by LinkedIn. The token can be generated easily and can be used to access the interface, and data points gathered can be described as follows.
Moreover,these data points are mapped together, and hence, common connections are given higher weights based on the data extracted using the APIs of the following social network sites.
The given flowchart explains the workflow of data extraction and hence, will be helpful in making a weighted graph network of the features extracted from the text data.
1.2. Normalization
Normalization method is widely used one. This technique is responsible for accomplishing a linear transformation of actual data to the simplest one. It is an important step in data preprocessing and is used before analysis is done.
© 2018, IRJET | Impact Factor value: 7.211 | ISO 9001:2008 Certified Journal | Page 3086 1.3. Attribute based information retrieval
Information based predictions that we derive are mainly used in obtaining the demographics of a person based on his digital footprint, that is, retrieving data from social media networks as shown in the Fig. 1.2.
We obtain the social network information through their social interactions on Internet using the APIs provided with the permission of the user. Then, we extract various details from the user, which carries a timestamp to analyze the data more accurately and gather all the details of the user, such the demographics, which include, age, location, marital status, gender, educational background. We further, analyze the connections the entity holds and use different mathematical algorithms and formulas to analyze the strength of the bond and the density of connection between the network of the person. These personal preferences from social media sites such as Facebook, like the feed on the wall, interests, business activities, friends list and kind of events attended will help in identifying traits worthy of quantifying using Natural Language Processing techniques.
We quantify the attributes, as it is the only way we can represent the entity which is a sentence/word as a parameter to the Artificial Neural network(ANNs), by analyzing the various features and quantifying them by the techniques mentioned below.
a) Energy of the bond: The level of discussion and interaction between a person and his network of friends is also the strength of connection between two nodes, is called the energy of the bond, which is analogous to the problem of a vertex connected to set of other vertices, such that, the graph so formed is a weighted graph where the weights of the edges is the strength of bond, which is equivalent to the number of interactions.
Ene gy Where, i=1,2,...n.
b) Mean energy: We set to classify the set of people into classes where we can differentiate where or not, the person can do so based on his digital social interaction, in a graph, the number of edges connected to th vertex, is defined as the degree of vertex, so we define the mean energy, as:
( )
(Deg ee )
Where is the energy of individual bonds and Degree(v) is degree of vertex. This mean energy will be helpful in comparing the results of various kind of connections of various people in the network.
We define weights W1, W2,…,Wn such that, each class is alloted a set of people based on idea of seg egation based on the problem statement. For example, if we need to determine the modified biased mean energy, where, we basically mean the following result:
( )
(Deg ee )
Where is the energy of individual bonds, is the weight of each bond dependent on the class to which the nodes belong.
Degree(v) is degree of vertex.
1.3.1. Clustering
Now, so as to decide upon the weights W1, W2…,Wn, we have to cluster the given samples of data in order to split the samples and attach these weights depending upon the importance of feature.
We can use the following two clustering techniques in order to cluster the data into a predefined set of clusters:
© 2018, IRJET | Impact Factor value: 7.211 | ISO 9001:2008 Certified Journal | Page 3087 Assignment of Data: For each of the C clusters there is a centroid, each data point is assigned to the nearest cluster based on minimizing the Euclidean distance between the point and the centroid of each cluster.
Updating the centroid step: Thecluster centroid is recomputed in this step, this is done by taking the mean of all the points
in this centroid's cluster.
Now, the algorithm iterates between these two steps, until the number of iterations decided are reached. Hence, K-Means Clustering helps to cluster the data into a predefined number of clusters.
( ) ∑ ∑ (((( ))))
j i
‘||xi - vj||’ is the Euclidean distance between xi and vj
‘ci’ is the numbe of data points in ithcluster.
‘c’ is the number of cluster centers.
2. Agglomerative Clustering- This method is also called as the "bottom-up" clustering. Initially we assign each observation to it's own cluster. Now, in each step we find the distance between any two clusters and join the two clusters which are the closest. The next step is to re compute the centroids and repeat the above step until we have the pre-decided number of clusters K.
1.4. Correlation with the existing database
Over time, the database of customers is filled with features, using feature extraction by finding the correlation of data with the existing fields, we find that, links of people newly joining the network can be given more social status, meaning, the credibility of the person increases, when we find links with the customers already existing in the database.
1.5. Feature Importance Analysis
© 2018, IRJET | Impact Factor value: 7.211 | ISO 9001:2008 Certified Journal | Page 3088 1.5.1 Information Gain
Suppose, we have a set S and we need to divide it into ‘m’ sepa ate classes with known labels that a e c1, c2, c3, …,ck. Now, the set S is to be classified into these m classes. Let S1, S2, S3,…,Sk be the labels attached with the m subsets. Information gain talks about how much ‘info mation’ can a featu e give about the class The Ent opy, which is the impurities in a system of samples, is calculated as follows:
Ent opy of sample ∑
i
log ( )
where is the probability for each class to
The change in entropy of the sample, gives the information gain of a given sample.
Now, the expected information that is required to classify the set S into these m features can be calculated as follows:
( ,S ) ∑i ( )log ( )where is the number of samples of the training data in the class of the
classification and ( )is expected information needed to classify the sample.
If there is an attribute X, in order to calculate the information gain due to this attribute, the set S can be divided into u subsets on the basis of this attribute. Now, ixrepresents the number of samples of the classification on the basis of attribute that lie in the set S1. Hence, the expected information gain due to this partitioning can be given by:
[ ] ∑ (( Skj))
j
( ,S )
The overall gain, can be easily expressed as the difference between the expected information need to classify and the expected information from the partition formed. We represent the overall gain by the greek symbol, (omega).
Now, Overall Gain due to attribute X can be given by:
[ ] C( ,S ) ∑ (( Skj))
j
( ,S )
[ ] ( ,S ) [ ]
The Information Gain calculated for various attributes can be used to rank the importance of the various attributes and can also help in reducing the irrelevant attributes.
1.5.2. Gini Index method for relevance detection
Another method that can be used for determining the relevance of features selected is the Gini Index. This method involves examining the decrease in uncertainty when one of the attributes is used as the basis for classification. It basically is the difference between the ability to classify into various classes before and after the value of a feature is known, meaning, it is an index which determines the difference of impurities before and after the value of features are known. The Gini Index for a feature F is given by:
© 2018, IRJET | Impact Factor value: 7.211 | ISO 9001:2008 Certified Journal | Page 3089 Where,
( )is the prior probability of feature F when it had the value
(
)is the probability of a random sample belonging to the dataset, whose feature F has the value
( )is the prior probability that a random sample belongs to the class
1.6. Text Analysis of Attributes using Natural Language Processing
Text analysis is an important feature as, the raw data available for processing is the feed of social media and other data available on the social media websites. We use tokenization, by the pre-existing library of NLTK(Natural language Toolkit). Tokenization in particular is a process of breaking down the text or sentences into individual words or in other words, we break it into small units and create a new token every time we hit a white space.
We particularly use Word2Vec, which is in specific, a two-layered neural network that processes text and takes text corpus as an input and output is set of feature vectors, that we use further and classify these keywords, to analyze the characteristics of the vectors and cluster them into different classes. It makes highly accurate predictions and helps in tagging closest related words to these vectors. Moreover, these output words would lead to creditworthiness.
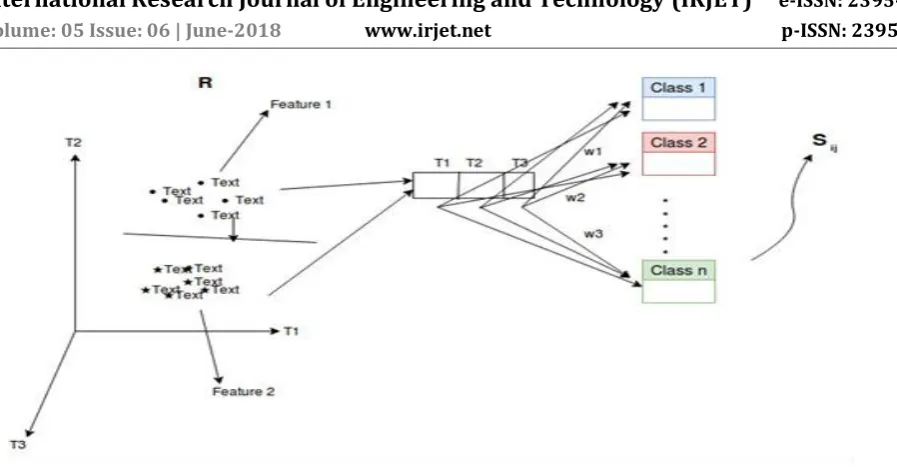
So, in order to extract information related to various attributes that we have selected, we need to analyze the feed and social activity of the person. On the basis of this we can quantify the various qualitative features so as they can be used as an input to the neural network. So, what we do is that for any particular attribute A, we have a set of classes in which the person can be classified. To find out which class of the attribute a person belongs, we extract certain a number of keywords from the social media activity of a person which can be done with any keyword extraction algorithm. Now, these keywords serve as the basis to classify the particular person into a particular category of the attribute.Since, we can find a predefined set of keywords for each of these classes, using the pre-trained set of word vectors obtained from Word2Vec, we can find the cosine similarity between any two set of keywords. Hence, to find the overall similarity between the set of keywords obtained from the activity of the person, and the keywords of each class of attributes, we define a score to find the average simila ity between the two sets of keywo ds of ‘m’ classes of the att ibutes and let R be the set of keywo ds extracted from the social media activity of a person, also Sij represents the jth keyword of the i^th class of the attribute and Ri be the ith keyword of the set R. The similarity score between the ith class of the attribute and the set R is given by:
Sco eiR ean( ∑ ∑ (Simila ity( ij,R ))
j ( )
j k ( )
k
)
Where, we define the keyword, similarity as follows:
Simila ity( ij,R ) cos( ) ij
(( ij) ( )) = Cosine Similarity between the vectors of ijand .
© 2018, IRJET | Impact Factor value: 7.211 | ISO 9001:2008 Certified Journal | Page 3090 Fig 1.6. The architecture of clustering text and classifying into labeled classes
1.7. Architecture of the Network
An Artificial Neural Network is a paradigm for processing data in a way similar to the neurons in the brain. The network consists of a number of interconnected layers similar to the connections of neurons in the brain and information from one node of the network is passed to many other nodes for propagating the information in the initial layers towards the output layer.
© 2018, IRJET | Impact Factor value: 7.211 | ISO 9001:2008 Certified Journal | Page 3091 Description of the Architecture
So, the architecture of the neural network used for analysis of loan default prediction is as follows:
In the input layer we have a eight nodes depending upon the features that we had to extract from the social media data. These are: Age, Mean strength of connection, Marital Status, Annual Income, Loan amount, experience in employment, News Feed and the term for taking the loan.
We have in total 4 layers, out of which two hidden layers are present. Initially we assign random weights to the linkages between nodes of previous layer and the current layer. Now, after training the model on the dataset by back propagation, the weights of these linkages are adjusted.
The model when trained on a total of 200 epochs on a dummy dataset gave an accuracy of 84%. The model couldn’t be t ained on a la ge dataset due to the p ivacy issues in obtaining data But, the p oblem may be solved by taking specific permissions from the people before using their data for applying the model.
Advantages of Neural Network Model
One major advantage of neural networks is that we can make very complex and deep neural networks and train it using the data without thinking about feature selection. The number of hidden layers define the depth of the neu al netwo k Fo counting the total numbe of laye s, we don’t count the input laye Numbe of units of input define the length of the neural network. Before training a neural network, we first initialize the weight matrices(w) and the bias vectors(b). These are known as parameters of the neural network. We should randomly initialize these parameters and multiply it with a small scalar such as 0.01 so that the activation units become active and the derivatives of the activation functions are not close to zero. We need to store all the variables used in each layer in cache so that we can use them in back propagation.
The activation function to be used is a trial and error process. There is no one-size fits all function which we can say is the most accurate always. We need to decide between different activation functions, such as: Sigmoid function, Hyperbolic tangent function, Rectified Linear Unit (ReLU) or Leaky Rectified Linear Unit. We need not have same activation function on each layer, and is varied based on the kind of output and range of output needed.
1.8 Optimizers
Adaptive Gradient(Ada Grad) allows the learning rate to adapt based on parameters. Basically, it has a separate learning rate for each parameter. It performs larger updates for infrequent parameters and smaller updates for frequent one. Because of this it is well suited for Natural Language Processing.
Another advantage is that it basically eliminates the need to tune the learning rate. Each parameter has its own learning rate and due to the peculiarities of the algorithm the learning rate is monotonically decreasing. This causes the biggest disadvantage that Ada Grad has: at some point of time the learning rate becomes so small that the system stops learning. Adam or Adaptive momentum uses the sliding window algorithm and storing momentum changes for each parameter to resolve the problem of monotonically decreasing learning rate in Ada Grad. In Adam, a similar matrix is estimated by moving average to avoid such decay in the learning rate. Similar to Ada Grad,there is a separate learning rate for each parameter but the algorithm does not sum over all past square roots and instead uses a sliding window method taking only a small portion in the denominator.
2) APPLICATIONS
© 2018, IRJET | Impact Factor value: 7.211 | ISO 9001:2008 Certified Journal | Page 3092 We briefly explain the approach and explain some of the key results we found in few of the applications we used this process in:
3.1. Loan eligibility prediction
Social network is a deep and vast network on various nodes, which gives out complex features and deep information of a problem, which can bring out new outcomes and possibilities to a given problem. We leverage this particular strength of resources and build parameters to make classification of customers much easier.
The flow of action is as provided, we access the user information from the APIs of the social network website. Post the access, we extract the set of features from the website and analyze them using the techniques from the paper.
We further classify the customers based on weights given to different attributes, and determine the different level of category of people.
The model is also used to predict defaulting of loans by the customers, it would then be considered, a supervised learning problem, as we train the data using our train data and then test it on real life situations. Social media lets us add a level of additional features such as the sentimental features of the user and cluster the data using Word2Vec or GloVe representation to link the data points to classes.
© 2018, IRJET | Impact Factor value: 7.211 | ISO 9001:2008 Certified Journal | Page 3093 and hypotheses testing required compared with discriminant analysis. However, care must be taken when we are training ANNs, as they can be exposed to the phenomenon of over-fitting.
Future directions in analyzing the performance of ANNs in classification matters may consider using second derivative optimization algorithms when adjusting the network weights. Main reason being that, they may provide superior results compared with the classical gradient descent back-propagation method.
3.1.1. Discriminative factors for default-based model scoring
This score card was made to put out scores for all applicants, for the kind of data analyzed from their social media and then, higher would be the score, lesser would be the probability of default. These variables were just some of the variables from set of 48 calculated parameters. The information gain index, as described before was used to state that, if info mation value was less than 0 24, then it wouldn’t help in data sco ing and wouldn’t be pa t of analysis and co elation analysis with othe va iables
Variable:
Age: {age<25 :6, 25<=age<28 :14, 28<=age<35 :21, 35<=age<49 :39, 49<=age :34}
Sex: {male: 15, female:27}
a ital status: {‘Engaged’:11, ‘In love with’: 11, ‘b oke up’: 9, ‘ issing’: 19, ‘Single’: 20, ‘ a ied’: 31}
Feed: {Positive words: 31, Negative words: 13, Neural views: 19} (using word2vec and NLP techniques)
Years of experience: {years<5 : 10, 5<=years<10: 26, 10<=years<15: 39, 15<=years<20: 38, 20<=years: 31}
Days since last visit on social media: {var<1: 29, 1<=var<5: 31, 5<=var<30: 18, 30<=var<81: 15, 81<=var: 9} (usage of media will help us correlate and understand the reliability and stability of data )
Numbe of places wo ked: {‘Still not wo king yet’: 6, ‘ andom’: 3, ‘missing’: 14, ‘0’: 9, > 1: 21, 1<wo k< 2: 25, 2<work: 23}
There are various other factors, such as ego_index, strength of connections, sociability, Number of children, Number of posts, Major milestones, qualities of person, interactions, trust_factor, privacy_data, relationship strength and many more to give out deep insights and fruitful results in the end from our feed forward neural network.
3.2. Customer Behavior Analysis
We can extrapolate this model to other use cases for providing customized work flows for the customer. Nowadays, companies in different industries such as banking, retail, hospitality and automotive increasingly focus on improving customer relationships and better customer targeting. Thus, they want customized work flows for their different set of customers. Hence, we can use social media analytics for building a personality by their social media behavior.
By leveraging the model proposed companies will get an idea of personality of customer that they are targeting, thus leading to efficient marketing and sales.
4. APPENDIX
4.1.K-means Algorithm
© 2018, IRJET | Impact Factor value: 7.211 | ISO 9001:2008 Certified Journal | Page 3094 k // Number of desired clusters
Output: A set of k clusters.
Step 1:
Arbitrarily choose k data-items from D as initial centroids; Step 2:
Repeat Assign each item to the cluster which has the closest centroid; Step 3:
Calculate new mean for each cluster; Until convergence criteria is met.
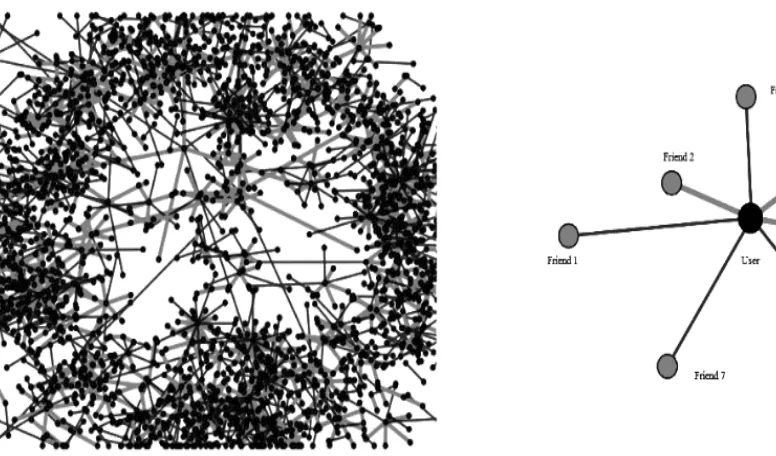
[image:11.595.71.459.243.471.2]4.2. Arrangement of a Social Network environment
Fig.4.2. A description of a deep social network and a particular network of a user
4.3. The plot of results obtained from the dataset
[image:11.595.99.535.535.741.2]© 2018, IRJET | Impact Factor value: 7.211 | ISO 9001:2008 Certified Journal | Page 3095 The data plot shows the outliers and the importance of a few features and how it changes with respect to other factors in the features. Moreover, we can see the change in graphs of the plots using a clear graph.We can also plot graphs such as a datagram, box plot and other features to extract the different features from the dataset.
Moreover, lending dataset is a great portal to pick up data from, but we can also create custom datasets from the social media sites and their developer APIs for extracting datasets and store them in excel spreadsheets.
Moreover, we can also use web scraping techniques such as beautiful soup to scrape data from the feed.
5. CONCLUSION
All the above stated, is possible mainly because of the advancements in the technology to store data and tools available to analyze the digital footprints set out by users, and these data values help us in approximating the kind of sentiments, data for analysis of kind of connections the user holds, links formed and their strength with the people around them, using regression and classification techniques to find out eligibility of the person in various different scenarios, by using mathematical and computation power and thereby, improving the methods of giving out opportunities.
The findings of the links and features from social network data helps in indeed showing the acceptable discriminative power from the traditional methods, especially to differentiate in cases of frauds and general customers.
Furthermore, we see that Gini coefficients would increase when social data predictors and features are added into the neural network to the credit scoring system or any other scoring methods, by including the behavior information of the applicant/ customer.
6. REFERENCES
We would like to thank all the support from everyone, the resources used for the paper, as they gave us a much deeper insight of the problem and understanding from much deeper surface of study.
Journal Papers:
[1] Social media analysis and risk scoring-
https://pdfs.semanticscholar.org/35fe/6cb2a49aca15341f4af6224f7411269af601.pdf
Books:
[2] Baesens, B., and Gestel, T. (2009). Credit Risk Management Basic Concepts: Financial Risk Components,
Rating Analysis, Models,Economic and Regulatory Capital. Oxford
[3] Ball S, Eckel C, Grossman P, Zame W (2001) Status in markets. Quart. J. Econom.116(1):161–188.
Papers:
[4] Adam: optimization methods (Diederik P. Kingma, University of Amsterdam, OpenAI)-
https://arxiv.org/pdf/1412.6980.pdf
[5] Decision Making and business intelligence-
https://bijournal.hse.ru/data/2015/10/12/1076342406/2.pdf
[6] Retail credit scoring using fine grained data-
https://www.business-school.ed.ac.uk/crc/wp-content/uploads/sites/55/2018/01/05-Ellen_Tobback.pdf
[7] Consumer lending using risk based techniques-
© 2018, IRJET | Impact Factor value: 7.211 | ISO 9001:2008 Certified Journal | Page 3096
[8] Social media analysis and risk scoring-
https://pdfs.semanticscholar.org/35fe/6cb2a49aca15341f4af6224f7411269af601.pdf
BIOGRAPHIES
Ahan M R
B.E Electrical and Electronics and MSc. Mathematics at BITS Pilani, Goa Campus. He is a Deep learning and Machine learning enthusiast. He believes that Mathematics is the foundation of any problem and works on integrating solutions.
Honnesh Rohmetra
B.E Computer Science and MSc. Chemistry at BITS Pilani, Pilani Campus. His motto is to solve daily life problems using Computer Science. He is a firm believer that Deep Learning and Computer Vision will change the way “We live ou life” and evolutionize it fo the bette ment of humans
Ayush Mungad