Soil Identification using Field Electrical Resistivity Method
Z A M Hazreek1,8, S Rosli2, W D Chitral, A Fauziah4,9, A T S Azhar5, M Aziman6 and B Ismail7
1,5,6 Faculty of Civil and Environmental Engineering, Universiti Tun Hussein Onn Malaysia, 86400 Batu Pahat Johor, MALAYSIA
2,8 School of Physics, Universiti Sains Malaysia, 11800 USM Penang, MALAYSIA 3,7 Research Center for Soft Soil, Universiti Tun Hussein Onn Malaysia, 86400 Batu Pahat Johor, MALAYSIA
4 School of Civil Engineering, Universiti Sains Malaysia, 14300 Nibong Tebal Penang, MALAYSIA
9 Institute of Postgraduate Studies, Universiti Sains Malaysia, 11800 USM Penang, MALAYSIA
E-mail: [email protected]
Abstract. Geotechnical site investigation with particular reference to soil identification was important in civil engineering works since it reports the soil condition in order to relate the design and construction of the proposed works. In the past, electrical resistivity method (ERM) has widely being used in soil characterization but experienced several black boxes which related to its results and interpretations. Hence, this study performed a field electrical resistivity method (ERM) using ABEM SAS (4000) at two different types of soils (Gravelly SAND and Silty SAND) in order to discover the behavior of electrical resistivity values (ERV) with type of soils studied. Soil basic physical properties was determine thru density (ρ), moisture content (w) and particle size distribution (d) in order to verify the ERV obtained from each type of soil investigated. It was found that the ERV of Gravelly SAND (278 Ωm & 285 Ωm) was slightly higher than Silty SAND (223 Ωm & 199 Ωm) due to the uncertainties nature of soils. This finding has showed that the results obtained from ERM need to be interpreted based on strong supported findings such as using direct test from soil laboratory data. Furthermore, this study was able to prove that the ERM can be established as an alternative tool in soil identification provided it was being verified thru other relevance information such as using geotechnical properties.
1. Introduction
Conventional soil identification commonly involved the process of soil sampling and laboratory experiment. Soil sampling was obtained either from disturbed or undisturbed condition during the site investigation works. Then, several testing related to index properties determination was performed using particle size distribution (sieve test), density, water content, Atterberg limits (liquid limit and plastic limit test), etc. Those classical soil identification processes may faced limitation due to the cost and time particularly when it deals with large and difficult construction area. Moreover, conventional site investigation tools such as drilling methods experience difficulties in steep and hilly terrain, swampy areas, coastal regions and complex geomaterial areas which need to be investigated [1]. According to [2], high number of soil sampling was required in order to achieve high accuracy of soil
ScieTech 2015 IOP Publishing
properties assessment and as reported by [3], this objective was hard to achieve by conventional sampling which generally time-consuming and costly. Conventional laboratory experimental testing also can be very costly and took a longer time when dealing upon large number of soil.
Nowadays, geophysical method involving electrical resistivity, seismic, gravity, ground penetrating
radar, magnetic, etc has increasingly applied in site investigation. Geophysical method applies the
principles of physics properties in studying the earth such as resistivity, velocity, density, magnetic susceptibility, etc. General utilization of geophysical method was related to engineering, environment and archeological studies. The main purposed of geophysical method adoption in those areas was mainly focused on mapping or detection purposes. From past experienced, geophysical method has been recognized as an alternative tool in engineering, environmental and archeological studies which able to produced good efficiency due to the cost, time and data coverage. As reported by [1] and [4] – [6], geophysical techniques contributes several advantages such as it can be performed fast and low cost and has the ability to cover greater areas more thoroughly. However, the standard performance of individual geophysical method always depends on fundamental physical limitation (e.g. penetration, resolution, and signal to-noise ratio) [7].
Electrical resistivity method has widely used in soil profiling. Currently, the main purpose of ERM utilization was heavily used as detection and mapping tools related to locate boulder, bedrock and overburden materials [8] and [9]. However, several considerations related to results reliability are still been discussed and argued between those related parties (geophysicists, engineers, geologists, etc). Traditionally, the entire process of electrical resistivity method (field measurement (data acquisition), data analysis (processing) and results interpretation) has been performed by geophysicists due to its field of expertise. However, lack of cooperation with other related expert may cause some unreliable outcome due to the weak result interpretation and justification. In the past, geophysicists are too obsessed with the qualitative anomaly changes during the interpretation stage. That scenario has create some difficulty to the geotechnical engineers since most of the electrical resistivity results and justification was too abstract which always changes relative to the individual interpreter. Major problem in geophysical data interpretation was often a result arising from ambiguous data since the process of field measurement (data acquisition), data processing and interpretation was always exposed to noise which may influenced by devices, earth and environmental uncertainties or human factor (e.g. equipment operator) culminating in the geophysical data ambiguity [10]. Moreover, electrical resistivity value result interpretation was always exposed to the limitation with particular reference to the geomaterial resistivity overlapping properties. According to [11], previous ERV geomaterial reference charts and tables are not easily adaptable due to its wide range of variation in the
parametric values and the overlapping values. Moreover, [12] has reported that the electrical resistivity value used to characterize subsurface profile material is necessarily subjected to local ground conditions, and the characterization occurs within overlapping classifications. In current geotechnical site assessment, the engineer desires strong verification from the geophysicist since the electrical resistivity method was a non-destructive method which being performed thru surface measurement to determine the subsurface profile. Geophysicists still possess only limited appreciation of the engineer's point of view due to the lack knowledge of the mechanics of soils. Geophysical methods are unable to stand alone in order to provide solutions to any particular problems [13] and [14].
Hence, strong verification from direct test (field test, experimental test, etc.) was important to support the electrical resistivity anomaly interpretation. Geophysical method has a good prospect in order to solve some of the problems related to the conventional site investigation methods [15]. As a result, this study performed a field electrical resistivity test for soil identification purposes together with in situ and laboratory soil geotechnical properties verification in order to reduced electrical resistivity anomaly ambiguity interpretation thus increased confidence level of the results interpretation and conclusion produced.
ScieTech 2015 IOP Publishing
2. Materials and Methods
This study was divided into three (3) stages via fieldwork, laboratory test and data processing. Firstly, field 2-D electrical resistivity survey (2DERS) was conducted using ABEM SAS 4000 equipment at two different sites particularly in Kuala Kangsar, Perak Malaysia and Lenggong, Perak Malaysia representing two different types of soil investigated. Testing configuration was based on Schlumberger array using two (2) resistivity land cables, forty one (41) numbers of electrode and forty two (42) numbers of jumper cable. Equal electrode spacing of 0.05 meter was used for all 41 electrodes producing total electrical resistivity survey length of 2.0 meter. Immediately after the 2DERS finished, two different point of the field density test was performed using sand replacement method in line within 2DERS as referred to [16]. Fieldwork schematic diagram representing soil sampling and
2DERS line alignment was given in Figure 1. Soil sample obtained from field was taken to the
[image:3.595.173.430.399.528.2]geotechnical laboratory for water content, particle size distribution (dry and wet sieve) and specific gravity tests as referred to [16]. Finally, raw data from field 2DERS (Terrameter SAS 4000 data logger) was transferred to the computer for processing. During the processing stage, smooth constraint least square method was used in order to produce a smooth boundary representing soil material underneath. According to [11], smooth constraint least square method will produce a smooth boundary change which was considered more suitable for representing the soil material in contrast with rock and fractured material which preferred to analyzed using a robust method due to its sharp geomaterial boundary
.
RES2DINV commercialize software [17] was used to process and analyze the raw data thus producing an inverse model that estimate the actual subsurface structure. The inversion algorithm of RES2DINV was used to process the data, as proposed by [18] in order to obtain the 2-D resistivity section.Figure 1. Schematic diagram of the soil sampling and testing position together with resistivity line alignment (drawing not to scale).
3. Results and Discussions
All results presented and discussed are based on field electrical resistivity value (ERV) which being verified using basic geotechnical properties as given in Figure 2 – 3 and Table 1 – 2.
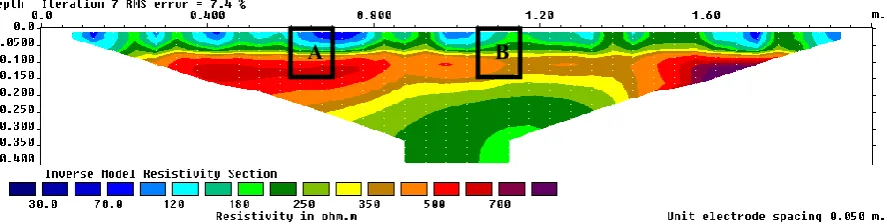
Figure 2. 2D electrical resistivity section and localize selected point of ERV for Gravelly SAND.
A B
2 m
A B
Soil density test & sampling
2D electrical resistivity survey
1st electrode 41th electrode
ScieTech 2015 IOP Publishing
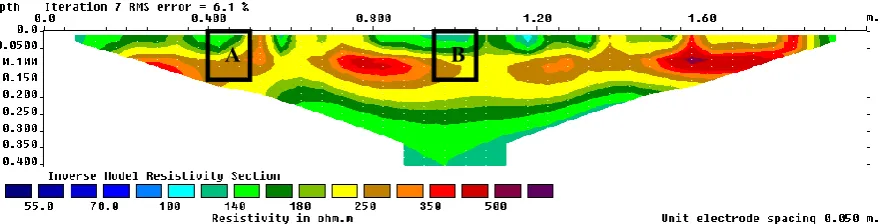
[image:3.595.77.521.626.738.2]Figure 3. 2D electrical resistivity section and localize selected point of ERV for Silty SAND. Electrical resistivity value (ERV) was determined by measuring the potential difference at points on the ground surface which caused the propagation of direct current through the subsurface [19]. Based on Figure 2 and 3, it was found that the ERV for Gravelly SAND (A = 278 Ωm & B = 285 Ωm) was greater than Silty SAND (A = 223 Ωm & B = 199 Ωm). As reported by [20] and [21], the ERV value for sand and wet silty sand is in the range of 10 – 800 Ωm and 100 – 250 Ωm respectively. Hence, this outcome has proved that the electrical resistivity method was able to mapped different type of soils thus contributed in assisting geotechnical engineer for field soil identification. However, the reliability of this finding was difficult to accept due to its qualitative anomaly perspectives. Electrical resistivity value is highly influenced by water concentration and lithology variations [22]. Hence, those electrical resistivity anomaly need to be verified using basic soil properties obtained from geotechnical field and laboratory tests as given in Table 1 and 2.
Soil classification test using particle size distribution test (dry and wet sieve) showed that soil at Kuala Kangsar was classed as Gravelly SAND while soil at Lenggong was classed as Silty SAND. It was found that the soil at Kuala Kangsar was dominated by coarse grained soil (sand and gravel) while soil at Lenggong consist of a mixture from fine (clay and silt) and coarse (sand and gravel) grained soil. For both sites, individual soil particle quantity obtained from the particle distribution test was analyzed and presented in Table 1 and 2. It was found that, soil moisture content (w) for Gravelly SAND (A = 6.62 % & B = 5.50 %) was lower than Silty SAND (A = 13.03 % & B = 14.27 %) as shown in Table 1 and 2. As stated by [23], electrical current may propagate in geomaterial via the process of electrolysis where the current was carried by ions at a comparatively slow rate. The application of field electrical resistivity has theoretically stated that the water content in subsurface materials has a close positive correlation with the electrical conductivity [24]. The variation of soil moisture content for Gravelly SAND and Silty SAND may due to the variation of porosity derived from different particle grained fraction between both soils thus influencing the variation of ERV. Silty SAND has great ability to absorb and retained more water due to its high composition of fine grained soil (clay and silt). Moreover, high composition of fine grained soil may produce low permeability thus has higher capacity to retained more water in order to produced high soil moisture content. In contrast, Gravelly SAND has lower ability to absorbed more water due to its high coarse grained particle (sand and gravel) which easily permit the water to seep thru (higher permeability) underneath. This study found that Gravelly SAND (A = 0.319 & B = 0.362) has more soil porosity compared to the Silty SAND (A = 0.271 & B = 0.256). This condition may due to the soil composition such as Gravelly SAND composed more coarse grained soil while Silty SAND consists of a mixture from fine and coarse grain soil. Soil porosity will decreased due to the high existing of fine grained soil since more void was filled by small grain soil as experienced by Silty SAND. This study has revealed that the ERV of Gravelly SAND was greater than Silty SAND due to the low soil moisture content and high air filled void. As reported by [25] – [32], air filled void posses a higher resistivity value compared with the water filled void. Higher soil moisture content and fine grained soil (clay and silt) has influenced the lower ERV of Silty SAND compared to the Gravelly SAND ERV. Soil’s electrical
A B
ScieTech 2015 IOP Publishing
resistivity value generally varies inversely proportional to the water content and dissolved ion concentration as clayey soil exhibit high dissolved ion composition, lowest resistivity of all soil materials was a wet clayey soils while dry sand, coarse and gravel deposits and massive bedded and hard bedrocks have the highest ERV [4]. Based on Table 1 and 2, it was found that soil density of Silty SAND was higher than Gravelly SAND. This condition may due to the high soil moisture content within Silty SAND compared to the Gravelly SAND. Hence, this finding has revealed that high soil density cannot easily interpreted as granular soil since a mixture of fine and granular soil will also produced greater density with the existing of high quantity of soil moisture content.
[image:5.595.92.503.392.550.2]This study has demonstrated that the electrical resistivity method proves to have good prospects in soil identification determination. Prediction of soil types can easily be determined at field which enables the engineers in fast, economically and able to obtain more data. This study also can contribute to the enhancement of anomaly interpretation which is traditionally too much relative based on stand-alone qualitative approach. According to [14] and [33] methods are insufficient to stand alone in order to provide solutions to particular problems. This technique was applicable to assist and improve the confidence level of conventional electrical resistivity anomaly interpretation due to its ability to verify type of soils interpreted based on quantification of geotechnical properties. Geotechnical property quantification is an important factor for geophysical method used in engineering application [34]. Hence, the reliability of traditional anomaly interpretation and conclusion can be increased using supported additional geotechnical data with particular reference to soil moisture content, grain size fraction, void ratio and porosity, density, etc.
Table 1. Extracted ERV, soil grain fraction and moisture content properties of Gravelly SAND.
Soil Sample A B
Electrical resistivity,
ρ (Ωm) 278 285
Moisture content, w (%) 6.62 5.50
Bulk Density, ρBulk (Mg/m3)
1.77 1.67
Dry Density,
ΡDry (Mg/m3) 1.66 1.58
Void ratio, e 0.468 0.566
Porosity, η 0.319 0.362
Particle size analysis, d
(μm – mm, %) Clay Silt Sand Gravel Clay Silt Sand Gravel 0.00 4.24 67.85 27.10 0.00 3.35 65.36 30.41
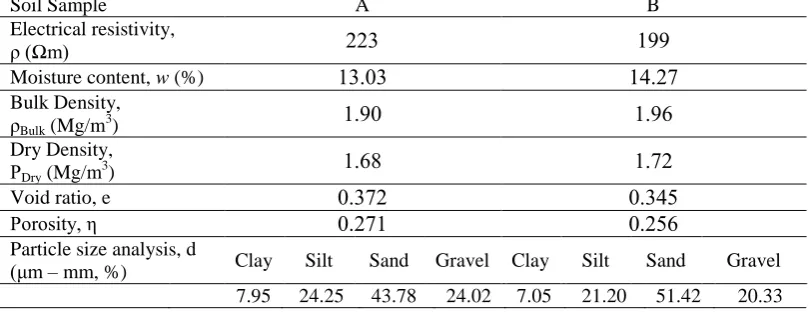
Table 2. Extracted ERV, soil grain fraction and moisture content properties of Silty SAND.
Soil Sample A B
Electrical resistivity,
ρ (Ωm) 223 199
Moisture content, w (%) 13.03 14.27
Bulk Density, ρBulk (Mg/m3)
1.90 1.96
Dry Density,
ΡDry (Mg/m3) 1.68 1.72
Void ratio, e 0.372 0.345
Porosity, η 0.271 0.256
Particle size analysis, d
(μm – mm, %) Clay Silt Sand Gravel Clay Silt Sand Gravel 7.95 24.25 43.78 24.02 7.05 21.20 51.42 20.33
4. Conclusion
ScieTech 2015 IOP Publishing
[image:5.595.96.501.579.735.2]Electrical resistivity method was successfully performed for field soil identification. Conventional electrical resistivity anomaly interpretation for field soil identification purpose will increasingly meaningful due to the supported additional basic soil properties verification. Electrical resistivity value was relatively influenced by the variation of basic geotechnical properties related to soil moisture content, grain size fraction, porosity, density, etc. Hence, this study has shown that the application of field electrical resistivity method together with supported basic soil properties data was applicable to identify type of soils which efficient in term of cost, time and more data coverage compared to the previous conventional method. Furthermore, electrical resistivity technique used surface method which able to eliminate site damageability thus contributes to the sustainable and green environment in construction industry.
Acknowledgment
This research was funded by Universiti Tun Hussein Onn Malaysia (E040) and Universiti Sains Malaysia. First author wish to acknowledge gratefully to supervisors and research members for their tremendous guidance, work and cooperation.
References
[1] Khatri R, Shrivastava V K and Chandak R 2011 Correlation between vertical electric sounding
and conventional methods of geotechnical site investigation Int. Journal of Advanced
Engineering Sciences and Technologies. 4042-053
[2] Pozdnyakova A and Pozdnyakova L 2002 Electrical fields and soil properties. Proceedings of
17th World Congress of Soil Science. 53 1-11
[3] Osman F I S and Osman, S B A S 2012 Integrating geo-electrical and geotechnical data for soil
characterization. International Journal of Applied Physics and Mathematics. 2 104-106
[4] Liu C and Evett J B 2008 Soils and Foundation (New Jersey: Pearson International)
[5] Godio A, Strobbia C and De Bacco G 2005 Geophysical characterisation of a rockslide in an
alpine region Engineering Geology. 83 273-286
[6] Cosenza P, Marmet E, Rejiba F, Jun Cui Y, Tabbagh A and Charlery Y 2006 Correlations
between geotechnical and electrical data: A case study at Garchy in France Journal of
Applied Geophysics.60 165-178
[7] Mauritsch H J, Seiberl W, Arndt R, Romer A, Schneiderbauer K and Sendlhofer G P 2000
Geophysical investigations of large landslides in the Carnic Region of Southern Austria
Engineering Geology.56 373-388
[8] Saad R, Muztaza N M and Mohamad E T 2011 The 2D Electrical Resistivity Tomography
(ERT) Study for Civil and Geotechnical Engineering Purposes Electronic Journal of
Geotechnical Engineering.16 1537-1545
[9] Chik Z and Islam S M T 2012 Finding Soil Particle Size through Electrical Resistivity in Soil
Site Investigations Electronic Journal of Geotechnical Engineering.17 1867-1876
[10] Abidin M H Z, Wijeyesekera D C, Saad R and Ahmad F 2013 The Influence of Soil Moisture
Content and Grain Size Characteristics on its Field Electrical Resistivity Electronic Journal
of Geotechnical Engineering.18/D 699-705
[11] Abidin M H Z, Saad R, Ahmad F, Wijeyesekera D C and Baharuddin M F T 2014. Correlation
Analysis between Field Electrical Resistivity Value and Basic Geotechnical Properties. Soil
Mechanics and Foundation Engineering. 51 117-125
[12] Solberg I L, Hansen L, Rønning J S, Haugen E D, Dalsegg E and Tønnesen J 2011 Combined
Geophysical and Geotechnical Approach to Ground Investigations and Hazard Zonation of a
Quick Clay Area, Mid Norway Bulletin of Engineering Geology and the Environment. 71
119-133
[13] Fraiha S G C and Silva J B C 1994 Factor analysis of ambiguity in geophysics, Geophysics.
59 1083-1091
[14] Benson R C, Yuhr L and Kaufmann R D 2003 Some Considerations for Selection and
ScieTech 2015 IOP Publishing
Successful Application of Surface Geophysical Methods Proc.The 3rd Int. Conf. on Applied Geophysics (Orlando, Florida. 2003)
[15] Clayton C R I, Matthews M C and Simons N E 1995 Site Investigation (UK: Blackwell Science
Ltd)
[16] British Standard 1377 1990 Methods of test for Soils for Civil Engineering Purposes
[17] Loke M H, Acworth I and Dahlin T 2003 A comparison of smooth and blocky inversion
methods 2-D electrical imaging surveys. Exploration Geophysysics.34 182–187
[18] Loke M H and Barker R D 1996 Rapid least squares inversion of apparent resistivity
pseudosection using a quasi-Newton method. Geophysical Prospecting44(3) 131–152
[19] Burger H R, Sheehan A F and Jones C H 2006 Introduction to Applied Geophysics (New York:
W.W. Norton & Company)
[20] Telford W M, Geldart L P and Sheriff R E 1976 Applied Geophysics (Cambridge: Cambridge
University Press)
[21] Lee T S 2002. Slope Stability and Stabilization Methods (New York: John Wiley & Sons, Inc.)
[22] Griffiths D H and King R F 1981 Applied Geophysics for Geologist and Engineers-The Element
of Geophysical Prospecting (Oxford: Pergamon Press)
[23] Telford W M, Geldart L P and Sheriff R E 1976 Applied Geophysics (Cambridge: Cambridge
University Press)
[24] Abidin M H Z, Saad R, Ahmad F, Wijeyesekera D C and Baharuddin M F T 2012 Integral
Analysis of Geoelectrical (Resistivity) and Geotechnical (SPT) Data in Slope Stability
Assessment Academic Journal of Science.1 305-316
[25] Jusoh Z 2010 Application of 2-D resistivity imaging and seismic refraction technique in
subsurface investigation for civil engineering, M.S. thesis, Sch. Physics, Science Univ.,
Penang, Malaysia
[26] Abidin M H Z, Ahmad F, Wijeyesekera D C, Saad R and Baharuddin M F T 2013 Soil
resistivity measurements to predict moisture content and density in loose and dense soil
Applied Mechanics and Materials. 353-356 911-917
[27] Abidin M H Z, Wijeyesekera D C Ahmad F, Saad R and Baharuddin M F T 2013 Correlation of
soil box resistivity teston a different moisture content and density for silty sand and gravelly
sand Information Engineering Latters. 3(2) 1-10
[28] Abidin M H Z, Saad R, Ahmad F, Wijeyesekera D C and Yahya A S 2013. Soil moisture
content and density prediction using laboratory resistivity experiment. International Journal
of Engineering and Technology. 5(6) 731-735
[29] Abidin M H Z, Saad R, Ahmad F, Wijeyesekera D C and Yahya A S 2013. The influence of soil
moisture content and density on its small embankment electrical resistivity Recent
Advanced in Civil and Mining Engineering: Proc. of 4th European Conference of Civil Engineering(Antalya, Turkey, 8-10 October 2013) pp 166-174
[30] Abidin M H Z, Saad R, Wijeyesekera D C and Ahmad F 2013 Soil resistivity influence due to
the different utilization of electrical resistivity array Electronic Journal of Geotechnical
Engineering.18/X 5643-5654
[31] Abidin M H Z, Ahmad F, Wijeyesekera D C, Saad R and Baharuddin M F T 2014 Small soil
embankment electrical resistivity value on its array, moisture content and density influences
International Journal of Geology. 8 9-18
[32] Abidin M H Z, Ahmad F, Wijeyesekera D C and Saad R 2014 The influence of basic physical
properties of soil on its soil electrical resistivity valueunder loose and dense condition
Journal of Physics: Conference Series. 49 1-13
[33] Fraiha S G C and Silva J B C 1994 Factor analysis of ambiguity in geophysics. Geophysics. 59
1083 - 1091
[34] Kibria G and Hossain M 2012 Investigation of Geotechnical Parameters Affecting Electrical
Resistivity of Compacted Clays. Journal of Geotechnical and Geoenvironmental
Engineering, 452 1520-1529
ScieTech 2015 IOP Publishing