Comparing Economic Developments in the Greater
China through Building Chinese Consumer
Confidence Indexes
Geoffrey K. F. Tso
*, Jin Li
College of Business, City University of Hong Kong, Tat Chee Avenue, Kowloon Tong, Hong Kong *Corresponding Author: [email protected]
Copyright © 2014 Horizon Research Publishing All rights reserved.
Abstract
Chinese consumer confidence index is the first combined confidence index for four related economies (Mainland China, Hong Kong, Macau and Taiwan) calculated through the same survey and construction methods. It enables both vertical and lateral comparisons among these economies. This paper illustrates the index construction methodology and tests how the index values vary for different consumer types, e.g. gender, income, age and education. The abilities of the indexes to compare economic development, reflect consumer expectations and satisfaction attitudes and forecast the state of the economy are also tested with the first-hand data for more than twenty quarters, collected through longitudinal surveys. The ability to predict expectations for lagged satisfaction is confirmed through regression analysis, which makes the index values reliable. The index’s ability to forecast macroeconomic development is verified by Granger causality tests between the index values and the corresponding macroeconomic indicators. The index can assist governments in locating, summarizing and analyzing existing economic problems and help industries and consumers make more informed economic decisions. It can also be used as a leading indicator for some aspects of economic developments.Keywords
Chinese Consumer Confidence Indexes, Related Places, Comparative Analysis, Forecasting Capability, Economic Development1. Introduction
According to the fifty-year report of the consumer confidence, director Curtin (2000) emphasized the importance of the Michigan's index, stating, "Consumer confidence is now one of the most closely watched indicators of future economic trends" (p. 6). Consumer confidence has been incorporated into many macroeconomic forecast models. With its development, more and more countries, besides United States (Kwan & Cotsomitis, 2004),
have begun to build their own consumer confidence indexes. These include Austria (Golinelli & Parigi, 2003), Canada (Kwan & Cotsomitis, 2006), France, Germany and Italy (Ali, Ray & Davis, 2009), Japan (Kwan & Cotsomitis, 2005), Poland (Sławomir, 2008), Trinidad and Tobago (Sergeant, 2011), South Africa (Khumalo, 2014) and others. However, there is still no explicit definition of "consumer confidence" or a standard method to measure it (Merkel, Langer & Dalia, 2003). One accepted version of its definition is that it is an economic concept and a set of statistical measures (Futhrer, 1993) based on survey results and the role of confidence can influence consumers' decisions to a certain degree.
Although there is no broad agreement on measurements of consumer confidence, researchers have determined that consumer sentiment index or consumer confidence index (CCI) is an indicator to reflect and infer sentiment for consumption in a country or region during a given period. The method is through surveys of consumers' satisfaction and expectations for livelihood levels and economic activities. As mentioned above, this type of index has existed in some countries for a long time. The Michigan Consumer Sentiment Index and Conference Board Consumer Confidence Index in America are two such classical indexes. One started in 1946 as an annual exercise that was later made quarterly in 1952 and finally became a monthly index in 1978. The later was started as a bimonthly index in 1967 and was changed into a monthly index in 1977 (Ludvigson, 2004). At the earliest stage, CCI was used to reflect consumer satisfaction and expectations of economic and financial outlook for the current period and the future.
Cotsomitis & Kwan, 2005; Dees & Brinca, 2011; Khumalo, 2014). Some researchers have also treated the CCI as a social indicator for analyses (Krzysztof & McDonnell, 1995). Compared to the first research stream, which is helpful for improvements of the survey framework, the second one can bring more benefit to the society, as it can help both governments and consumers to make wiser decisions.
On the government side, consumption is an important factor that needs to be predicted, as it constitutes a high proportion of gross domestic product and plays an important role in economic development of countries (Kwan & Cotsomitis, 2005). On the consumer side, the index can provide references for purchasing and employment issues (Futhrer, 1993). Two different perspectives are used for the predictive function of CCI. One view is that CCI can be treated as a synthesis of macroeconomic indicators (Lovell, 1975) or provide additional information on macroeconomic indicators (Ali, Ray & Davis, 2009; Eppright, Arguea & Huth, 1998; Inoue & Lutz, 2004). Besides macroeconomic indicators, researchers have also recognised the role of consumer confidence in forecasting some specific financial indicators, e.g. property prices (Meulen, Micheli & Schmidt, 2014) and stock returns (Chen, 2011). Considering CCI’s significant role in economics, researchers have also incorporated CCI as a macroeconomic indicator to be predicted when forecasting well-known economic indicators (Choi & Varian, 2012; Dong & Bollen, 2014). They use online crowd-sourcing data for prediction of near-term values of macroeconomic indicators including consumer confidence.
The other view states that the forecasting ability of the index is limited. On the one hand, researchers incorporate the CCI into forecasting models and conclude the forecasting capability is limited (Desroches & Gosselin, 2002; Garner, 2002). On the other hand, there has also been evidence that using consumer behavior data for forecasting can outperform the survey-based CCIs (Vosen & Schmidt, 2011). However, much of the work has reached the agreement that the index works well for prediction during some special periods, such as the Michigan Consumer Sentiment Index's successful prediction of the stock market crash in 1987, the Persian Gulf War and the Economic Recession during 1990-1991 in America (Leeper, 1992). For such a kind of recession, Gritten (2011) seeks to explore the magnitude of the change in consumer confidence and how it evolves before and after the recession. The work provides insights into consumer confidence from the viewpoint of household expenditure and budget aspects.
Recently, many countries or regions have begun to show growing interest in constructing their own CCIs, indicating the important role played by CCI in either social life or
economic activities. The Conference Board CCI and the Michigan Consumer Sentiment Index provide two kinds of frameworks for consumer confidence. Both have only five questions in the survey, but the survey questions show different emphases towards consumer attitudes. They also use different sampling methods.
The Chinese Consumer Confidence Indexes (CCCI) covering four regions, Mainland China, Hong Kong, Macau and Taiwan, are based on the mechanism of Conference Board CCI. More details are discussed in Section 2. Although the indexes have existed for a long time in Mainland China and Taiwan, the two indexes have their own survey measurements, making lateral comparisons difficult. In 2008, the Global Financial Crisis attacked the economy in most Asian countries. Hong Kong and Macau were hit heavily.
Since then, the four economies began to work to build the CCCI, to be published quarterly, at the beginning of each January, April, July and October. As special political, cultural and economic relationships exist among those four economies, CCCI can not only show the economic development trends for each but also facilitate vertical and lateral comparisons among them. The primal driving force of CCCI is to work as a leading indicator to forecast the trends of some well-known macroeconomic indicators or activities, which is the same as the target of most previous CCIs in other countries or regions. While extant research has paid attention to long time series index data, newly constructed indexes, for example CCCI, have not been analysed adequately. We monitor the development of CCCI figures to evaluate the performance of our index framework, in order to derive the required modifications and to make it work better. Key findings of the current CCCI are summarized in this paper.
2. Construction of CCCI
Table 1. Survey questions for constructing CCCI
Category Current / Future Conditions Question Details
Economy Current What do you think about the current overall economy of your living area?
Future What is your expectation towards the overall economy of your living area over the next 3 months?
Employment Current
What do you think about the current employment condition in your living area?
Future What is your expectation towards the employment condition in your living area over the next 3 months?
Price Level
Current What is your degree of satisfaction towards the current price level?
Future What is your expectation towards the price level over the next 3 months?
Living Standard
Current What is your degree of satisfaction towards the current living standard of your family?
Future What is your expectation towards the living standard of your family over the next 3 months?
Real Estate Market
Current What is your opinion on the current timing to purchase real estate property?
Future What is your expectation on the timing to purchase real estate property during the next 3 months?
Timing of Stock Investment
Current What is your opinion on the current timing of stock investment?
Future What is your expectation on the timing of stock investment during the next 3 months?
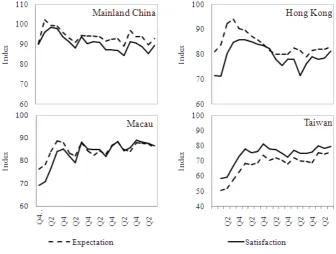
Figure 1. Consumer Confidence Index trend lines for four related places
The computational formulas of the CCI for each place are given by:
𝐶𝐶𝐶𝐶𝐶𝐶=16∑6𝑖𝑖=1𝐶𝐶𝐶𝐶𝐶𝐶𝑖𝑖 (1) 𝐶𝐶𝐶𝐶𝐶𝐶𝑖𝑖=𝛼𝛼𝐶𝐶𝐶𝐶𝐶𝐶𝐶𝐶𝑖𝑖𝐶𝐶+𝛼𝛼𝑓𝑓𝐶𝐶𝐶𝐶𝐶𝐶𝑖𝑖𝑓𝑓 (2)
𝐶𝐶𝐶𝐶𝐶𝐶𝑖𝑖𝐶𝐶 = 100 +��100∗𝑛𝑛𝑖𝑖
𝑃𝑃𝑃𝑃𝐶𝐶
𝑛𝑛 �+�50∗
𝑛𝑛𝑖𝑖𝑃𝑃𝐶𝐶
𝑛𝑛 �+�0∗
𝑛𝑛𝑖𝑖𝐸𝐸𝐶𝐶 𝑛𝑛 � −
�50∗ni𝑀𝑀𝐶𝐶
𝑛𝑛 � − �100∗ 𝑛𝑛𝑖𝑖𝑀𝑀𝑀𝑀𝐶𝐶
𝑛𝑛 �� (3)
𝐶𝐶𝐶𝐶𝐶𝐶𝑖𝑖𝑓𝑓 = 100 +��100∗𝑛𝑛𝑖𝑖𝑃𝑃𝑃𝑃𝑓𝑓
𝑛𝑛 �+�50∗
𝑛𝑛𝑖𝑖𝑃𝑃𝑓𝑓
𝑛𝑛 �+�0∗ 𝑛𝑛𝑖𝑖𝐸𝐸𝑓𝑓
𝑛𝑛 � −
�50∗ni𝑀𝑀𝑓𝑓
𝑛𝑛 � − �100∗ 𝑛𝑛𝑖𝑖𝑀𝑀𝑀𝑀𝑓𝑓
𝑛𝑛 �� (4)
In Equation (1) CCI is the overall score. CCIc and CCIf are for current and future parts, respectively. The weight factors αc and αf are 0.4 and 0.6, respectively, referring to weight values used in the framework of Conference Board CCI. n is the sample size. niPPc and n
i
[image:3.595.57.300.599.752.2]3. Comparison Analyses
Fig. 1 shows that the trend lines of CCCI for the four regions from 2008Q4 to 2013Q3 are all running below the threshold value of 100. This reflects that consumers in these places lacked confidence in local economic activities during this period. After the financial crisis in 2008, CCIs of Hong Kong, Macau and Taiwan plunged; Mainland China was an exception as it suffered a relatively minor impact during this crisis.
However, fluctuations in Mainland China over the entire period are smaller than in the other three and the standard deviation (3.44) too is the lowest. Taiwan CCI data have the largest standard deviation (8.17) and the numbers for Hong Kong (4.07) and Macau (4.09) are almost the same. The fluctuation range of Mainland China's trend line is 12.5, while it is 13.0 and 14.8 for Hong Kong and Macau, respectively. The CCI for Taiwan shows the largest range of fluctuation, at 28.3. The magnitude of fluctuations in the four economies confirms that the financial crisis of 2008 had minimal impact on Mainland China, which consistently reported the highest values in all quarters. Taiwan's trend line on the other hand displays the lowest values. It shows that consumers in Mainland China are more positive and Taiwan residents are more conservative. The trend lines for Hong Kong and Macau are between those of Mainland China and Taiwan. Macau's consumer confidence was never stronger than Hong Kong's until 2010Q3. From then on, Macau has always been ahead of Hong Kong in terms of consumer confidence. The similarities between these two lines are partly because these two areas have experienced similar histories and both are special administrative regions of China. At last, the gap (the gray area in Fig. 1) between the trend lines is becoming narrower and narrower. During the period before 2010, the gap declined from 41.2 and 46.0 in 2008Q4 and 2009Q1 (respectively) to around 20 in 2010. All the four economies recovered from the financial crisis with different levels of consumer confidence. Then the gap declined to 11.9 and 14.1 in 2013Q2 and 2013Q3, respectively. This is the outcome of higher levels of integration among these four economies, in terms of political, cultural and economic activities, especially among Mainland China, Hong Kong and Macau.
4. CCCI for Different Consumer
Groups
In order to see whether consumers with different demographic backgrounds tend to have different confidence levels, we used the raw data collected from Hong Kong and Taiwan for hypothesis testing for illustration and comparison purposes. For simplicity, we conducted t-test or one-way Analysis of variance (ANOVA) model separately
for the four demographic factors under study, rather than considering their possible interaction effects by building a complicated multi-way ANOVA model.
4.1. Do Males Show Stronger Confidence than Females? Do men and women have the same level of confidence in the economy at the same time? The hypothesis, H0: µmale=µfemale, was tested to see the effects of gender, i.e. whether the mean confidence score is the same for male and female groups.
Based on the 12 quarters survey data, independent-samples t-test is performed to compare the mean values of the two gender groups. The p values of the tests for Hong Kong and Taiwan are p < 0.001 and p = 0.860, respectively, showing that the mean CCI for males and females differ significantly at the 1% level for Hong Kong, while they do not differ for men and women in Taiwan. Furthermore, the mean CCI for men (M = 85.55) is significantly greater at the p < 0.001 level than the mean CCI for women (M = 82.83) in Hong Kong. To strengthen the validity of the result, we use the raw data for each quarter to redo the tests separately. We have at least 1,000 and 2,300 samples collected from Hong Kong and Taiwan, respectively, for every quarter. All 12 sampled data collected from Taiwan show the same result; there is no significant difference between the mean CCI for the two genders. But in Hong Kong, 7 out of the 12 samples indicate that men have significantly stronger confidence than women at p < 0.05 level, with 9 out of the 12 tests being significant at p < 0.1 level.
Based on the test results, we conclude that male and female consumers in Taiwan show the same level of confidence; but male consumers show higher confidence than female consumers in Hong Kong.
4.2. Do Consumers with Different Incomes Show Different Levels of Confidence?
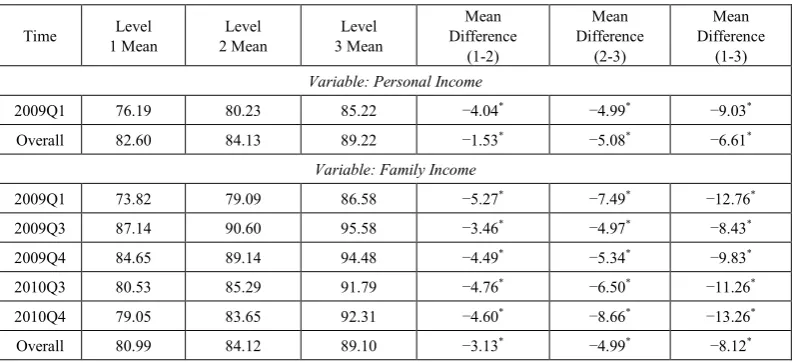
Table 2. LSD Results for Income in Hong Kong
Time 1 Mean Level 2 Mean Level 3 Mean Level Difference Mean
(1-2)
Mean Difference
(2-3)
Mean Difference
(1-3)
Variable: Personal Income
2009Q1 76.19 80.23 85.22 −4.04* −4.99* −9.03*
Overall 82.60 84.13 89.22 −1.53* −5.08* −6.61*
Variable: Family Income
2009Q1 73.82 79.09 86.58 −5.27* −7.49* −12.76*
2009Q3 87.14 90.60 95.58 −3.46* −4.97* −8.43*
2009Q4 84.65 89.14 94.48 −4.49* −5.34* −9.83*
2010Q3 80.53 85.29 91.79 −4.76* −6.50* −11.26*
2010Q4 79.05 83.65 92.31 −4.60* −8.66* −13.26*
Overall 80.99 84.12 89.10 −3.13* −4.99* −8.12*
*. The mean difference is significant at the 0.05 level.
Table 2 shows the results for the two factors. Firstly, personal income has a significant impact on mean CCIs at 5% level. The differences for groups 1 to 2, 2 to 3 and 1 to 3 are all negative, indicating that people with higher personal income level also have higher confidence. The same results can be found among consumers with different family incomes: the higher the family income, the stronger the confidence.
4.3. Are Younger Consumers more Confident than Older Consumers?
The ageing problem is becoming more conspicuous all over the world, so we may ask whether people of different ages have varying levels of confidence in the economy and their living standards. There are six age groups in the Hong Kong samples, group 1 for age 18 to 25, group 2 for 26 to 35, group 3 for 36 to 45, group 4 for 46 to 55, group 5 for 56 to 65 and group 6 for people older than 65. The age range in Taiwan's data is different: group 1 for age 20 to 29, group 2 for 30 to 39, group 3 for 40 to 49, group 4 for 50 to 59 and group 5 for older than 60. Firstly, we use the one-way ANOVA to see if there is sufficient evidence to infer that the mean CCIs of these corresponding population groups differ. 10 out of 12 tests for the 12 quarters of Hong Kong data show significant differences among different age groups at p < 0.05. However, at the same significance level, only 4 out of 12 tests for the 12 quarters of Taiwan data show significant differences among age groups; the other 8 tests accept the null hypothesis that consumers in different age groups have the same average confidence. What we are more interested in is the difference between young and old consumers, so we regroup the sampled data into two groups: young and old.
Since the studied age range is different for the two places, we regroup consumers under 56 into the young age group and others into the old age group for Hong Kong; and use 60 as the grouping threshold for Taiwan, namely, the original groups 1, 2, 3 and 4 belonging to the young age
group and groups 5 and 6 assigned to the old age group in Hong Kong. For Taiwan, the original group 5 is the old group, and the other groups are combined into one (young) group. The hypothesis, H0: µyoung≥ µold, was tested.
After one-way ANOVA for each quarter, Taiwan data indicate no significant difference between the young and the old while Hong Kong data show some exceptions. Three quarters (2009Q4, 2010Q3 and 2011Q2) show enough evidence to reject the null hypothesis with p values being 0.089, < 0.001 and 0.029, respectively. In 2009Q4, 2010Q3 and 2011Q2, the mean CCI for young consumers (M = 89.17, 86.76 and 80.72) is significantly greater than the mean CCI for old consumers (M = 86.63, 81.29 and 77.49) with p values less than 0.1 (p = 0.045, < 0.001 and = 0.015). There is no evidence to conclude that older people in Taiwan have lower confidence than the youngsters.
However, during some periods, young people in Hong Kong show stronger confidence than the seniors. This reflects that age is not a factor that affects the overall CCI in Taiwan but it cannot be neglected in the case of Hong Kong. At the same time, the result can also be used as a reminder for the Hong Kong Government to do more for the elderly people in order to improve their confidence.
4.4. How does Education Level Affect the CCI?
[image:5.595.107.505.87.268.2]Table 3. LSD Results for Education in Hong Kong
Time 1 Mean Level 2 Mean Level 3 Mean Level Difference Mean
(1-2)
Mean Difference
(2-3)
Mean Difference
(1-3)
2009Q3 86.48 90.05 93.52 −3.57* −3.47* −7.04*
2010Q3 80.59 84.54 89.10 −3.94* −4.56* −8.50*
2011Q2 75.92 79.61 82.41 −3.69* −2.80* −6.49*
Overall 81.24 83.17 86.88 −1.93* −3.71* −5.64*
*. The mean difference is significant at the 0.05 level
Table 3 shows that the differences between mean values of levels 1 to 2, 2 to 3, and 1 to 3 are all negative and all are significant at 5% level. This indicates that consumers with higher education level have higher confidence. Do the data from Taiwan show the same trend? The results of one-way ANOVA with combined data show significant mean difference between level 1 and level 2 or 3 only; the mean differences are both positive, with values of 1.33076 (p < 0.001) and 1.33381 (p < 0.001). There is no significant difference between level 2 and 3. When Levels 2 and 3 are combined together and are compared with level 1 again, mean CCIs for level 1 and the new combined level are 67.91 and 66.58, respectively, significant at p < 0.001 level. To conclude, consumers in Hong Kong tend to have higher confidence when their education levels increase. This phenomenon is not found among consumers in Taiwan.
5. Satisfaction and Expectation
Expectation and satisfaction components of the index reflect residents’ psychology when answering questions about the future outlook of their respective economies. In Equation (2), the overall index is the weighted average of satisfaction index and expectation index. Satisfaction index reflects consumers’ satisfaction towards the current economic condition (during the last quarter) while the expectation index measures consumers’ expectation of economic improvements in the next quarter.
5.1. Gap between Expectations and Lagged Satisfactions In each quarter, the expectation and the satisfaction are calculated based on survey results from the same group of respondents (Equations (3) and (4)). Fig. 2 shows the trend lines of these two components. It is observed that respondents give correlated responses towards satisfaction and expectation. The Pearson coefficients for correlation of the two components in Mainland China, Hong Kong, Macau and Taiwan are 0.884, 0.637, 0.879 and 0.958,
respectively and are all significant at 1% level.
An interesting finding is that residents in Mainland China and Hong Kong expect more than satisfaction, almost all the time. As the economy in Mainland China has maintained steady growth during these years and people can learn the information from both official reports and social media, residents in Mainland China are very confident about the future of the economy. After the 2008 financial crisis, Hong Kong economy continued moderate growth, so Hong Kong residents also have a higher confidence in future economic development. For Macau, it shows the same trends from 2008 to 2009. But in recent years, Macau residents do not always have higher expectation than satisfaction, i.e. satisfaction and expectation are almost the same. Taiwan is totally different from these 3 economies; expectation is always lower than the satisfaction, indicating that residents in Taiwan are more conservative towards the future economic developmen
t.
5.2. Expectations Predict Lagged Satisfactions
Different quarters’ survey results are from different groups of respondents. Do consumers predict the development of economy correctly? Is expectation in the previous quarter positively correlated with current quarter’s satisfaction? The Pearson correlations for them in Mainland China, Hong Kong, Macau and Taiwan are 0.494, 0.777, 0.671 and 0.852, respectively and are all significant at 1% level. This evidence shows that consumers have a higher satisfaction level in next quarter if the expectation level is relatively higher in the current quarter. Let St+1 and Et denote the satisfaction index in quarter t + 1 and expectation index in quarter t, then we can use a simple regression equation to test their relationships.
Figure 2. Trend lines of the Satisfaction and Expectation Indexes for four related places
Table 4. Expectations forecasts vis-à-vis lagged satisfaction
Dependent Variable Lagged Satisfaction Index
Mainland Hong Kong Macau Taiwan
Intercept (0.117) 37.5 (0.237) 15.5 (0.669) 8.8 (0.000) 30.4
Expectation Index (0.031) 0.565 (0.000) 0.764 (0.002) 0.890 (0.000) 0.661
R2 0.244 0.604 0.451 0.727
Note: Figures in parentheses are p-values.
Table 4 shows that the expectation index has very significant predictive ability for lagged satisfaction index. The R2 from the regressions for Mainland China, Hong
Kong, Macau and Taiwan are 0.24, 0.60, 0.45 and 0.73, respectively. The survey data for Mainland China is from different provinces, with varying levels of economic development. Therefore, the R2 value for Mainland China is
relatively small. According to the survey, St is mainly to capture consumers’ satisfaction towards some economic activities in the current quarter and Et is to predict the economic development in the next quarter. As Et can explain St+1 well and are calculated with data from different groups of respondents, we conclude that consumer confidence indexes have the capability of forecasting people’s attitudes towards macroeconomic activity and developments.
6. Forecasting
Previous literature has paid much attention to the power of consumer confidence to predict household spending, with long time series data. The most used variable for household spending is Personal Consumption Expenditure (PCE). As
the overall index may weaken the development of each constituent economic activity, the relationships between sub-indexes and the corresponding economic activities are also meaningful. There are six sub-indexes that capture consumers’ attitudes towards these economic developments: Economy, Employment, Price Level, Living Standard, Real Estate Market and Timing of Stock Investment. There are some existing economic statistics or indicators to measure these economic factors: Gross Domestic Product (GDP), Unemployment Rate (UR), Customer Price Index (CPI), Gross National Disposable Income (GNDI) or Overall Median Monthly Employment Incomes (MI), Purchase and Sale of Real Estate (PSRE) or Real House Price Index (RHP), and Real Stock Price Index (RSP). More details can be found from the Appendix.
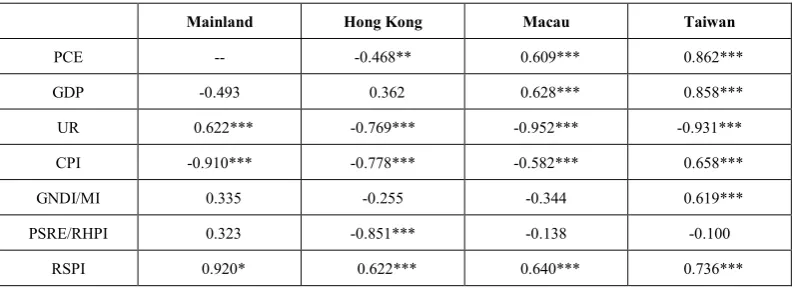
6.1. Correlations between CCCI and Economic Indicators
[image:7.595.132.478.366.453.2]checked to make a preliminary analysis to see whether these data are correlated. The Pearson coefficients of correlations are listed in Table 5.
As Mainland China doesn’t publish statistics for PCE, we checked the correlations between PCE and overall CCI for the three other economies. Macau and Taiwan show good leading ability for PCE as the correlations are 0.609 and 0.862, respectively, indicating that a higher consumer confidence does lead to higher consumption. But the value for Hong Kong is contrary to the expectation, showing a significant negative correlation. Hence, Hong Kong consumer confidence index’s ability to forecast PCE is limited.
GDP is an indicator frequently used to reflect the development of the economy for one region, city or country. The Pearson coefficients of correlations of each pair of economic data for Macau and Taiwan are 0.628 and 0.858, respectively. However, there are no significant correlations between GDP and sub-CCIs for Mainland China and Hong Kong. As CCI is a leading indicator and GDP is lagging behind, the strong positive correlations are evidence of prediction power of CCIs for Macau and Taiwan.
The most widely used measure of employment is the UR. Pearson correlation coefficients for Mainland China, Hong Kong, Macau and Taiwan are 0.622, -0.769, -0.952 and -0.931, respectively. The value for Mainland China is an exception. As the UR in Mainland China covers only towns (not villages) while the survey for consumer confidence covers both towns and villages, the figure in Mainland China doesn’t show the expected correlations. The strong negative correlations show that CCI has the power to predict the UR. Stronger consumer confidence in employment means that the UR is likely to decrease.
Consumers pay serious attention to the timing of stock investment. Different financial markets have their own indexes to indicate the price levels in the financial market. We use the Shanghai Stock Exchange Composite Index, Hang Seng Index and the Taiwan Weighted Average Stock Price Index to indicate the stock market volatility in
Mainland China, Hong Kong and Taiwan, respectively. Since there is no stock market in Macau, considering the historical and cultural reasons, Hang Seng Index in Hong Kong is used. The Pearson correlation coefficients shown in Table 3 for this variable are 0.920, 0.622, 0.640 and 0.736, for Mainland China (but it’s not at the classical levels of significance), Hong Kong, Macau and Taiwan, respectively. These results support the power of CCIs to predict a good time for investment.
CPI is used to measure changes in prices of consumption goods and services purchased by households. We compare the CPI value in each quarter with the corresponding sub-CCI for the price level. As CPI is a lagging behind indicator, if the sub-CCI can show the same trend, we may use CCI to indicate the coming trends of CPI. For Mainland China, the Pearson correlation coefficient for these two indexes is equal to -0.910. The correlation is -0.778 for Hong Kong and -0.582 for Macau. These results show that CPI has a decreasing trend if consumers show stronger confidence in the price level, and vice versa. But the correlation in Taiwan shows an exception, as it has a significant positive relationship with correlation value of 0.855. This indicates Taiwan CCI’s limited capability of measuring price level aspect.
For the Living Standard part, the most widely used indicator is the life quality index. As these four economies have no such indexes, we use GNDI and MI as proxy indicators. The results indicate that it’s significant only in Taiwan with correlation of 0.619.
[image:8.595.107.505.575.719.2]The Centre-City Index is a monthly index which measures the price changes in the real estate market in Hong Kong. The Pearson correlation coefficient between the Centre-City Index and the sub-CCI for the real estate market in Hong Kong is -0.851, which shows a significant negative relationship. This indicates that if consumers show strong confidence in the real estate market, prices are likely to decline in the real estate market, meaning that consumers should buy houses. For Mainland China, Macau and Taiwan, this aspect doesn’t work well.
Table 5. Pearson correlations with one quarter leading CCIs
Mainland Hong Kong Macau Taiwan
PCE -- -0.468** 0.609*** 0.862***
GDP -0.493 0.362 0.628*** 0.858***
UR 0.622*** -0.769*** -0.952*** -0.931***
CPI -0.910*** -0.778*** -0.582*** 0.658***
GNDI/MI 0.335 -0.255 -0.344 0.619***
PSRE/RHPI 0.323 -0.851*** -0.138 -0.100
RSPI 0.920* 0.622*** 0.640*** 0.736***
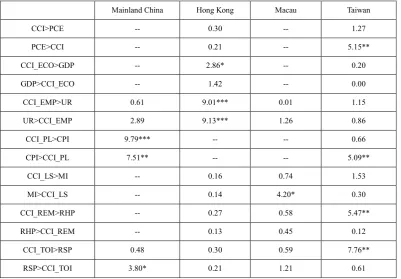
6.2. CCCI Forecast Economic Indicators
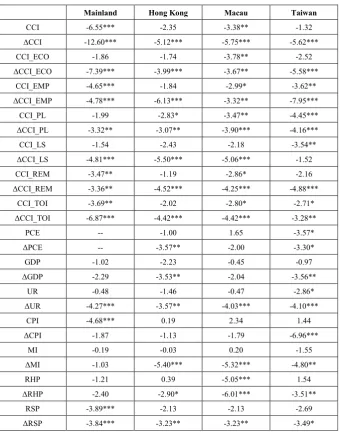
Considering the limitations of correlations, Granger causality test can be used here to test the statistical precedence of CCI / economic statistics over economic statistics / CCI over a short period. With the limitation of short time series data, we only pay attention to I(0) and I(1) variables. Unit root test results for all CCI data and economic statistics can be found in the Appendix.
According to the ADF tests results in Table A.1, it’s found that confidence data for the four economies are all stationary at least at 5% significance level. But I(1) confidence data require first difference to be stationary. Economic statistics or indicators in some places are still not stationary and need first order differencing, e.g. GDP, MI and RHP in Mainland China; CPI in Hong Kong; and PCE, GDP and CPI in Macau. PCE in Mainland China is neglected as no official statistics are available in Mainland China. RHP in Hong Kong and RSP in Taiwan are I(1) at 10% significance level. The other variables can be stationary at least at 5% significance level. According to Loría and Brito (2004), traditional Granger (Granger, 1969) procedure needs to keep variables stationary at the same order. Following Ali, Ray and Davis (2009), we can use the following equations for bivariate Granger causality analysis.
𝐸𝐸𝐸𝐸𝐸𝐸𝐶𝐶𝐸𝐸𝐸𝐸𝑡𝑡=𝛼𝛼0+∑𝑖𝑖=1𝑘𝑘 𝛼𝛼1𝑖𝑖𝐸𝐸𝐸𝐸𝐸𝐸𝐶𝐶𝐸𝐸𝐸𝐸𝑡𝑡−𝑖𝑖+∑𝑘𝑘𝑖𝑖=1𝛼𝛼2𝑖𝑖𝐶𝐶𝐶𝐶𝐶𝐶𝑡𝑡−𝑖𝑖+ 𝑣𝑣1𝑡𝑡 (6) 𝐶𝐶𝐶𝐶𝐶𝐶𝑡𝑡=𝛽𝛽0+∑𝑘𝑘𝑖𝑖=1𝛽𝛽1𝑖𝑖𝐸𝐸𝐸𝐸𝐸𝐸𝐶𝐶𝐸𝐸𝐸𝐸𝑡𝑡−𝑖𝑖+∑𝑘𝑘𝑖𝑖=1𝛽𝛽2𝑖𝑖𝐶𝐶𝐶𝐶𝐶𝐶𝑡𝑡−𝑖𝑖+𝑣𝑣2𝑡𝑡 (7)
EcoInd and CCI are for economic statistics/indicators and CCI data, respectively. 𝑣𝑣1𝑡𝑡 and 𝑣𝑣2𝑡𝑡 are assumed to be not correlated. Using F-test with null hypothesis that there is no explanatory power jointly added by CCI in Equation (6) and by EcoInd in Equation (7), the forecasting abilities of CCI and economic variables can be tested. I(0) variables are used directly in these two equations. For I(1) variables, the first order difference data are used. For each pair of data, the larger lag length is chosen as the lag length, based on the Schwarz information criterion, for the Granger causality test. Results for this test are summarized in Table 6.
[image:9.595.106.508.456.735.2]During the study period, there is no evidence in any of the four economies to support that overall CCI can Granger cause PCE. But the reverse causality for this pair of variables exists for Taiwan. For these sub-CCIs, it’s found that sub-CCIs for Price Level in Mainland China, Economy and Employment in Hong Kong and Real Estate Market and Timing of Stock Investment in Taiwan have a significant Granger causality effect on the corresponding economic developments. There is a significant bi-directional Granger causality between sub-CCIs for Employment and UR in Hong Kong and sub-CCIs for Price Level and CPI in Mainland China. There are also some sub-CCIs Granger caused by economic developments, e.g. sub-CCI for Timing of Stock Investment is Granger caused by RSP in Mainland China; CPI in Taiwan has a Granger causality effect on the sub-CCI for Price Level; and the overall median monthly employment earnings in Macau can Granger cause the sub-CCI for Living Standard at the 10% significance level.
Table 6. Granger causality tests (F-statistic)
Mainland China Hong Kong Macau Taiwan
CCI>PCE -- 0.30 -- 1.27
PCE>CCI -- 0.21 -- 5.15**
CCI_ECO>GDP -- 2.86* -- 0.20
GDP>CCI_ECO -- 1.42 -- 0.00
CCI_EMP>UR 0.61 9.01*** 0.01 1.15
UR>CCI_EMP 2.89 9.13*** 1.26 0.86
CCI_PL>CPI 9.79*** -- -- 0.66
CPI>CCI_PL 7.51** -- -- 5.09**
CCI_LS>MI -- 0.16 0.74 1.53
MI>CCI_LS -- 0.14 4.20* 0.30
CCI_REM>RHP -- 0.27 0.58 5.47**
RHP>CCI_REM -- 0.13 0.45 0.12
CCI_TOI>RSP 0.48 0.30 0.59 7.76**
RSP>CCI_TOI 3.80* 0.21 1.21 0.61
7. Conclusions and Limitations
Firstly, besides reflecting the changing trends of local consumer confidence in the four economies, CCCI can also serve as a yardstick to compare the confidence levels among the people living in the four economies, based on the same construction method. Consumers in Mainland China always show the strongest confidence, but it is decreasing over the study period. On the contrary, consumer confidence for Taiwan is always the lowest but it is with an improving trend. Consumer confidence for Hong Kong and Macau show similar trends with a crossover point found at the 3rd quarter of 2010. At least for Mainland China, Hong Kong and Macau, there seems to exist a higher level of integration among the economies, as time goes on, by including politics, culture and economy; so the consumer confidence and CCI trends for these places are becoming similar to each other.
Secondly, the results show consumers with different demographic backgrounds have different levels of confidence. Generally speaking, Hong Kong female consumers and older consumers have weaker confidence, suggesting that the society has room to improve the wellbeing of these groups of people. It is interesting to observe that this problem does not exist in Taiwan. Furthermore, Hong Kong consumers with high education have stronger confidence, whereas Taiwan consumers with high education have weaker confidence. This indicates that the pattern of confidence levels across different groups of consumers in different economies varies. It provides hints for social scientists about the need for in-depth studies on the existing phenomenon.
Thirdly, the difference between expectation and satisfaction components of CCI reflects that Taiwan residents have relatively conservative outlook towards economic development, compared with Mainland China, Hong Kong and Macau. On the other hand, one quarter leading expectation has predictive capabilities for the lagged satisfaction. As the survey results for different
quarters are from different groups of respondents, it can confirm the accuracy of consumer confidence.
Fourthly, CCCI can serve as a leading indicator for different macroeconomic performance indicators or activities. The strong correlations between the one quarter leading sub-CCIs and their corresponding macroeconomic indicators indicate a good match (The Pearson correlation coefficients between a sub-CCI and its corresponding macroeconomic indicator are significant in major cases among the four economies). But there still exist some sub-CCIs that do not match well. The Granger causality tests also demonstrate the forecasting abilities of sub-CCIs, although this does not apply to all economic activities and for all four economies.
APPENDIX
[image:11.595.136.477.137.570.2]A.1 Unit Root Tests Results
Table A.1 Unit root tests (Augmented Dickey-Fuller)
Mainland Hong Kong Macau Taiwan
CCI -6.55*** -2.35 -3.38** -1.32
ΔCCI -12.60*** -5.12*** -5.75*** -5.62***
CCI_ECO -1.86 -1.74 -3.78** -2.52
ΔCCI_ECO -7.39*** -3.99*** -3.67** -5.58***
CCI_EMP -4.65*** -1.84 -2.99* -3.62**
ΔCCI_EMP -4.78*** -6.13*** -3.32** -7.95***
CCI_PL -1.99 -2.83* -3.47** -4.45***
ΔCCI_PL -3.32** -3.07** -3.90*** -4.16***
CCI_LS -1.54 -2.43 -2.18 -3.54**
ΔCCI_LS -4.81*** -5.50*** -5.06*** -1.52
CCI_REM -3.47** -1.19 -2.86* -2.16
ΔCCI_REM -3.36** -4.52*** -4.25*** -4.88***
CCI_TOI -3.69** -2.02 -2.80* -2.71*
ΔCCI_TOI -6.87*** -4.42*** -4.42*** -3.28**
PCE -- -1.00 1.65 -3.57*
ΔPCE -- -3.57** -2.00 -3.30*
GDP -1.02 -2.23 -0.45 -0.97
ΔGDP -2.29 -3.53** -2.04 -3.56**
UR -0.48 -1.46 -0.47 -2.86*
ΔUR -4.27*** -3.57** -4.03*** -4.10***
CPI -4.68*** 0.19 2.34 1.44
ΔCPI -1.87 -1.13 -1.79 -6.96***
MI -0.19 -0.03 0.20 -1.55
ΔMI -1.03 -5.40*** -5.32*** -4.80**
RHP -1.21 0.39 -5.05*** 1.54
ΔRHP -2.40 -2.90* -6.01*** -3.51**
RSP -3.89*** -2.13 -2.13 -2.69
ΔRSP -3.84*** -3.23** -3.23** -3.49*
***99% significance; **95% significance; *90% significance.
A.2 Data Sources
For Mainland China, the Consumer Confidence Index is from Capital University of Economics and Business and Central University of Finance and Economics. The data of Gross Domestic Product, Unemployment Rate, Customer Price Index, Towner Disposable Income and Purchase and Sale of Commercial Estate are from National Data, http://data.stats.gov.cn. Shanghai Stock Exchange Composite Index is retrieved from http://www.sse.com.cn/.
For Hong Kong, the Consumer Confidence Index is from City University of Hong Kong. The data of Private Consumption Expenditure, Gross Domestic Product, Unemployment Rate, Customer Price Index and Gross National Disposable Income are from Hong Kong Census
and Statistics Department, http://www.censtatd.gov.hk/. The Real House Prices and Real Stock Prices are from Centa-City Index and Hang Seng Index, which can be retrieved from http://hk.centadata.com/cci/cci.htm and http://www.hsi.com.hk/HSI-Net/ respectively.
For Macau, the Consumer Confidence Index is from Macau University of Science and Technology. The data of Private Consumption Expenditure, Gross Domestic Product, Unemployment Rate, Customer Price Index, Overall Median Monthly Employment Earnings and Purchase and Sale of Real Estate are from DSEC, which can be retrieved from http://www.dsec.gov.mo/. Hong Kong Hang Seng Index is used as the stock market proxy that is retrieved from http://www.hsi.com.hk/HSI-Net/.
REFERENCES
[1] Ali, A., Ray, B., &Davis, E. P. (2009). Consumer confidence indices and short-term forecasting of consumption. The Manchester School, 77(1), 96-111.
[2] Chen, S. S. (2011). Lack of consumer confidence and stock returns. Journal of Empirical Finance, 18(2), 225-236. [3] Choi, H. & Varian, C. (2012). Predicting the present with
Google trends. The Economic Record, 88(s1), 2-9.
[4] Cotsomitis, J. A., &Kwan, C. C. (2005). Can consumer confidence forecast household spending? Evidence from the European commission business and consumer surveys. Southern Economic Journal, 72(3), 597–610.
[5] Bram, J., & Ludvigson, S. (1998). Does consumer confidence forecast household expenditure? A sentiment index horse race. Federal Reserve Bank of New York Economic Policy Review, 4(2), 59-78.
[6] Curtin, R. T. (2000). Psychology and macroeconomics: Fifty years of the surveys of Consumers. Telescope on Society: Survey Research and Social Science in the 20th and 21st Centuries. Ann Arbor, Michigan: University of Michigan Press.
[7] Dees, S., &Brinca, P. S. (2011). Consumer confidence as a predictor of consumer spending: evidence for the United States and the Euro Area. Working paper. Retrieved from http://ssrn.com/abstract=1852208
[8] Desroches, B., &Gosselin, M.(2002). The usefulness of consumer confidence indexes in the United States. Bank of
Canada Working Paper. Retrieved from
http://www.bankofcanada.ca/
[9] Dong, X., &Bollen, J. (2014). Computational models of consumer confidence from large-scale online attention data: crowd-sourcing econometrics. Working paper. Retrieved from http://arxiv.org/abs/1409.2129
[10] Eppright, D. R., Arguea, N. M. & Huth, W. L.(1998). Aggregate consumer expectation indexes as indicators of future consumer expenditures. Journal of Economic Psychology, 19(2), 215-235.
[11] Fan, C.Z., & Wong, P. (1998). Does consumer sentiment forecast household spending? The Hong Kong case. Economic Letters, 58(1), 77-84.
[12] Futhrer, J. C. (1993). What role does consumer sentiment play in the U.S. macroeconomy? New England Economic Review, January/February, 32-44.
[13] Garner, A. C. (2002). Consumer confidence after September 11. Economic Review, 87(2), 1-21.
[14] Golinelli, R., &Parigi, G. (2003). What is this thing called confidence? A comparative analysis of consumer confidence indices in eight major countries. Temi Di Discussion Working Paper. Retrieved from http://www.bancaditalia.it/ [15] Granger, W. J. (1969). Investigating causal relations by
econometric models and cross-spectral methods. Econometrica, 37(3),424-438.
[16] Gritten, A. (2011). New insights into consumer confidence in financial services. International Journal of Bank Marketing, 29(2), 90-106.
[17] Howrey, P. E. (2001). The predictive power of the index of consumer sentiment. Bookings Papers on Economic Activity, 2001(1), 175-207.
[18] Inoue, A., & Lutz, K. (2004). In-sample or out-of-sample tests of predictability: Which one should we use? Econometric Reviews, 23(4), 371-402.
[19] Khumalo, J. (2014) Consumer spending and consumer confidence in South Africa: cointegration analysis. Journal of Economics and Behavioral Studies, 6(2), 95-104.
[20] Krzysztof, Z.,& McDonnell, J. S. (1995). Consumer confidence’ indexes as social indicators. Social Indicators Research, 36(3), 227-246.
[21] Kwan, C. C., &Cotsomitis, J. A. (2004). Can consumer attitudes forecast household spending in the United States? Further evidence from the Michigan survey of consumers. Southern Economic Journal, 71(1), 136–144.
[22] Kwan, C. C., & Cotsomitis, J. A. (2005). Does consumer confidence matter for household spending? Evidence from Japan. Working Paper, Department of Economics, Chinese University of Hong Kong.
[23] Kwan, C. C., &Cotsomitis, J. A. (2006). The usefulness of consumer confidence in forecasting household spending in Canada: A national and regional analysis. Economic Inquiry, 44(1), 185-197.
[24] Leeper E. M. (1992). Consumer Attitudes: King for a Day. Federal Reserve Bank of Atlanta Economic Review, 77(3), 1-16.
[25] Loría, E.,& Brito, L. (2004). Is the consumer confidence index a sound predictor of the private demand in the United States? Estudios De EconomíaAplicada, 22(3), 1-15. [26] Lovell, M. C. (1975). Why was the consumer feeling so sad?
Brookings Papers on Economic Activity, 1975(2), 473-479. [27] Ludvigson, S. C. (2004). Consumer confidence and
consumer spending. Journal of Economic Perspectives, 18(2), 29-50
[28] Merkel, D. M., Langer, G. E.,& Dalia, S. (2003, May 15-18). Consumer confidence: Measurement and meaning. Paper presented at the annual conference of the American Association for Public Opinion Research, Nashville, Tennessee. Retrieved from http://abcnews.go.com/
[30] Sergeant, K. A. (2011, June 22-24). Consumer confidence and economic growth: A case study of Trinidad and Tobago. Paper presented at the 4th Biennial International Conference on Business, Banking and Finance, Trinidad. Retrieved from http://www.cepal.org/
[31] Sławomir, D.(2008, October 8-11). Consumer survey data and short-term forecasting of households consumption expenditures in Poland. Paper presented at the 29th CIRET
Conference, Santiago. Retrieved from http://mpra.ub.uni-muenchen.de/