THE ECONOMIC AND SOCIAL
RESEARCH INSTITUTE
Some Irish Population Problems Reconsidered
BRENDAN M. WALSH
November, 1968
Paper No. 42
THE ECONOMIC AND SOCIAL RESEARCH INSTITUTE
COUNCIL 1967-68 J. J. MCELLmOTr, M.A., LL.D.,
President of the Institute. *G. O’BRIEN, D.LITT., LITr.D.,
Chairman of the Council.
C. S. ANDREWS, B.COMM., D.ECON.$C., Chairman, Radio Telefis ]~ireann. T. J. BARRINGTON,
Director, Institute of Public Administration. *J. P. BEDDY, D.ECON.SC., LL.D. (H.C.)
Chairman and Managing Director, The Industrial Credit Co. Ltd.
R. D, C. BLACK, PH.D.,
Professor, Department of Economics, The Queen’s University, Belfast. *F. B. CHUBB, M.A., D.PHIL.,
Professor, Department o[ Political Science, Trinity College, Dublin. VERY REV. D. CREOAN, C.M.,
President, St. Patrick’s Training College, Drumcondra, Dublin. REV. PETER DEMPSEY, O.F.M.CAP., M.A., PH.D., D.D.,
Professor, Department of Applied Psychology. University College, Cork. *M. P. FOGARTY, M.A., D.POL.SOC.SC. (Louvain),
Director of the Institute. *W. A. HONOHAN, M.A., F.I.A.,
Secretary, Department of Social Welfare. *REv. JAMES KAVANAGH, M.A., S.T.L.,
Professor, Department of Social Science, University College, Dubl;n. [VOR KENNY, M.A.,
Director, Irish Management Institute. T. P. LINEHAN, B.E., B.SC.,
Director, Central Statistics Omce. P. LYNCH, M.A.,
Chairman, Medico-Social Research Board. CHARLES MCCARTHY, B.L.,
Chairman, Human Sciences Committee. *M. D. MCCARTHY, M.A., PH.D.,
President, University College, Cork.
G. A. MEAGHER,
Chairman, An Foras Forbartha. *J. F. MEENAN, M.A., B.L.,
Professor of Political Economy, University College, Dublin. J. C, NAGLE, M.COMM.,
Secretary, Department of Agriculture. D. NEVIN,
Assistant General Secretary, Irish Congress of Trade Unions. "REV. J. NEWMAN, M.A., D.PH.,
Professor of Sociology, St. Patrick’s College, Maynooth. L. O’BuACHALLA, M.COMM.,
Professor, Department of Economics, University College, Galway. TADHG O CEARBHAILL,
Secretary, Department of Labour. REv. E. F. O’DOHERTY, M.A., B.D., PH.D.,
Professor, Department of Logic and Psychology, University College, Dublin. D. P. O’MAHONY, M.A., PH.D., B.L.,
Professor, Dcpartment of Economics, University College, Cork. *W. J. L. RYAN, M.A., PH.D.,
Professor of Industrial Economics, Trinity College, Dublin. J. C. TONGE,
T. WALSH, D.SC.,
Director, An Foras Talt~ntais.
*T. K. WHITAKER, M.SC.(ECON.), D.ECON.SC., Secretary, Department of Finance. *Members of Executive Committee.
THE ECONOMIc AND, sociAL RESEARCH INSTITUTE,
SOME IRISH POPULATION PROBLEMS RECONSIDERED,
by Brendan M, Walsh,
CORRECTIONS,
,,Pa~e,25 - Table 14. Instead of head as in text under’ Dependent Var’iable
inser’t’-Si_lPi_l-Pl"j
si-1Pi-1
and instead of head under" Independent Var’iables
insePt:-C 3nstant (Si_lPi_l-Pi)
si-I Pi-1
Page,,30 - Second column (top of page befor’e diagPam) sentence,
Data Sour‘ces : For, Page 69 substitute Page 2~.
Introduction
Part I:
,, II:
,, III: ,, IV:
,, V:
,, VI: Conclusion
Appendices
Data Sources
CONTENTS
The Level and Trend of Irish Nuptiality
Fertility of Irish Marriages
The Relation between Nuptiality and Marriage Fertility Factors Affecting the Rate of Natural Increase
The Impact of Rising Reproduction Rates on the Irish Labour Market
Some Influences on Irish Participation Rates
Page
I
2
4 9
x4 x7
3°
35
37
Preface
The author would like to thank all those who have helped him in the preparation of this study. In particular, R. C. Geary suggested many helpful ideas. Improvements were also suggested by C. E. V. Leser and M. P. Fogarty.
Acknowledgement is made of the use of the facilities of Tufts University Computation Center.
"Through most of this country, great marks of improvement were observable, though its progress had received a severe check during the last two years, the effect of which was peculiarly to aggravate the predominant evil of Ireland, namely a population greatly in excess above the demand for labour .... "
Malthus to Ricardo .Letter of 17 August x8I7.
The. Works and Corre.cpondence of David Ricardo, edited by Piero Sraffa, Volume VII, (Cambridge, x95z), p. x75.
SOME IRISH POPULATION
PROBLEMS RECONSIDERED
by
BRENDAN M. WALSH*
INTRODUCTION
There are two prominent landmarks in the post-war literature on Irish demographic problems, namely, the i954 Reports of the Emigration Com-mission and C. E. V. Leser’s recent paper,x The former is a comprehensive survey of Ireland’s demographic peculiarities, accompanied by judge-ments on their consequences and suggestions for their alleviation. The latter presents a detailed examination of the trends revealed in the returns of the 1961 Census of Population.
The purpose of the present paper can best be explained in reference to this literature. The Emigra-tion Commission gave what has become the standard commentary on Ireland’s poor marriage pattern, high marriage fertility and high emigration. In the first three Parts of this paper an alternative view of the Irish demographic situation is presented. In addition to supplementing the evidence available in the Emigration Commission, the material on fertility and nuptiality presented in this section of the paper forms the basis for an interpretation of Irish demographic trends that assigns low nuptiality the role of offsetting high marriage fertility and thereby keeping the rate of natural increase in check. This view of the situation places Ireland near the end of the transition from high birth and death rates to low birth and death rates that all economically developed countries have undergone: the combination of low marriage rates and high fertility of marriage has also been an intermediate phase for some other European countries, where it was followed by low birth rates achieved by high marriage rates combined with low
1Commission on Emigration and Other Population Problems
Re.ports, (Dublin, 1954) referred to as the Emigration
Com-mlsslon; C. E. V. Leser, "Recent Demographic Developments in Ireland", Reprint No. xo, The Economic Research Institute, (Dublin, 1965).
*Brendan M. Walsh is an Assistant Professor at Tufts University, Massechusetts, U.S.A., who was associated with the Institute during Summer, 1968. The paper has been accepted for publication by the Institute. The author is responsible for the contents of the paper including the views expressed therein.
marriage fertility. Part IV is concerned with the present breakdown in Ireland’s century-and-a-half-old method of population control, occurring as Irish nuptiality rises to more normal levels. The con-sequences for the rate of natural increase of a more nornlal marriage pattern, given the existing level of marriage fertility, are explored. In this area the paper is continuing the work of Leser, who first documented the demographic transformation at present under way in Ireland, but it is not intended to provide predictions about the rate of natural increase in view of the uncertainty regarding the course of fertility.
The overall objective of the paper is twofold. First, a re-evaluation of some important aspects of the Emigration Commission’s interpretation of Irish population problems is presented. This attempt at reinterpretation is important because it provides a fresh look at some of the most fundamental as well as most unusual aspects of Irish society. Secondly, the paper takes the present transformation of the
Irish marriage pattern as the starting point for an analysis of the future course of labour supply in Ireland and its probable effect on emigration. These topics have an important bearing on medium term economic forecasting, but the paper’s relevance to questions of social attitudes and policy is its most urgent claim to attention.
PART I: THE LEVEL AND TREND OF IRISH NUPTIALITY
A useful summary of the level of nuptiality in a population at a point of time is given by the per-centages of single women in each of the age groups between 15 and 5° years. Celibacy in these age
groups reduces the probability of child-bearing
almost to zero in countries (such as Ireland)where illegitimacy is rare. For this reason the level of celibacy in the child-bearing age groups has important repercussions on the rate at which the population is reproducing itself, as will be discussed
in Part III below.
Table I provides a fairly complete international comparison of the level of celibacy among women of child-bearing age, together with information on Ireland at each complete Census since the war. The
omission of underdeveloped countries from Table I is unimportant since high celibacy rates are found only in countries where Western European traditions are strong, and Albania may be taken as represent-ative of the areas outside of Europe and the New World in regard to marriage patterns. The well-known poor marriage record of the Irish is clear from the table, as is the steady upward trend in Irish nuptiality since the war. It is important to note that even in 1966, when the level of celibacy among women aged 25-29 in Ireland had fallen to two-thirds its 1946 level, the percentages single in all the younger age groups in Ireland (which reflect the most recent and highest marriage rates) were still the highest recorded ill any country.
TABI~ 1: PERCENTAGES OF WOMEN SINGLE IN CHILD-BEARING AGE GROUPS IN IRELAND, 1964-I966, AND IN VARIOUS COUNTRIES ABOUT 1961
Age Group Average
Country and Year Duration
I5-19 2O-24 25-29 3o--34 35-39 4o-44 45-49 of Celibac~
Ireland 1966 .... 98"4 74"8 37"8 24"1 2I’2 I9"5 20"4 14"8 Ireland I961 .... 98"9 78"2 45"1 29"6 23"5 22"0 22" I 16"o Ireland 1951 .... 98"9 82"3 54’4 36"4 28"5 26"7 26.3 17"7 Ireland 1946 .... 98"4 82"5 57"5 38"8 32"1 27"6 26"3 18’2
Albania 1955 .... 75 "4 23"8 7"7 3"8 2"5 I’7 1,5 5"8
Austria 196I .. 94"0 58"0 24"2 15"9 14"4 12"4 12"1 1 I’6 Czechoslovakia 1961 .. 91"3 32"8 I0"0 6"9 6"5 6"2 6"2 8"0
Denmark 196o 8.2 8"1 9"5
Germany (BRD) 1961
.. 95"1 45"9 I4"5 9"4 9"4
.. 94"9 54"6 20.8 13"3 12"7 lO"8 9"3 lO’8
Greece 1961 .... 94"2 65"3 34"7 I8"2 10"1 8"2 n.a. n.a.
Hungary 196o .... 85"3 31"4 11"2 8"5 7"6 7"4 7"3 7"9 Netherhinds 196o .... 96"3 59"4 20"5 12"1 lO"4 IO’I I I’O II’O
New Zealand i961 .... 91.6 40"5 I2"4 7"8 7"3 7"4 8"3 8.8 Norway 196o .... 95"2 49"8 17"8 I1"6 lO"9 11"2 12"9 10"5
Peru 196I ... 83 "4 44"2 25"o 17"8 13"2 14.6 I4"5 Io’6 Poland 196o .... 9o’9 40"3 17"3 I4"O 15"1 19.o 24"3 I I’0
Portugal 196o .... 95"3 62"1 32"0 21.8 18.2 16"9 15"9 I3"I Spain i96o ... 97"9 73"4 34"9 2o.1 15"3 15"5 14"6 I3"6
Sweden 196o .. 20"7 11"9 IO’O 9"5 II’0 lO.9
United Kingdom 1;6"i ..
97"3 57"5
93 ’4 42"0 15"7 1o"9 9"8 9"5 lO’5 9"6 United States 196o .... 83"9 28"3 lO’5 6"9 6"1 6.1 6"5 7"4
Venezuela 1961 .... 77"3 41 "8 26.8 22"I 21"3 24" 1 24"6 11.9
Data Sources : United Nations, Demographic Yearbook, 1962, 1963, Tables 13, 34 respectively; C.P., 1966, Vol. II, Table 2.
The last column of Table I provides a summary statistic of the level of celibacy over the child-bearing age groups. This "average duration of celibacy" is calculated as five times the sum of a row divided by ioo: five is the interval of all the age groups, so that
age at marriage and level of permanent celibacy in reducing the exposure of women to marriage over their reproductive life. By this measure the four leading countries are Ireland (1946, 1951, 1961 and 1966), Spain (196o), Portugal (196o) and Venezuela (1961). Some explanation of this pattern of celibacy might be sought in relatively unfavourable male/ female ratios in these countries (due to higher mortality, which would affect males more than females, or to the greater net emigration of males), but in fact much the same pattern of celibacy holds among males, so this hypothesis cannot be accepted. On this evidence the highest levels of celibacy recorded in the world are found in countries with predominantly Catholic populations. The present-day concentration of low marriage rates in Catholic countries does not appear to have received much attention in the literature, although the low nuptiality of the Catholic population of the United States has been remarked.2 Some further con-siderations on this subject will be presented in Part III below.
The data of a row in Table I are collected in a particular Census year and therefore reflect the experiences of different generations. It would be valuable to present information on the percentages of successive generations that were single as they passed through each age group, although a dis-advantage of this longitudinal presentation is that it could only be completed when a generation had reached the age of 50 and would thus lag behind current trends. This dilemma recurs in other demographic situations. Its relevance to the present discussion is that we are made aware of the danger of projecting the reduction in celibacy over time among those aged, for instance, 25-29 into an eventual equal reduction in the percentage celibate in the older age groups. To some extent the higher nuptiality of the younger age groups recorded in the more recent Irish Censuses is due to the falling average age at marriage, rather than to a reduction in permanent celibacy. Table 2 illustrates this point. Looking at the percentages single in two generations of women at different periods in their life-cycle it is clear that the reduction in celibacy between younger women of different generations overstates the eventual reduction in celibacy between the same generations when both have reached age 45-49. Out of I,OOo surviving women born in the period 1917-1921, 364 were single at age 3o-34, compared with 441 out of I,OOO born in i9o2-i9o6: a reduction of 77 per I,OOO. The reduction in celibacy between these two generations at age 45-49 was only 59 per
~Cf. Clyde V. Kiser, "Differential Fertility in the United States", in National Bureau of Economic Research,
Demo-graphic and Economic Change in Developed Countries, (Princeton,
[image:10.610.297.524.73.210.2]i96o), p. Ill.
TABLE 2: CHANGES IN PERCENTAGES OF WOMEN SINGLE IN SELECTED AGE GROUPS AT
SUC-CESSIVE CENSUS YEARS
Women born in: 1917-21 .. 19oz-o6 ..
Percentage Single of Survivors in Ireland
to Age 3o-34 36.4 (a) 44"z (b)
Percentage Single of Survivors in Ireland
to Age 45-49
20"4 (o) 26"3 (a)
(a) Recorded in Census of i951. (b ,, ,, ,, ,, 1936.
(c) ... I966.
(d) ... I951.
Data Source : C.P., 1966, Vol. II, Table z.
I,OOO.a Of course, the fall in average age at marriage in itself represents an important rise in nuptiality.
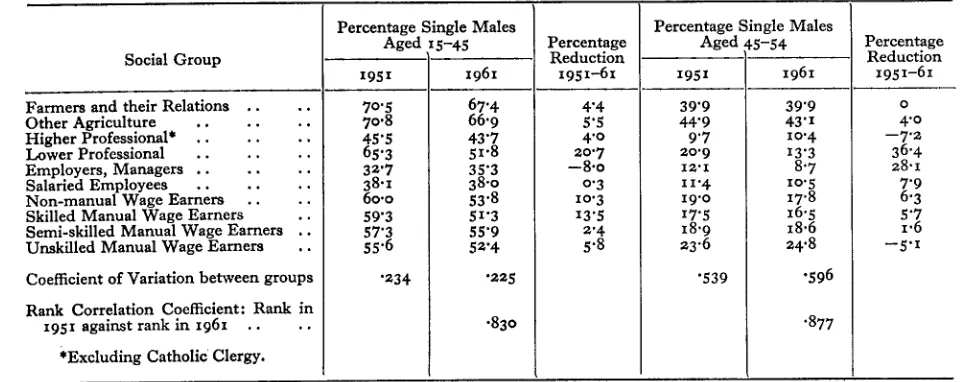
Leser has shown that little of the recent rise in nuptiality is accounted for by the shift of population to urban areasfl This implies that all social groups have participated in the rising marriage rates. To the extent that the 1951 and 1961 Census classifica-tion by social groups roughly overlap,s Table 3 records the decline in celibacy by social group as a percentage of its level in 1951. Celibacy has been measured by the proportion of males aged 15-54 and 45-54 single. Females are classified by social group according to their occupation if they are gainfully occupied or the occupation of the person on whom they are dependent if they are not gainfully occupied; for this reason, and because single females may tend to migrate in search of marriage, the percentages of females single in a social group is not likely to be an accurate measure of celibacy in the social group.
The changes in celibacy by social group among males aged 45-54 are probably affected by the changes in the sex and age composition of these groups (caused by emigration and other factors). No very clear pattern emerges from Table 3, but it is apparent that the fall in celibacy was not confined to any narrow segment of the population. The sub-stantial reduction in celibacy among the "Lower Professional" group is, however, striking. It is also apparent that there is a substantial stability in the position of the social groups in regard to celibacy over the decade: the coefficients of rank correlation between a group’s rank in 1951 and its rank in 1961 are highly significant statistically. In Part III below an attempt is made to explain this pattern of celibacy by social group.
8The higher level of mortality among single persons con-tributes slightly to this outcome.
40p. cit., p. 187.
5The category "Working on Own Account" was discontinued in 196I and its members distributed among the other groups. "Employers and Managers" seems to have been most affected: cf. C.P. z95z, Vol. III, Pt. II, p. vi.
TABLE 3: CELIBACY BY SOCIAL GROUP, 1951-1961
Percentage Single Males Percentage Single Males
Aged ~ 5-45 Percentage Aged 45-54 Percentage
Social Group Reduction Reduction
I95I 1961 1951-6i 1951 i961 1951-61
farmers and their Relations .... 70"5 67"4 4"4 39"9 39"9 o
)ther Agriculture ... 70’8 66"9 5’5 44"9 43"I 4"0
tigher Professional* ... 45 "5 43"7 4.0 9’7 1o"4 --7"2 ~ower Professional ... 65’3 51"8 20"7 20"9 13"3 36"4 ~mployers, Managers ... 32’7 35"3 --8"0 12"1 8"7 28"1
~alaried Employees ... 38"I 38.0 0"3 11"4 1o"5 7"9
~on-manual Wage Earners
;killed Manual Wage Earners" " ..
60"0 53"8 1o"3 19"0 17"8 6’3 .. 59"3 51"3 13"5 17"5 16"5 5"7 emi-skilled Manual Wage Earners .. 57"3 55"9 2’4 18"9 18.6 1"6 Jnskilled Manual Wage Earners .. 55"6 52"4 5"8 23"6 24"8 --5"1 .~oefficient of Variation between groups "234 "225 "539 ¯ 596
(ank Correlation Coefficient: Rank in
i951 against rank in 1961 .... "830 "877
*Excluding Catholic Clergy.
Data Sources: C.P., I95I, Vol. II, pt. II, Tables 4, 9; C.P., 196I, Vol. V, Tables 2, 7.
The Emigration Commission stressed the adverse social and economic consequence of Ireland’s poor marriage record,s In the light of recent attention on Ireland’s exceptionally high incidence of hospitalised mental illness it is of interest to record the first admissions rate for schizoprenia for the different marital statuses in 1964 (rate per lO%OOO corres-ponding population, standardised for the age
distribution of the population) :7
Single Married Widowed
Males .. 148 29 73
Females .. i22 35 80
sCL especially Chapter 4.
TBased on first admissions data for I964. 27’9 per cent of all male first admissions and 23"7 per cent. of all females first admissions were in the schizophrenic diagnostic group. For a discussion of the evolution and significance of Ireland’s position in regard to hospitalised mental illness, of. Dermot Walsh, "Hospitalised Psychiatric Morbidity in the Republic of Ireland", British ffournal of Psychiatry, Vol. II4, No. 506, January 1968, pp. 11-14.
The high rate of hospitalisation among the spouse-less, either single or widowed, is striking and is also found in some other important diagnostic groups. This pattern is quite general and not peculiar to Ireland. It is interpreted in two, not mutually exclusive, ways: "First... the marriage state protects one from a psychiatric disturbance and second . . . the incipient character of psychoses is
... likely to prevent one from entering the marriage state ....,,s The forces that contribute to the high rate of celibacy in Ireland also contribute to the high overall incidence of mental illness, a con-sequence of Irish marriage patterns that was not
apparent when the Emigration Commission
reported.
In summary, it is clear that although Ireland’s marriage levels have risen considerably since 1946, they are still perhaps the lowest in the world. It is likely therefore that they will continue to rise until they are more normal. There seems to be little con-troversy among commentators about the desirability
of reducing the level of celibacy.
all. Warren Dunham, "Epidemiology of Psychiatric Disorder as a Contribution to Medical Ecology", International ffournal
of Psychiatry, Vol. 5, No. 2, February 1968, pp. 124-146.
PART H : FERTILITY OF IRISH MARRIAGES
A: Level and Trend
Ireland’s high marriage fertility is well known and has been most completely documented by the Emi-gration Commxssion.9 A convenient measure of marriage fertility is the number of legitimate live births per i,ooo married women in each age group
tOp. dt., Chapter 5.
as can be readily compiled. In an international com-parison of Ireland’s fertility it is of interest to include some of the underdeveloped countries of the world. The fertility of the Hutterite sect in North America is also included because their fertility is trequently
[image:12.608.50.516.164.491.2]accepted by demographers as a benchmark for the highest rate ever recorded among any population. It is remarkable to record, on the basis of the evidence in Table 4, that not only is Ireland’s marriage fertility higher than that of Other European countries
TABLE 4: LEGITIMATE ANNUAL LIVE BIRTH RATES BY AGE OF MOTHER (PER 1,ooo MARRIED WOMEN IN AGE GROUP)
Country and Year
Age Group
lO-19 20-24 25-29 3o-34 35-39
552"2 356.2 246’7 14o.1 66"8
553"4 345’3 207"2 122"9 65"4 399"0 279"4 198"6 115"6
248"0 24i’8 I38"8 63’5 29"458"3 541.1 374"5 255"7 I61"4
623"9 444"5 333"9 251"6 169.i89"9 464"4 294"2 I44"6 69"7
569"2 305"4 19o"9 98"5 30"5 446"7 424"1 353"8 284.8 213"443"2 473 "4 295"5 213’o 115’6 53"4
5o7"7 323"7 201.3 122.6 66.7
450" 1 341"5 225"6 125.1 6o.7
54I’4 283"4 2II’I II7’O 57"3
305"2 212"9 112"9 52"I 22"6
612.6 478’0 392"3 298’6 202"4
3o2"9 338’1 235’2 9I’4 26"9
517"8 321"1 264.o i72.i 92"6 437"5 311"4 215’9 137"1
465-8 400"5 3o1"2 177"o I16.o74"6 234"4 285"6 217"5 175’6
498"6
122"3 336"9 196"6 115.o ,, 65’I 413"8 35o’6 245"2 159"8 111"6 468"3 428"9 264"8 156"4 16o’8 498"4 325"8 234"8 132"9 64"8 377"3 384’o 284"0
589"2
177"9 95"1 337"o 23 i’3 136"8 66.o 5o9’6 270’0 181"5 99"9 44"o 479"0 354"4 222"3 123"3 61.7 472"5 463"4 37I"o 254"0 193"7 323" 288. 282" 212"
550’ 502¯ 447" 406"
Australia (1961) Austria (1961) ....
Belgium (1961) .. Bulgaria (1956) .. Canada (196o) .... Chile (196o) .... Czechoslovakia (1961) Denmark (1963) .. E1 Salvador (1962) .. England and Wales (I 964)
Finland (1963) .. France (1963) .. Germany (BRD) (i96;i Hungary (1963) .. IRELAND (196I) .. Japan (196o) .... Netherlands (1963) ..
Norway (196o) .. Panama (196o) .. Philippines (196o) .. Poland (196o) .... Portugal (I96o) .. Puerto Rico (196o) .. Scotland (196o) .. Spain (196o) .... Switzerland (196o) .. Sweden (1963) .. United States (196o) .. Venezuela (1961) ..
India-Bengali Village Hindus 1945-1946 .. Hutterites--Marriages
of 1921-193o ..
40-44 20"5 24"3 19"2 Io’4 32"1 74"5 9"8 11"5 85"7 13"9 27"5 20"2 19"2 6"5 77"I 6"I 32’6 27’7 39"o 59"9 25"4 5I’I 17"3 35"8 21"8 12"0 71"9 100" 222" 31"8
1
9"7 45-49 1.6 1.3 I’2 I"9 ¯ 2"8 17’5 0.4 0"8 25"8 0-9 3.i 1.6 1.1 0.3 5"8 0.5 2"9 2"7 8.8 I4"9 3"0 5"0 I’I 4"3 I"7 0"9 15"2 33" 61"Sources:UnitedNations, Demograph~Yearbook, I965, Table 25 and Roland Pressat, L’AnalyseDemographique,(Paris, 1961)
p. 164.
similar in religion and level of economic develop-ment (Spain and Austria, for example) but also that it is at least as high as that of the Latin American countries for which data are available. The com-parison with countries like E1 Salvador, Panama and
Chile is especially striking: these are areas with much lower income per person than Ireland and they
exhibit some of the highest population growth rates found anywhere in the world. It is especially remarkable that Ireland’s marriage fertility in the younger age groups should be high relative to those of the Latin American countries mentioned: in these age groups the average duration of marriage is probably very similar in all the countries compared
and Ireland’s late average age at marriage cannot be responsible for the high Irish figures.
of the married women in the later age groups in
Table 4 have been married for shorter periods of time than married women in the same age groups in other countries: this would tend to raise the figures recorded for Ireland in these age groups without necessarily implying a higher level of fertility. How-ever, for those countries that may be seen to have a late average age at marriage in Table x, marriage duration in the older age groups should be close to the Irish level and the comparison of marriage fertilities may be made from the data of Table 4 without serious danger of error. Comparison with other countries must be made with the reservation that Ireland’s late average age at marriage is a con-tributing factor in the high figures recorded in the later age groups.
Data on family size by mother’s age at marriage and duration of marriage are available for a limited number of the richer countries of the world. For all of these countries, a comparison with Ireland on the basis of these data shows much the same pattern as exhibited in Table 4. Such data have therefore been used here only for the purposes of detailed com-parisons of Ireland’s marriage fertility at different points ’of time. Geary has drawn attention to the remarkable stability of Irish marriage fertility over the period 1841-19II.1° The Emigration Com-mission compared average family size by age and marriage duration in x9I i and 1946 and concluded that Ireland was undergoing a sharp reduction in fertility. Disapproval of this trend was expressed: "The downward trend in family size is unwelcome and every effort should be made to arrest it." (Paragraph 21 x.) No specific recommendations were actually made to reverse the apparent down-ward trend, and some dissenting opinions to the majority view of this matter were expressed in the Reservations, but the tone of the majority report is strongly pro-natalist, expressing the belief that high marriage fertility is part of the Irish value system.
The reduction in fertility that occurred between 191I and 1946 has not been protracted beyond I946, as became clear on the basis of the 1961 Census returns. Table 5 brings the comparison of marriage fertility presented by the Commission up to date. No clear trend emerges from a comparison of the 1946 and I961 data: fertility has risen slightly for the shorter durations and fallen somewhat more sharply for the longer durations. It might have been expected that aggregate fertility would have declined simply because of the declining importance in the total population of the high fertility agricultural social groups. If fertility is compared by social group between i946 and I96I, its stability over the period
l°Cf. R. C. Geary, "The Future Population of Saorstat Eireann", ffournal of the Statistical and Social Enquiry Society
[image:13.606.322.551.51.355.2]of Ireland, 89th Session, (1935-36), p. 20.
TABLE 5: AVERAGE FAMILY SIZE FOR SELECTED MARRIAGE DURATIONS, IRELAND, 1911, 1946 AND
1961. Marriage Duration (Years) 0-4 5-9 10-14 I5-19 20-24 25-29 30-34 ,° ..
A: Average Number of Live Births per IOO Married Women Aged 15-44 at Marriage Surviving in Ireland to:
1946 "[" (26 Counties)
lO3 I 255 354 416 449 478 494 191I (3z Counties) 99 283 421 525 596 648 677 1961 (z6 Counties) lO9 268 356 408 421 441 460 Marriage Duration (Years) o-4 5-9 lO-i4 15-19 2o-24 25-29 30-34
B: Average Number of Live Births per ioo Married Women, all Ages at Marriage, Standardised for Age at Marriage: Survivors in Ireland to:
., °. 1946 lO3 25° 343 41o 443 475 506 1961 1o7 263 350 403 416 438 457
Sources: A: Commission on Emigration, Reports, Table 70;
C.P., 1961, Vol. VIII, Table 8.
B: S.A., 1964, Table 3o. Method of Direct Standard-isation used in S.A. to calculated 1946 family sizes on basis of 1961 age distribution of marriages.
is even clearer than appears from the data of Table 5.11
Data on average family size may be used to cal-culate summary measures of the prevalence of large families in Ireland. Turning once again to the Emigration Commission, paragraph 212 presents such a measure:
"The number of families in the community in i946 with seven or more children under the age of 16 years amounted to only i3,ooo or 5 per cent. of all families with children under 16 years. The number of children in these families, however, represented 13 per cent. of all children under
16 years."
This finding is of interest in itself, but it mis-represents the probability of large families resulting from Irish marriages. Clearly, families of marriages of less than 7 or 8 years’ duration could not normally consist of as many as 7 live births. The relevant denominator is not all families but rather families of completed fertility. To illustrate the implications of Ireland’s marriage fertility for family size, it may be
seen that slightly more than one-third of all women aged 20-24 at marriage, who had been married for 25-29 years ill 1961, had at least seven live births and that over half the children born to such marriages belonged to families of seven or more live births. (Data on the number of surviving children aged under 16 are not available.) Table 6 presents some findings on family size for selected durations and ages at marriage. The effect of postponing marriage on the probability of a large family ensuing from the marriage is clear from the table.
TABLE 6 : PERCENTAGE OF FAMILIES HAVING SEVEN OR MORE LIVE BIRTHS AND PERCENTAGE OF CHILDREN BORN TO SUCH FAMILIES. MARRIAGES OF COMPLETED FERTILITY FOR SELECTED MOTHERS’ AGE AT MARRIAGE, IRELAND 1961
Marriages Duration
of in 1961
1937-41 ¯ ¯ 20-24 1932-36 ¯ ¯ 25-29 1927-31 . , 30-34
Percentage of Families with 7 or more live
births
Percentage of all Children in Families of 7 or more live
births Mother’s Age at Marriage
20-24 25-29 2o-24 25-29 31"4 17"o 52"6 33"8 34"3 18"1 56"7 35"4 35’9 20"8 I 58"7
[ 39"9
Data Source: C.P., 1961, Vol. VIII, Table 8.
This analysis relies heavily on the concept of "average family size", which is the term used in the Census to refer to the live births (and not the sur-viving family) of women still married and living in
Ireland at the Census date. Thus from any cohort of married women those who died, emigrated or were widowed are excluded. Examining, for example, a cohort of ioo female births in 1917-1921, the following is the approximate history of these women by 1961 :
I4 have died;
35 are living outside Ireland; lO are single, living in Ireland;
3 are widowed, living in Ireland; 38 married and living in Ireland.
Thus, the Census data on average family size would refer to fewer than 4° from any initial birth cohort of
IOO Irish females. The effects of mortality and widowhood operate with roughly equal force in Ireland and other European countries, but the effects of emigration and celibacy operate with unique force in Ireland. The fact that Irish marriage fertility is higher than would be expected on the basis of income or religion alone may be attributable to the selection that works in separating the women who marry in Ireland from the original birth cohort.
The selective effect of emigration and celibacy upon marriage fertility is an area that should repay direct investigation.
In view of the importance of marriage fertility to the demographic behaviour of a country, and Ireland’s unusual position in this regard, it is worth developing a further measure of fertility that has been widely accepted since the Second World War.
This measure takes explicitly into account the number of live births that have already resulted from a nlarriage, and measures fertility in terms of the probability that a mother who has had i live
births will give birth to her i + I baby in a specified period of time. This probabilitd d’agrandisement may be calculated for any defined population of women, and either for one cohort as it moves through the reproductive age groups or for a cross-section of a country’s women at a point of time, consisting of various cohorts of women at different stages in their reproductive lives. It would be very desirable to calculate the latter measure for Ireland since it would provide a sensitive index of the fluctuations in marriage fertility over time, which are not easily assessed otherwise. Unfortunately, although births are now recorded by birth order, the calculation of these probabilities at a point of time is complicated by the need to estimate the number of women in the population who have already had i live births. Various schemes have been developed for weighting the number of women who have given birth to their ith baby in the recent past in order to arrive at this figure,12 but in Ireland any such weighting procedure faces the problem of allowing for the emigration of married women. No ready solution to this difficulty is apparent. For this reason the probabilitds
d’agrand-isement are presented here only on a cohort basis,
which means that data relating to marriages that occurred some time ago have been used. The findings are given in Table 7. It may be seen that the probability of having at least one or two children has risen slightly over the period, while the proba-bility of higher order births has fallen. On the whole, this table confirms the impression that marriage fertility has not shown any strong trend in either direction since the I93O’S, although there is a definite tendency for the number of large families from a cohort of marriages to fall.
B : Differential Fertility in Ireland
The fertility differentials between religious groups in Ireland are pronounced. Catholics have higher marriage fertility than any of the other religious groups. This is true when the religions are compared by social group as well as in the aggregate.13 The
12Cf. Louis Henry, "l~tude Statistique de l’Espacement des Naissanees", Population, Volume 6, No. 3 (1951).
TABLE 7: "PROBABILIT~S D’AGRANDISEMENT": WOMEN MARRYING AT AGE 20-24 IN SELECTED YEARS AND SURVIVING IN IRELAND TO I961
Probabilities are the conditional probabilities of a llve birth of order i, given that a live birth of order i - x has occurred.
Year of Marriage i---~X 2 3 4 5 6 7
I922-1926 .... "9447 ’9495 ¯ 9o98 .8875 "8553 ¯ 814° "7772
1927-1931 .... "9470 ¯ 909° "8748 "8327 "7992 "7585
z932-I936 .... "9560 "9477"9479 ¯ 9oo4 .8662 "8182 ’7775 "7585
1937~1941 .... "96o8 "9487 "9oo5 "853z ’797I "765o "7346
Data Source : C.P., I96I, Vol. VIII, Table 8.
religious differential need not concern us here, however, since over 94 per cent. of the country is
Catholic and this percentage is probably rising. The fertility of Catholic marriages obviously dominates the trend of fertility in Ireland, and for this reason the following discussion is limited to the behaviour of the Catholic population.
The picture that emerges from an examination of the 1961 Census returns on marriage fertility by religion and social group is substantially the same as that presented by the Emigration Commission on the basis of the 1946 returns.14 Catholic marriages are most fertile among farmers, farm labourers and the "lower’? socio-economic groups in the non-farm population. The differentials are considerable: for women aged 2o-24 at marriage, for example, who have been married for at least 2o years, the average ¯ family size of the Unskilled Manual Workers group
was at least one-and-a-half times that of the Higher Professional group.
The effect of this pattern of fertility differentials on social mobility and the inequality of the size distribution of income must be substantial. The cost of family formation is greatest among those who can least afford to pay. These arguments are obvious, and a recent survey of empirical findings on the relation between family size and social mobility supports the a priori reasoning that says that large families are a serious barrier to mobility and educational attainment, especially among the poorest segments of the population.15 Although no evidence on the question is yet available for Ireland there is little reason to suspect that the situation is otherwise here.
The view has gained ground among demographers in recent years that the pattern of differential fertility exhibited in the Irish Census returns--highest fertility in rural classes and among the poorer urban social groups--is a transitional phenomenon. Before the dramatic reduction in marriage fertility that occurred in Europe after the beginning of the
tqn fact the Commission did not study fertility by social group for Catholics alone, but rather for all religions together.
1~Cf. Colin Clark, Population Grogvth and Land Use, (London,
x967), Chapter IV.
nineteenth century, the pattern of differentials seems to have been reversed: in some rich countries today, where low fertility has prevailed for a long period of time in all segments of the population, tile pattern of differential fertility seems to be reversing itself again, witll the largest families occurring among the wealthiest and best educated segments of the popula-tion. Thus the Irish differential pattern may be due to the tendency of the "higher" socio-economic groups to be the first successfully to practice family limitation, while when the knowledge and motivation that facilitate family planning become more wide-spread the poorer segments of the population may achieve smaller than average families in the effort to raise the "quality" (and in particular the educational attainment) of their children. In fact, when actual and desired family size are equal, economists suggest the operation of positive income elasticities of demand for children which manifest themselves in both increased quantity and increased quality.Is
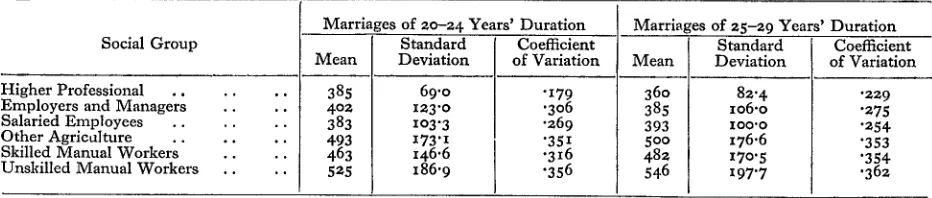
It might be argued that the lower average family size of the "higher" socio-economic groups in Ireland is not due to any greater prevalence of conscious family limitation among these groups but rather to physiological or other reasons. In order to clarify this issue the Census data may be examined to show the effect of age at marriage on average family size within each social group. It is a widely
TABLE 8" MEAN, STANDARD DEVIATION AND COEFFICIENT OF VARIATION: AVERAGE FAMILY SIZE
(PER lOO FAMILIES) BY AGE AT MARRIAGE (15-34 YEARS). CATHOLIC MARRIAGES OF COMPLETED FERTILITY, SELECTED SOCIAL GROUPS, IRELAND x961
Marriages of 2o-24 Years’ Duration Marriages of z5-29 Years’ Duration
Social Group Standard Coefficient Standard Coefficient
Mean Deviation of Variation Mean Deviation of Variation Higher Professional ....
Employers and Managers .... 402385 123"o69"0 "I79"3o6 360 1o6.o8z’4 "229
Salaried Employees ... 383 zo3"3 ¯ 269 385 I00"0 "275
Other Agriculture .... 393 "254
Skilled Manual Workers" .. .. 493463 I73"1146"6 "35I"316 500482 176.6 "353 Unskilled Manual Workers .... 525 I86"9 "356 546 I7o"5197"7 ’354’362
Mean = arithmetic mean of average family size in each of the following age groups: i5-19, 2o-24, 25-29, 3o-34¯ Standard Deviation = standard deviation of average family size about the mean.
Data Source : C.P., 1961, Vol. VIII, Table 15a.
presented in Table 8. It is clear that not only do the "higher" socio-economic groups achieve lower average family size, but also that age at marriage makes less difference to average family size in these groups than in the "lower" groups: the coefficients of variation are consistently lower in the low fertility social groups. Thus it seems that the differences in average family size between social groups must be accepted as evidence of difference in ability to achieve a desired family size. This finding also suggests the relatively greater importance of celibacy or postponed marriage as a method of family limitation among the "lower" socio-economic groups in Ireland.
The findings of this Part may be summarised. Irish marriage fertility was seen to be extremely high by international standards, exceeding even the fertility of many underdeveloped countries. No clear
evidence of a trend in Irish fertility is available. Within the country, large differentials in fertility exist between the social groups, the agricultural and "lower" non-agricultural groups having the highest fertility. Low fertility is also associated with relatively small variation in family size by wife’s age at marriage, a fact that suggests the greater preval-ence of successful family planning among those in the "higher" socio-economic groups.
In the future, if Ireland follows the pattern established by the richer European countries, the overall level of fertility will decline steeply and at the same time the size of the differentials between social groups will diminish. EventuaUy, the existing pattern of differential fertility may be reversed. At present, it is impossible to predict how soon or how quickly any of these changes will occur.
PART HI : THE RELATION BETWEEN NUPTIALITY AND
MARRIAGE FERTILITY
Ireland’s marriage patterns are unique in the world today, but viewed historically they are merely an extreme version of a pattern that had a very important impact on the demographic history of Western Europe from the eighteenth to the twentieth century. This so- called "European marriage pattern"
differed from that observed anywhere else in the world and consisted in a late average age at marriage and a large percentage of people who never married in each generation. As Hajnal observes: "In the European pattern unmarried life for an adult woman was accepted as a normal (if perhaps exceptional) alternative to marriage.’’17 An important effect of this pattern was a reduction in the birth rate,
l?j. Hajnal, "European Marriage Patterns in Perspective", in
Population in History, edited by D. V. Glass and D. E. C.
Eversley, (London, 1965), p. Io3.
achieved before the spread of contraceptive practices. There is some evidence to suggest that nuptiality tended to be lowest in those areas of nineteenth-century Europe where marriage fertility was highest, Brittany, Belgium and, of course, Ireland for example,is Yet it is also fairly clear that nuptiality rose before the fall of fertility in these areas, a process that we have seen at work in Ireland today. However, the higher levels of nuptiality were eventually combined with greatly reduced fertility rates.
There is a good deal of evidence to suggest that the Irish pattern of low nuptiality has evolved as a method of offsetting the country’s high marriage
lsCf. Etienne van de Walle, "Marriage and Marital Fertility",
Daedalus, Spring, I968, pp. 486-5Ol.
[image:16.608.57.523.78.177.2]fertility. This evidence is from two sources, the first historical, the second derived from the present-day
differentials in fertility and nuptiality within Ireland. We shallexamine these two sources in turn, along
with some international evidence on the relationship between fertility and nuptiality.
It is now clear that during the years 177o-182o Ireland’s population grew at a rate far above the European average for the period. The following are the growth rates for Ireland and for the average of 16 European countries at the beginning of the nineteenth century (annual average rates per cent.) :19
Period
Ireland European
Mean
I791-I82I
¯ . 1’20
18o1-182o
0.65
I82I--I83I
1"34
0"94
It seems that a number of factors contributed to the unusually rapid expansion of Ireland’s popula-tion in this period. The improved diet that resulted from the spread of the potato lowered mortality; the landless, capital-less farmers’ and cotters’ sons were encouraged to marry early because of the need for labour to grow potatoes in rotation with corn and thus meet the high rents extracted by the landlords ; there appears to have been no reduction in marriage fertility as nuptiality rose. This pre-carious economic system was undermined by the agricultural depression that followed Waterloo and the long upward trend in the ratio of dry cattle prices to corn and dairy produce prices.2° The decline in the value of the productivity of farm labour increased the landless man’s difficulty in meeting agricultural rents and discouraged early
marriage. In addition to the economic forces, pressure against early marriage was probably spreading because of the growing influence and Control of a Catholic clergy trained in a Jansenist moral theology.21 From 182o onward, and most markedly after 183o, Irish nuptiality began to fall
19Sources : K. H. Connell, The Population of Ireland, x75o-r845, (Oxford, 195o), p. 25 and D. V. Glass and E. Grebenik,
editors, The Cambridge Economic History of Europe, Vol. VI, (Cambridge, i965), p. 62. Connell’s data on Irish population growth are revisions of the previously accepted, much higher, growth rates.
2°Evidenee of the fall in Irish nuptiality in the early nine-teenth century is provided in many sources. Connell, ol). cit., documents the slowing-down of population growth in the 183o’s and the earlier trend towards lower nuptiality. Additional evidence is cited by Raymond D. Crotty, Irish Agricultural
Production, (Cork, 1966), Chapter II. The role of the
agri-cultural depression following Waterloo in causing demo-graphic change in Ireland has been convincingly argued by
CroW.
¯ ’lFor some interesting research suggestions on this topic, cf. John T. Noonan, Jr., "Intellectual and Demographic History", D~dalus, Spring x968, pp. 463-485.
10
sharply. At the same time, due to the same economic forces, emigration rose to high levels. The new, lower pattern of nuptiality established itself first in the relatively prosperous areas of the East and Central Plains, where postponing marriage and thereby limiting family size offered the greatest prospects of achieving land ownership and improved economic conditions. Only after the second great agricultural depression of the century, in the I87O’S, was this lead followed by the poorer areas of the Western Seaboard, and high levels of permanent celibacy, together with late average age at marriage, became a national characteristic.22 In contiast with the popular version of the story, the historians attribute an insignificant role to the famines of the I84O’S in the evolution of the abnormal Irish marriage pattern.
This evolution of low levels of nuptiality suggests that marriages were postponed or permanently
avoided due to the difficuky encountered by the predominantly agrarian population in raising large families. During the nineteenth century most other European populations were undergoing rapid urban-isation, and with this urbamsation came an
accele-rated dechne in marriage fertility:the costs of large families were greater in the cities, the economic returns from children fewer and the city’s secula-rism facilitated the spread of contraceptive know-ledge. Ireland shared its reduction in natural increase with the countries of Europe at this time, but it was unique in its almost complete reliance on low nuptiality to achieve this reduction. Lack of urbanisation and the influence of a particular tradition of Catholicism may have been the most important reasons for this particular aspect of
Ireland’s demographic history,
Only since the I93O’S have Ireland’s marriage patterns began to alter appreciably. The rapid rise in marriage rates has been examined in Part I. It was emphasised in Part II that as naptiality rose there appears to have been little or no reduction in marriage fertility. In contrast with the sharp fall in marriage rates that occurred in the early nineteenth century, the present rise in nuptiality does not appear to be a response to changing economic circumstances. This apparent autonomy in the behaviour of Irish nuptiality has important conse-quences for the impact of higher levels of reproduc-tion on the economy in the future. These aspects of the problem will be taken up in Part IV.
The historical evidence on the origins of the present-day Irish marriage patterns may be supple-mented by a considerable amount of evidence drawn from the variation in marriage rates within ¯ ’2Cf. Stuart H. Cousens, "The Regional Variations in Population Changes in Ireland, i86i-i88i", Economic History
Ireland today, which suggests that high marriage fertility has acted as a deterrent to marriage in Ireland. A convenient starting point for the presenta-tion of this evidence is the paragraph in the Emigra-tion Commission in which this idea is dismissed :
" There is fairly widespread belief that our poor marriage background is partly attributable to the fact that, since the great majority of the people of Ireland are Catholics, marriage is to them an indissoluble contract and family limitation by contraception is against the moral law. It is said that the indissolubility of marriage and, in the absence of contraception, the fear of large families deter many from marriage altogether and others until a relatively advanced age. No convincing evidence has been put before us in
support of this view. As Table 49 has shown, the marriage rates in other Catholic countries are markedly higher than in ours. Moreover, the marriage rate in the Six Counties --where only about one-third of the population is Catholic--is also exceptionally low."
(Paragraph i66).
[image:18.606.58.526.310.479.2]In Part I some evidence has already been advanced showing that the old "European marriage pattern" has persisted up to the present in its most extreme form only in a few Catholic countries. It was also remarked that the Catholic population of the United States showed a low nuptiality for that country. But the most relevant information on the association between religion and marriage rates is found in Ireland. Table 9 displays the level of celibacy for
TABLE 9A: PERCENTAGES SINGLE, MALES AND FEMALES BY AGE AND RELIGION: REPUBLIC OF IRELAND AND NORTHERN IRELAND, 1961
Republic of Ireland
MALES :
Catholics .... Others ....
FEMALES :
Catholics .... Others ....
Northern Ireland
MALES :
Catholics .... Others ....
FEMALES :
Catholics .... Others ....
Age Group
15-19 20-24 25-29 30-34 35-39 40-44
99"8 92"4 67"2 49"5 39"1 33"8 99"8 93’7 66"8 44"5 34"3 30"9 98"9 78’3 45 "4 29"8 23"7 22"1
98"7 75"5 38"5 24’9 20"4 20"4
99"6 81.6 53"0 37"8 31"2 27"6
99"2 77"7 4o’8 24’ 1 I6"O I7"I
97"7 67"9 38’9 28"9 25"8 23"3 95"8 57’8 26"3 17"5 15"6 14"8
45-54
30’O
24"7 23"I 22"7
25"5 15’5 23"7 16"6
Data Source : Republic: C.P., 1961, Vol. VII, pt. I, Table 9. Northern Ireland: Northern Ireland, Census of Population
i961, General Report, (Belfast 1965), Tables 12, 13.
REPUBLIC OF IRELAND
TABLE 9B: MARRIAGES BY RELIGION, AGE, SEX; AVERAGE OF I96o-62 AND RATES PER I,OOO CORRESPONDING SINGLE AND WIDOWED POPULATION, I961
Males Females
Age
20 ..
20-24 .. 25-29 ¯ ¯ 30-34 ¯ ¯ 35-39 ¯ ¯ 40-44 .. 45-54 ¯ ¯ 15-54 ¯ ¯
Catholics Others Catholics Others
Number Rate Number Rate Number Rate Number Rate
9"66 92"75 112.o5
7o’9o
36"02 15"69 5"06 39"o2
8
135 191 lO8 65 31 29
46 260
145 67 33 17 16 255
3,594 4,729 2,718
1,555
871 728
2’22
51"o5 lO2"58 76.67 50"63 31"27 14"o7
I’5I
33"59 76"67 62.1o 44"79 21-69 I0"59
I,I73 5,871 4,I5O 1,883 882 363 256
lO"92 lO1"38 13o"36 83"56 43"13 17"62 5’39
38"32 567 29"58 14,578 584
14,45o 47’29
Data Sources: Report on Vital Statistics, 196o-62; C.P., 1961; Vol. VII, pt. 1, Table 9.
[image:18.606.61.525.564.702.2]males and females, by religion, in the Republic and in Northern Ireland in i96i. The higher level of celibacy among Catholics of both sexes is striking. The differences in marriage levels between the religions may be partly or fully due to their different social class composition. In this section, no attempt is made to separate the net influence of religion from that of social class: data by religion, social class and marital status are published for neither the Republic nor Northern Ireland. It is surprising to find lower percentages of the non-Catholic population of the Republic single in all but one male age group and in all female age groups, since as may be seen from the table, the age-specific marriage rates of non-Catholics are all lower than the Catholic rates. These two facts can only be reconciled by the assumption that a much larger percentage of non-Catholic emigrants is single, so that the effects of the low marriage rate are more than offset. The low level of nuptiality found among non-Catholics in the Republic would be expected on the basis of the very sparse distribution of their population. In Northern Ireland, the largest single religious group is the Catholic and to the extent that intermarriage between some Protestant sects may run slightly contrary to convention, the small numbers in each individual sect may act as a force reducing the level of nuptiality among non-Catholics, which nonetheless remains very much higher than that among Catholics. The Fertility
Reports of the Northern Ireland Census show the
same pattern of fertility differentials by religion within each social group that is found in the Republic.
The lower level of nuptiality in the high fertility Catholic population of the Republic and Northern Ireland is suggestive of an inverse relationship between marriage and fertility rates. A search of the literature reveals that Geary in 1936 was the first systematically to test this hypothesis. Using a sample of 28 countries and the 26 counties of the Republic, he reported a significant negative correla-tion between the marriage rate and an approximate measure of the fertility rate.23 Leser has confirmed the inverse relationship between these variables by county in Ireland in 1961.24 In looking at the relationship between fertility and nuptiality on an international level, it is appropriate to restrict the sample to European countries: as Hajnal points out, high levels of celibacy are essentially a European phenomenon, even a Western European one. In most of the underdeveloped Countries today, very high fertility is combined with very low celibacy, so an inverse relationship between these variables does not prevail throughout the world. The data of Table IO presents a summary measure of fertility and
2~R. C. Geary, ol). cit., pp. 21-23. 21C. E. V. Leser, ol). cit., p. I92. 12
celibacy for a fairly complete sample of European countries in a recent Census year. The correlation coefficient between the two variables in the table is o.851, which is significantly different from zero at the 99 per cent. confidence level.
TABLE IO: INTERNATIONAL DATA ON FERTILITY AND CELIBACY
Country and Year
Austria (196I) .... Belgium (1961) .... Czechoslovakia (1961) .. Denmark (196o) England and Wales (196~) France (1962) .... Finland (I96O) .... Germany West (196I) .. Greece (I96I) .... Hungary (I96O) .. Ireland (Rep.) (1961) Northern Ireland (i96ii" Norway (196o) .... Netherlands (196o) .. Poland (196o) .... Portugal (196o) .... Scotland (I96I) .... Spain (196o) .... Sweden (196o) .... Switzerland (196o) ..
o. °. Percentage of Women Aged 15-49 Single 33"8 26"8 24"4 29"6 27"5 31"7 35"3 30"9 33"2 23"2 47"9 4o’7 3o’4 33’7 26"8 4o’6 31"7 40"3 32"2 38"~ Legitimate Live Births Per 1,ooo Married Women Aged 15-49 116"4 lO6"3 92"2 97"5 Io1"5 117"4 122"3 11o.8 I00"0 78"5 195"6 163"5 lO9.O 138.1 123"7 148"9 120"4 142’5 80.2 117.3
Data Source : United Nations, Demographic Yearbook 1965
Tables 7, 13.
Rather than rest the relationship exclusively on international or intercounty comparisons, it is interesting to compare the behaviour of these variables between social classes in Ireland. Table I i presents some information on the level of fertility and celibacy by social group in 1961. All the correlation coefficients recorded in Table ii are statistically significant. The relationship between the variables is clearly stronger when celibacy is measured by the percentage of males aged 45-54 single, which is the more meaningful measure of celibacy. There is some tendency for the "higher" social groups to have later average ages at marriage, due to the higher educational requirements of employment in these groups, and this reduces the correlation between celibacy and fertility when the former is measured as the percentage single in the population aged 15-54.
[image:19.602.311.543.136.369.2]TABLE I I: RELATIONSHIP BETWEEN FERTILITY AND CELIBACY BY SOCIAL GROUP, IRELAND, 1961
Social Group Celibacy Fertility
(1) (2) (1) (2) (3)
Farmers, Farmers’
Relatives ..
Dther Agricultural .. 67"466’9 39"943"I 604599 377386 581 573 Higher Professional* 43"7 lO"4 343 z64 382 Lower Professional . . 5I’8 13"3 472
Employers and Mana- 35"3 8"7 376 289290 435386 gers
Salaried Employees .. 38"8 10"5 416
Intermediate Non- 279 423
Manual
Other Non-~cIanual 59"4
18"5 487 298 45z Workers
Skilled Manual ~¢Vorkers 51"351"3 17"116"5 556558 346 513 Semi-Skilled Manual 55"9 18"6 615 345 524548 Unskilled Manual .. 52"4 24"9 641 377428 608
*Excluding Catholic clergy.
Celibacy (1) =percentage of males aged 15-54 single. Celibacy (2) =percentage of males aged 45-54 single. Fertility (i) ~Average number of live births per ioo
marriages of 3o-34 years’ duration, wife aged 2o-24 at marriage.
Fertility (2) =Average number of live births per ioo
marriages of all durations, wives of all
ages at marriage.
Fertility (3) =Average number of live births per lOO marriages of 2o-24 years’ duration, wife aged 2o-24 at marriage.
Correlation coefficients between fertility and celibacy in the 11 social groups:
Celibacy (i) and Fertility (i) Celibacy (i) and Fertility (2) Celibacy (I) and Fertility (3) Celibacy (2) and Fertility (1) Celibacy (2) and Fertility (2) Celibacy (2) and Fertility (3)
Data Source : Celibacy: C.P.,
Fertility: C.P., *=significant at 95~o level.
= ’749"* = "624" =’74o** =’759"* =’716" = "782"*
1961, Vol. V, Table 7. I96I Vol. VIII, Table I4a. **= sig. at 99Yo level.
the professional and managerial (which includes shopkeepers, if they are employers) social groups have fairly small families on the average and a relatively low percentage of their males remains permanently single. Thus the burdens of large family size and permanent celibacy appear to fall most heavily on those who are least adequately equipped to deal with the resultant economic and psychological stresses.
The highly significant correlations between celi-bacy (or nuptiality) and fertility cannot readily be dismissed as a reflection of a common influence at work on both nuptiality and fertility. Accepting the correlation as meaningful, it is reasonable to follow Geary’s reasoning:
"... it is easier to understand how the high fertility rate acts as a deterrent to marriage than the reason why the low nlarriage rate is a cause of the high fertility rate. At the same time, amongst certain classes or at certain periods it may well be that there has been a reluctance to assume the married state with its concomitant of parent-hood."~5
The statistical results even suggest that this reluct-ance grows as the burden to be expected from parenthood increases.
The absence of an inverse relationship between fertility and nuptiality outside Europe today, and everywhere in the world until at earliest the i7th century, suggests that there is something in the post-medieval economic environment that leads to the operation of the Malthusian "preventative check" of "moral restraint". This quality may well be the length of the planning horizon used in making important decisions: only when marriage plans are affected by the size of the prospective family can a rationale for the inverse relationship between fertility and marriage levels be found.
It is somewhat unsatisfactory to try to establish the sort of relationships between fertility and nuptiality discussed here solely on the basis of aggregate data. No examination of the motivation that is involved in the numerous individual decisions that give rise to these data has been provided. A causal nexus could be disputed. We need more in-formation on the motives that influence family formation in Ireland. It goes without saying that more is involved in the marriage decision than economic and demographic considerations. How-ever, the sort of findings and arguments presented here are strong prima facie evidence of the use of low nuptiality in Ireland as a method of averting the full consequences of the prevailing high level of marriage fertility. In other words, Ireland has been a unique example of the protracted operation of the Mal-thusian "preventative check" on population growth, consisting of the "moral restraint" that keeps people from marrying for fear of being unable to support the families that ensue from their marriages, especially if there is no effective check on the size of these families. The desirability of this method of population control must be judged in part by con-sidering the impact that low nuptiality has had on
Irish society over the last century-and-a-half.
~50p. cit., p. 23.
PART IV: FACTORS AFFECTING THE RATE OF NATURAL INCREASE
The rate of natural increase, or the growth rate of a country’s population in the absence of net migra-tion, is determined by the combined influences of marriage fertility, nuptiality and mortality. For the century between 183o and 193o Ireland attained a very low rate of natural increase because the low level of nuptiality offset the high marriage fertility. Since the x93o’s however, the situation has changed considerably: a rising level of nuptiality, combined with a fairly stable level of marriage fertility, has caused the rate of natural increase to climb sub-stantially.
The most widely used measure of an area’s natural increase is the Net Reproduction Rate (NRR). This rate may be calculated by answering the question: "How many girls would eventually be born to each female born now if the present levels of mortality, nuptiality and marriage fertility prevailed in-definitely into the future ?" The NRR is calculated on the basis of a stable population in which marriage and birth rates, as well as the age structure, have reached constant levels. The NRR thus projects the nuptiality and fertility existing in various age groups in the population today over the life of future genera-tions. C6nsequently, the NRR is not generally useful as a basis for forecasting actual population growth, but it is useful as a way of examining the implica-tions for natural increase of any observed pattern of nuptiality and fertility. If the rate is i.o, then a population would just replace itself by its present level of reproduction. If the rate is 1.58, for example, population would grow by 58 per cent. in a genera-tion or by 1.7 per cent. annually (taking a generagenera-tion of 28 years). This annual growth is referred to as the "intrinsic growth rate" associated with the corres-ponding NRR. Whether or not the population actually grows at this rate depends, of course, on the level of net migration over the generation as well as on the course of marriage, fertility and death rates. It is possible to trace Ireland’s NRR back to the x 93o’s with the help of estimates that were published by the United Nations in the 1965 Demographic
Yearbook. The earlier data are subject to a wide
margin of error, and these estimates differ slightly from some others that have appeared elsewhere, but the overall trend is clear:
I935-x937 I945-1947 I95o-I95z x’4o4 I x’467
I955 196i
qRR, Ireland x’x86 I"454 1.678
From a situation in the I93O’S when Ireland’s popula-tion was reproducing itself and providing for a growth of only 20 per cent per generation, the rate 14
of reproduction has increased, in two marked jumps, so that in i96i the population was reproducing itself and providing for a growth of 68 per cent per generation. Out of the 25 European countries for which I96I data are available only Iceland and Albania had NRRs higher than Ireland’s.
Ireland’s NRR is not likely to remain at its present level. As has been seen, the country has an abnormally low level of nuptiality that may be expected to continue its upward trend. At the same time there is no definite evidence of a fall in the level of fertility. These two forces imply that the NRR will continue to climb.
The inverse relationship between fertility and nuptiality documented in the previous Part may well hold over time in Ireland, although the sub-stantial rise in the NRR since the x93o’s indicates that the relationship is not very close. There may well be a considerable lag between the rise in
marriage rates and the fall in fertility rates, during which the NRR will rise to levels far above the European norm.
It is worth trying to quantify the rise in the Irish NRR that could occur, while realising that this exercise in no way results in forecasts of the future course of the NRR. Such an exercise is no more than an attempt to explore the demographic implications of a stituation that has often been recommended for Ireland: the Emigration Commission, in particular, was emphatic about the desirability of reducing the level of celibacy while maintaining the level of marriage fertility.
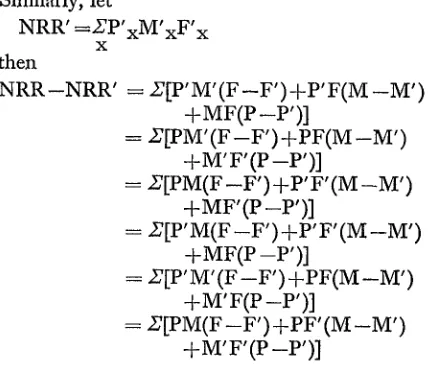
In order to explore the implications for Ireland’s NRR of more normal levels of nuptiality, the differ-ence between any two NRRs may be considered as
follows:~s
Let Px=probability of a female surviving to age x, Mx=probability of a female aged x being
married,
Fx=probability that a married female aged x will have a live female birth in the course of a year.
then
NRR~PxMxFx (if x equals five-year age
x groups, as is the case in the
present application, these summed products must be mukiplied bY five to obtain
NRR).
l°Throughout this Part, illegitimate fertility is assumed to be zero: this greatly simplifies the expos itionwithout materially altering the results. Dr. Geary pointed out the non-uniqueness of the decomposition of NRRs originally used, and suggested