Study of laser induced plasma using two focusing techniques
5
0
0
Full text
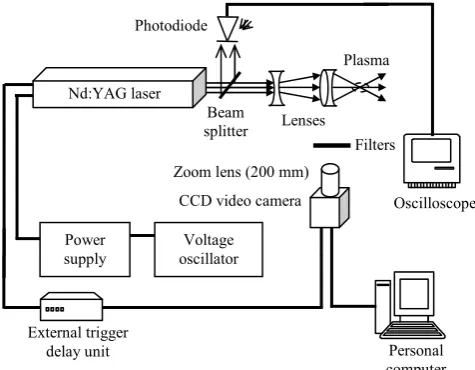
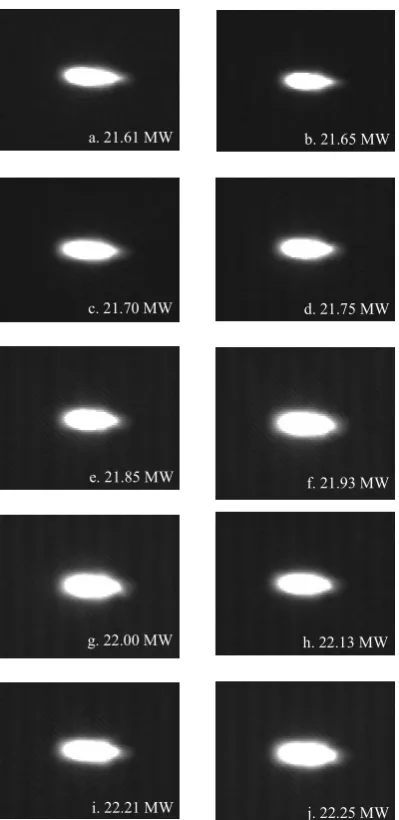
(2) International Journal of Integrated Engineering (Issue on Electrical and Electronic Engineering). 1. INTRODUCTION Study of laser induced plasma becomes an interesting field since it is important for both the basic understanding of laser-material interactions and many practical applications [1]. Plasma is an ionized state [2]. It is a special class of gases that include a large number of electrons and ionized atoms and molecules [3]. Therefore plasma can be defined as a hot (up to keV) electrons and ions. One of the major difficulties in understanding of the physical nature of plasma formation is the fact that plasma formation is a highspeed phenomenon [4]. As well as to capture the ultrafast plasma formation, a high-speed photography technique must be applied [5]. A high intensity light can create plasma. When a pulsed laser is focused into a medium and a certain pulse energy threshold is exceeded, a so-called breakdown is occurred [6], [7]. This phenomenon is characterized by the existence of bright luminous spark followed by an audible sound. The power density in this breakdown region is around 1010 – 1012 W/cm2 [8]. Hence, the electric field strength E0 of a focused laser beam of power density Pd is given by [9],. E 0 = 2.74 × 10 3 Pd. 1/ 2. (1). For a laser pulse with power density of Pd = 1010 – 1012 W/cm2, the corresponding electric field strength is 106 –10 7 V/cm. This high power density of laser pulse is important to generate an optical breakdown which responsible to initiate plasma. At the focal region, for a start at least one atom is ionized resulting in a seed electron, which is accelerated by an inverse bremstrahlung in the high electric field of the laser pulse [10]. After gaining sufficient energy additional atoms are ionized by collisions, thus multiplying the number of electrons. Hence, the density of free charge carriers increasing in avalanche after a few consecutive iterations and plasma is created. In this paper, a systematic study of the plasma formation in air produced by infrared, IR laser pulse was carried out. A single lens and combination lenses technique were employed to focus the laser beam. The results obtained could give a better understanding regarding the influence of plasma formation induced by laser. 2. EXPERIMENTAL SETUP A Neodymium-doped Yttrium Aluminum Garnet (Nd:YAG) laser series HY200 manufactured by Lumonics with 1.06 µm fundamental wavelength and 8 ns pulse duration was employed as a source of energy. An external trigger delay unit was utilized to synchronize the signal of Nd:YAG laser and the. recording media. The laser beam was focused using two techniques. The first technique utilized a single lens and the second techniques consume a combination of positive and negative lenses. The whole experimental set up is shown in Fig. 1. The plasma formation was visualized and recorded using a Pulnix TM-6EX Charged Coupled Display, CCD video camera. The CCD video camera was interfaced via frame grabber to the personal computer. Matrox Inspector version 2.1 software was utilized for image processing and analysis purposes.. Photodiode Plasma Nd:YAG laser Beam splitter. Lenses Filters. Zoom lens (200 mm) CCD video camera Power supply. External trigger delay unit. Oscilloscope. Voltage oscillator. Personal computer. Fig. 1 Experimental setup to generate plasma using infrared laser.. Prior to any measurement, magnification factor of plasma images were calibrated as discussed in other text [11]. The plasma formation were studied at various peak powers by changing the voltage oscillator of the Nd:YAG laser. The generation of optical breakdown was identified by the appearance of electrical spark at the focal point. 3. RESULTS The activities generated at the focal point was visualized and recorded in conjunction with a highspeed photographic technique. Fig. 2 shows series of plasmas images obtained from a single lens technique with correspond to the increasing laser peak power. The configuration of the plasma images were in the ellipsoid form. The plasmas images were captured in the dark room. Consequently, the images consist of a bright area corresponds to the appearance of ellipsoidal plasma with a dark background. The brightness of the plasma gives more than enough light to CCD video camera. As the intensity of the plasma is very high, a colored glass filter was employed to avoid over exposure. As a result very clear images were recorded. From the observation results, the sizes of plasmas were found expanded with the delivered laser peak power at the focal point from 21.61 MW to 21.93 MW..
(3) International Journal of Integrated Engineering (Issue on Electrical and Electronic Engineering). However as the peak power getting higher within 22.00 MW to 22.25 MW, the size of plasmas was unstably changed. In certain case, it reduces, expand and reduce again within that region.. a. 21.61 MW. b. 21.65 MW. c. 21.70 MW. d. 21.75 MW. e. 21.85 MW. g. 22.00 MW. i. 22.21 MW. 22.21 MW the size of the plasmas were unstably increasing. At highest laser peak power of 22.25 MW the size of plasmas were dropped slightly.. a. 21.61 MW. b. 21.65 MW. c. 21.70 MW. d. 21.75 MW. e. 21.85 MW. f. 21.93 MW. g. 22.00 MW. h. 22.13 MW. i. 22.21 MW. j. 22.25 MW. f. 21.93 MW. h. 22.13 MW. j. 22.25 MW. Fig. 2 Plasma formation produced using a single lens technique consisting of 28 mm focal length lens. Magnification factor is 5x big.. In average, the plasmas images comprised of two stages; the inner part and the external part. The inner part is represented with a highest degree of brightness illustrated as totally white. While the external part comprised of a blurred region. The existing of a blurred region causing difficulty in measurement processes. The precise measurement of plasma becomes skeptical, leading to a large of uncertainty. The blurring region was observed getting thicker upon to the peak power. The laser beam focused by using a combination lenses technique produced broadly-ellipsoid plasma, as shown in Fig. 3. The series of plasma images were arrange in the increasing order of laser peak power. As the laser peak power increases from 21.61 MW to. Fig. 3 Series of plasma images produced by combination lenses technique correspond to the increasing laser peak power. Magnification factor is 5x big.. In average the size of the plasmas were relatively small. Obviously the blurred region of the plasmas induced using combination lenses techniques were observed thinner than the single lens techniques. This leads to a high accuracy of plasma size measurement. This kind of images was referred as significant plasma. The existence plasmas were very obvious and concentrated. This high quality of plasma promises a good mechanism for laser plasma machining on material. Cutting edge for example will be smoother and explosion or implosion will take place in uniform distribution. The characteristics of the plasma were determined based on the recorded images obtained in Fig. 2 and Fig. 3. They were described in terms of plasma length as well as plasma width..
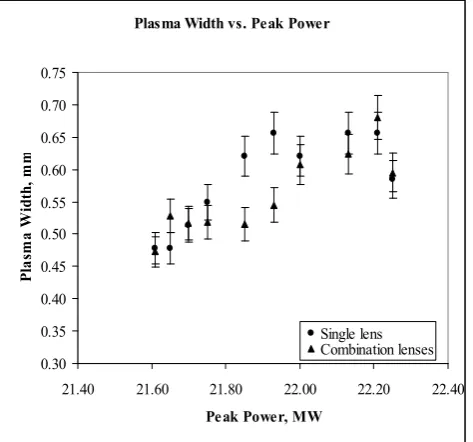
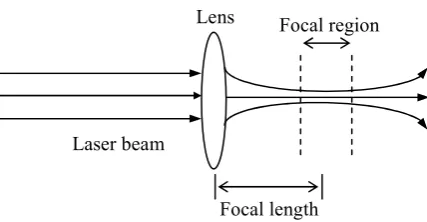
(4) International Journal of Integrated Engineering (Issue on Electrical and Electronic Engineering). The graph of plasma width against laser peak power is shown in Fig. 4. Two curves are drawn together on the same graph for comparison purposes. Generally the peak power which is in the range of 21.70 MW to 22.13 MW indicates that the plasma width obtained from a single lens technique is greater than the one by using a combination lenses technique. Both plasma width curves increased nonlinearly upon the given laser peak power. However the changes of plasma width due to single lens technique was found drastically increased compared to the plasma width from a combination lenses technique. At higher peak power, the plasma width curves produced from a single lens technique dropped and remained almost constant. In contrast, the plasma width curves produced from a combination lenses technique decreasing at highest peak power.. Plasma Length vs. Peak Power 1.80 1.60 Plasma Length, mm. 1.40 1.20 1.00 0.80 0.60 0.40 0.20. Single lens Combination lenses. 0.00. 21.50 21.60 21.70 21.80 21.90 22.00 22.10 22.20 22.30 Peak Power, MW. Fig. 5 Plasma length profile as a function of peak power. Plasma Width vs. Peak Power. 4. 0.75 0.70 Plasma Width, mm. 0.65 0.60 0.55 0.50 0.45 0.40 0.35. Single lens Combination lenses. 0.30 21.40. 21.60. 21.80. 22.00. 22.20. 22.40. Peak Power, MW. Fig. 4 Plasma width profile with respect to peak power of laser beam.. Fig. 5 shows the graph of plasma length as a function of peak power. The length of plasma obtained from combination lenses technique is obviously shorter than the single lens technique. Initially the curve for combination lenses technique is increasing nonlinearly. After achieving a maximum point of 22.21 MW, the plasma length dropped slightly and remains constant throughout the end. The results obtained from a single lens technique indicates that the plasma length is increasing to the given peak power of 22.13 MW. However, as the laser peak power gets higher, apparently the plasma length drop slightly and stay almost constant throughout the end of experiment. In general, the plasma length produced from a single lens technique was found much greater than the combination lenses technique.. DISCUSSION. The power delivered at the focal point is as well determined by the oscillator voltage, as it controls the output of the laser beam. The laser output was found unstable at higher voltage, hence influence the plasma formation. Consequently, the plasma formation in air is dependent on the laser output. If the laser output is fluctuated, the optical breakdown as well as the plasma formation is also affected. The size of the plasma depends on the focusing technique of the laser beam. As shown in Fig. 6, when the laser is focused using a single lens technique, a long focal length was introduced. As a result, elongated plasma was produced. The experimental spot area or the width of plasma was found almost constant. This result is in a good agreement with the theory of Gaussian beam profile. When the elongated plasma was formed there is a possibility of multiple breakdowns to occur. This is subjected to the occurrence of gross explosion at the focal point. Normally the formations of plasma are associated with the generation of acoustic shock waves. If multiple breakdowns occur, a gross multiple shock waves also involved. The gross explosion will creates turbulence in the surrounding area. This is the possible reason why the capturing event at the focal point became blurred. The optical geometry of the combination lenses technique is shown in Fig. 7. When the laser is focused, a short plasma length is induced with a smaller beam waist. This experimental result is in good agreement with the theory of Gaussian beam. When the beam waist is small, meaning that the power density is large thus emitted brighter sparkling or huge breakdown. Under this circumstance more atoms were ionized and spreading through the focal region, thus generated stronger plasma. Apparently the width of plasma was found greater especially when the peak.
(5) International Journal of Integrated Engineering (Issue on Electrical and Electronic Engineering). power is high.. ACKNOWLEDGEMENTS. Lens. Focal region. The authors wish to express their thanks to the Universiti Tun Hussein Onn Malaysia and Universiti Teknologi Malaysia and the government of Malaysia for financial support (Vote No. 71771). REFERENCES. Laser beam Focal length Fig. 6 Focused laser beam by using a single lens.. Biconcave lens. Biconvex lens. Laser beam. Focal region f1. f2. Fig. 7 Combination of two lenses to focus the laser beam. The focal region is quite small, thus there is a small spot compared with single lens technique.. Another advantage offered with this combination lenses technique is that it produces a point source of breakdown. It indicates that only a single explosion is created at the focal point accompanied with a very energetic and symmetrical distribution of acoustic shock wave. Such mechanism offers a lot of advantages in application either in material processing or for fusion reaction. Hence this type of plasma became preferable in many applications such as in laser machining and laser fusion research. 5.. CONCLUSION. Plasma was successfully generated in air by focusing a Q-switched Nd:YAG laser. Two techniques were employed to focus the laser beam that is a single lens and combination lenses. The plasma formation was grabbed by using a high-speed photography technique and analyzed with the aid of image processing system. Ellipsoidal plasma was obtained from a single lens technique, whereas broadly-ellipsoidal plasma was obtained from combination lenses technique. The length of ellipsoidal plasma was found greater than the broadly-ellipsoidal one. However the plasma width from both techniques does not appeared so much different, in fact the width of plasma from a single lens was found bigger compared to the result from combination lenses technique at higher power. Overall, the combination lenses are preferable technique for producing more energetic plasma.. [1] Motz, H. “The Physics of Laser Fusion”. London: Academic Press, 1979. [2] Yaffa and S. Eliezer. “The Fourth State of Matter: An Introduction to the Physics of Plasma.” Bristol: Adam Hilger, 1989. [3] Treumann R.A. and W. Baumjohann.“Advanced Space Plasma Physics.” London: Imperial College Press, 1997. [4] Noriah Bidin. “Studies on Laser Induced Cavitation Erosion and Mechanism of Cavitation Damage.” PhD Thesis: Universiti Teknologi Malaysia, 1995. [5] Mohd. Kamarulzaki Mustafa. “Characterized Cavitations and Damage Studies Due To Shock Wave Mechanism.” Master Thesis: Universiti Teknologi Malaysia, 2000. [6] Ahmad Hadi Ali and Noriah Bidin, Plasma Formation Induced by a Q-Switched Nd:YAG Laser, Jurnal Fizik Malaysia, Volume 25 No. 1&2, 2004, pp. 33-41. [7] Rabia Qindeel, Noriah Bidin and Yaacob Mat Daud, IR Laser Plasma Interaction With Glass, American Journal of Applied Sciences, 4 (12): 1009-1015, 2007. [8] Robledo-Martinez A., H. Sobral, M. Villagra´nMuniz, “Measurement of the electrical size of a laser-induced plasma in a uniform field”, Applied Surface Science, 2005, pp. 32–35, 248. [9] Horisawa H., H. Kuramoto, H. Emura, N. Uchida and I. Kimura. “Fundamental Study of a Relativistic Laser Plasma Thruster.” Proc. of ISTS. B-21:1-6, 2002. [10] Ahmad Hadi Ali. “Diagnostic of Laser Plasma Using Optical Techniques.” Master Thesis. Universiti Teknologi Malaysia, 2004. [11] Ahmad Hadi Ali and Noriah Bidin. “Diagnostic of Laser Plasma by Using High-speed Photographic Technique and Interfaced with Image Processing System.” Proc. of IMAGE 2003. Sarawak, Malaysia, 2003..
(6)
Figure
Related documents
Results of the survey are categorized into the following four areas: primary method used to conduct student evaluations, Internet collection of student evaluation data,
Parallelism method by CUDA on the graphics processing unit, in the case the threads have great access to the global memory and shared memory is not used, runtime
The Experiment relates to formulation and development of oral pharmaceutical bilayer tablet of esomeprazole and clarithromycin for administration of therapeutically
First, screening and treatment may interrupt cervical oncogenesis, normalizing ICC risk, although ICC precursors are more common in women with HIV than in HIV
Consequently, we suppose that the detected concentrations of REEs in Ko č ani paddy soils are associated with the concentrations of these elements in the predominantly acidic
Rebalance IRA is part of a broad trend of new investment advisory firms that seek to provide consumers with a fundamentally better set of retirement investment options,
For the poorest farmers in eastern India, then, the benefits of groundwater irrigation have come through three routes: in large part, through purchased pump irrigation and, in a
The report reveals some detailed synthesis methods of large area graphene from different precursors, starting from the growth processes, the precise mechanisms
