QUALITY CONTROL SOFTWARE FOR MANAGERS
Abdul Talib Bon & Muhammad An’nur Basiron
Faculty of Technology Management, Business and Entrepeneurship Universiti Tun Hussein Onn Malaysia
[email protected] [email protected]
ABSTRACT
Technology development drives many industries to keep on gearing up to produce value of product to make sure their survival in market. Therefore, the development of computer-based technology has also been widely used in manufacturing for oneself to witnessing and qualifying the production itself. Through new software development toolkit of control charts in manufacturing a keyboard, it can increase the manufacturer productivity in surviving the industry. A set of statistical process control (SPC) toolkit quality control may help in enhancing the manufacturing activities in term of quality by using control charts. In addition, the development of software based on Microsoft Visual Basic 2008 and Microsoft Office Access 2007 database are mainly produced to record the number of defects. Therefore, this study aims to collect data and products defects using the developed toolkit later then classified according to the kit software tools to converse the data into control chart (STCC) as well as the waterfall model can be used. As per stated in the methodology, this project is using the data flow diagram and entity relationship diagram to simplify the STCC system. Implementation and testing will be conducted after the STCC system software is fully developed and realized in order to be adopted by an organization. This software system development toolkit control chart that will help the organization in facilitating their gathering and recording of data products in the manufacturing process and produce a graph of control chart for keyboard as a reference in the continuous improvement of production systems in their daily operations.
Field of Research:Control Chart, Software, organization, management.
1. Introduction
1.1 Background of Research
organizations to collect the detail data of the product and the income graph charts for use in quality control of the manufacturing industry.
1.2 Problem Statement
Statistical Process Control (SPC) is an effective method to monitor the problem through the use of a product defect control charts. Stevenson (2002) states that the quality can be referred to as the ability of a product or service to meet or exceed customer expectations on an ongoing basis. Gary K. Griffith said that diversity in the use of process control charts can affect the quality of the final product and product defects can be detected and checked in advance, so as to reduce the cost of waste and anticipate potential problems that would arise if it is used by the customer. With early detection of defects and prevention, statistical process control has a distinct advantage in testing methods based on the income graph, such as checking on some products to detect and fix problems in the end product. But until now, most of the processing dat of data in the process manually. It requires more labor at a time. This can slow down the production expectations set at the time. In addition, data on quality control is still not well managed and well take a long time in the production of certain graphs associated with product quality. This led to the decision to access such information becomes slower and slower to run. Thus, this study was conducted to investigate whether the production of new software may solve the problem of processing data quality of a product defect and display graphics tool kit that is suitable for quality control in terms of labor costs and time.
1.3 Problem of Research
From the statement of the problem, some research questions can be constructed by the researchers:
a) What steps should be taken during the processing of data defects occur for quality control?
b) What is an effective way to enable the collection of data and create graphs about the quality of the production of a tool kit of products for control charts?
1.4 Objectives of Research
In this research, the researcher has set two main objectives of this study objectives are achieved. The objectives of this study are as follows:
a) Identify the steps that be taken during the processing of data defects occur for quality control.
b) Identify an effective way to enable the collection of data and create graphs about the quality of the production of a tool kit of products for control charts.
1.5 Scope of Research
products, product specifications, product defects and deformities and the date the product was produced and its specifications. The survey will be conducted in one industrial company producing the keyboard. The purpose of this study is to produce a software system completes with toolkit and control chart to monitor keyboard production. The respondents are the CEO of the quality keyboard, the senior operators and supervisor who directly involved in the introduction and implementation of the toolkit control chart or STCC in the company. The scope of this study was chosen because the targeted respondents were involved in quality management in the company.
1.6 Interests of Research
This research was conducted to provide a better understanding for students and the parties involved in term of quality management, especially implementation of the development of a SPC in a manufacturing software keyboard. Between the interests of the study are as follows:
a) Depending the knowledge in the product data for the Statistical Process Control (SPC) for the manufacture of the keyboard.
b) Aware of the advantages of a software system to assist the continuous improvement of an organization.
c) Help the industry improve the quality of products or services provided for customers to satisfy
d) Improving the management of the organization to help the working culture of excellence and timeliness.
1.7 Method of Research
Methods used to detect defects in a product are using Statistical Process Control (SPC) and quality control tool involves the use of common control charts. This control chart will generate reports and detailed analysis of the defects of a product for use in the management. Use Microsoft Visual Basic to develop system tool kit in the production system and the control chart as a Microsoft Office Access database for this system will also be used.
2.0 Literature Review
2.1 Introduction
2.2 Statistical Process Control (SPC)
Statistical Quality Control is part of quality control as described by Dale (1986) and it involves the collection, analysis and interpretation of data for use in quality control. Statistical process control means the use of statistical methods to monitor and control a process. Stevenson (2002) state statistical process control is a statistical evaluation of the output during the production process. However, statistical process control is an important element of statistical process control itself refers to the use of statistical methods to assess and monitor the process or product so that it will achieve and maintain control of the product.
2.2.1 Quality Control Tools
There are seven basic quality control tools that are commonly used to control the quality of so-called seven basic tools of quality control as recommended by Dr. K. Ishikawa (1985). Only one quality tool that is used out of the 7 basic tools of quality control is a control chart.
2.2.2 Control Chart
A control chart is a graphical method for identifying the presence of variations and the causes of these variations further indicate the need to take corrective action for a production process (Evans, JR, 1991). In addition, Doty, L. A. (1996) refers to the control charts as a graphical display showing a measure of the quality characteristics of products made. Statistical Process Control using control charts to enable efficient production process is controlled through periodic observations made by the users involved. Use of Statistical Process Control of the intervention on the process required only when the statistical evidence shows the current status of the process is far from the expected status (Xia, P., 2006). For the production of graphical charts in this system, it uses a concept of the calculation formula of the control chart chart p. There are several calculations formulas are needed in the production of charts of the average value of p (p), the fixed limit (p-bar), the control limit (UCL) and lower control limits (LCL).
2.3 Hardware and Software Requirements
2.3.1 Hardware Requirements
Hardware used to develop a system toolkit control chart is a personal laptop Acer Aspire 4925 with the following specifications with is Intel Core2 Duo 2.2Ghz, 2GB RAM, 160GB hard disk space and Nvidia 3D Graphic.
2.3.2 Software Requirements
2.3.3 Programming Languages
In the project development toolkit system of control charts (STCC), the Visual Basic programming language to be used, where it is a programming language for software applications. The database used is Microsoft Office Access 2007 to store all data and information.
2.4 Microsoft Visual Basic
Visual Basic NET or VB.NET is an object-oriented software programming language that can be seen as an evolution of Microsoft Visual Basic which is commonly done in the Microsoft NET Framework. Visual Basic programming language is the evolution of the programming language BASIC (Beginner's All-Purpose Symbolic Instruction Code). Visual Basic (VB) is a language translator that uses the mechanism of the run. But when it is packaged in a single system, the compiler will perform the duties of the Visual Basic program. Visual Basic is a programming language should run the Microsoft Windows environment. Each function is developed to direct an object implementing action based on an event or events that occur. This function is called as a method of programming languages to aid the object. VB has many advantages including: (i) Provide a simple graphical interface,(ii) Can control the implementation of application using the program,(iii) Able to achieve Application Program Interface,(iv) Facilities of object-oriented program,(iv) Error control, and (v) Can implement a structured program.
2.5 Database
The database can be defined as a set of related data and shared by the various categories of users to meet the information requirements of the organization (Pratt and Adamski, 2005). Since the data is an important asset to any organization, it must be stored and managed properly. A collection of data stored on a data storage known as the database. The database is a collection of data is very large and has integrated into one system. Some examples of the use is in the phone systems, ATM machines, television, online information, web site advertising and borrowing books in the library system.Data is the most important components in the system database because it is a basic fact of the information requirements of an organization. These data are stored in the database data dictionary. Hardware components required in a database system that meets certain specifications for the operation. The minimum hardware requirements depend on the type of application and database system architecture according to the organization and the database management system used (Abdullah, 2000). Databases that contain information will then be implemented by the database management system.
2.6 Database Management System
Microsoft Access. In systems development, database designed using the data modeling entity relationship model.
3.0 Methodology of Project Development
System Development Life Cycle (SDLC) is a comprehensive process of development of an information system in which it is a structured framework that consists of sequential processes. The methodology is a comprehensive set of guidelines that models, equipments and facilities, and special techniques to be followed in carrying out any activities in the systems development life cycle. The methodology also is a preliminary planning tool kit to develop systems of control charts (STCC) this. The selection of an appropriate system development methodology is essential to ensure the system objectives can be achieved.
3.1 Waterfall Model
In this research methodology, waterfall model was chosen. With this model, all activities are conducted in each phase will be more organized as a phase to be completed prior to going to the next phase. This model has four phases: planning phase, analysis phase, design phase and implementation phase.
3.1.1 Phase 1: Planning
Planning phase is the first step required before a system is developed. In this phase of the planning, has done in preparation for the development of a system. In this planning phase involves determining the topic, objectives, problems encountered statement, and the scope for the development of the system. In this phase a list of resource requirements such as hardware and software are identified to facilitate the development of this system.
3.1.2 Phase 2: Analysis
Analysis phase involves identifying and understanding the system to be developed. Furthermore, the study of the existing systems was also conducted where it involves the process of gathering the information needed. In this phase, data flow diagram to see the movement of data generated and the process involved in the system. Entity relationship diagram was generated to describe the relationship between external entities to the system.
3.1.3 Phase 3: Design
3.1.4 Phase 4: Implementation
After the design phase is completed, it will be followed by a phase of implementation. Among the activities are writing and coding program in which the activities will translate into the functions of the system source code. During the process of programming, software packages, Microsoft Visual Basic 2008 and Microsoft Office Access 2007 is used to perform database and try to make the program code to display the results. Each program is developed to be compatible with the built module.
3.2 Product Sample
The sample is an important initial product in the manufacturing sector. In this study, the sample is a plant product produced by the keypad (keyboard). There are six different keyboard models produced are manufactured, but only one type of keyboard models only be used as a sample.
3.3 Figure And Specification Product Sample
Specification is a specific form or the particulars of the direction in explaining the measure and limit parameters set on a sample of the product.
4.0 Analysis and Design
4.1 Introduction
Analysis and design an important phase in the development of a system. The analysis involves the identification and understanding of the system to be developed. Once the information required meeting the scope of the system, then the process is described travel system with a diagram Data Flow Diagram (DFD). The design involves the process of designing the interface and database. In database design, Entity Relationship Diagram (ERD) is produced.
4.2 Analysis of System Requirements
The analysis involves analyzing the system requirements for what will be done or can do with a system that will be produced and how it is done. It involves analyzing the data that is processed from input to output is detailed with the appropriate figure. In the analysis of system requirements, there are several methods used including the Data Flow Diagram (DFD) and Entity Relationship Diagram (ERD).
4.3 Data Flow Diagram (DFD)
overview of where it shows the scope and boundaries of the system developed in this project. Data flow diagram level-0 level is continued or details of the context diagram are constructed. This data flow diagram describes the main activity occur in systems where it is shown how the flow of data processing in the system and thus produce the desired output. To provide a more detailed description of the processes that occur in a system, data flow diagrams level level-1 set. These data flow diagrams will be explained in greater detail with respect to the processes described in the data flow diagram level-0.
4.4 Entity Relationship Diagrams (ERD)
Entity Relationship Diagrams (ERD) is an abstract concept and presentation of data in a system. ERD is a model of structuring the data analysis which includes the concept of making the data available in an abstract formula which can be programmed into the specification representing the database. It shows the relationship that exists between the entities of the STCC is the information search and information on the keyboard. Each entity has attributes below to indicate the need that exists in the operation.
4.5 Data Dictionary
Dictionary data is data about data or referred to as metadata and used as a storage center for storage of data for information systems. Dictionary of much help to analyze the data in the system defines the data that flows in the system, defining the data that can be done with a complete and structured. Formation carried in the data dictionary analysis and design of a system. Data dictionary to help explain the attributes, data types, the size of the word, allow null and lighting. Schedule the next display attribute and the details involved.
4.6 System Design
The design of the systems involved in development projects STCC system is composed of two types of user interface design and database design.
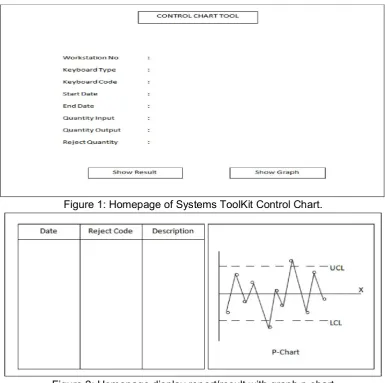
4.6.1 User Interface Design
Figure 1: Homepage of Systems ToolKit Control Chart.
Figure 2: Homepage display report/result with graph p-chart
4.6.2 Database Design
5.0 Implementation and Testing
5.1 Introduction
Implementation and testing is the final phase in a system development life cycle. This phase aims to ensure that all plans and activities that made the previous phases implemented and realized. Phase of testing will be done to the user after construction is completed and the system can be fully utilized. STCC system was developed using Microsoft Visual Basic 2008 to design the application interface of this system and Microsoft Office Access 2007 to create a database system. STCC system consists of four main modules that will be used to help people who comprise the quality of the keyboard for supervisors to manage both search and display information relating to the keyboard.
5.2 Implementation
Implementation involves translating all of the analysis made on a system that works. STCC system development project, there are three moduls. The modules log information search and display module information. In the implementation will be described in respect of each module was developed with the section presents the main program and the display interface.
5.2.1 Implementation Module Login
The display interface for users to log into STCC system is the first interface will appear as soon as the user wants to use this system. At this point the user is required to enter a user name and password to login into the system.
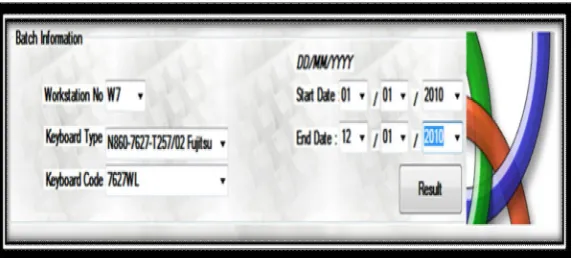
5.2.2 Implementation Module Searching Information Keyboard
Figure 3 shows the interface for information search and repair damaged keyboard based on date range entered. Distance of the final date must be after the commencement date to avoid avoid the difficulty of this system is to remove the existing information.
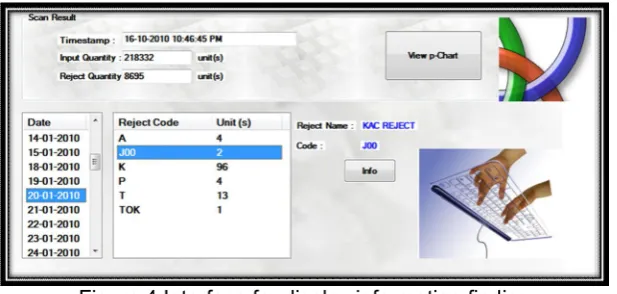
[image:10.595.148.437.529.658.2]5.2.3 Implementation Module Interpreting Result Information.
[image:11.595.138.447.233.380.2]Figure 4 shows the interface to display information from the search results are included in the search for information (batch information). It will display the current time, the total value added in the quantity and the quantity of damage based on the date range to search. It also displays the type of keyboard is damaged and the code for each date and also sought an explanation for the code to repair damaged or keyboard.
Figure 4 Interface for display information finding
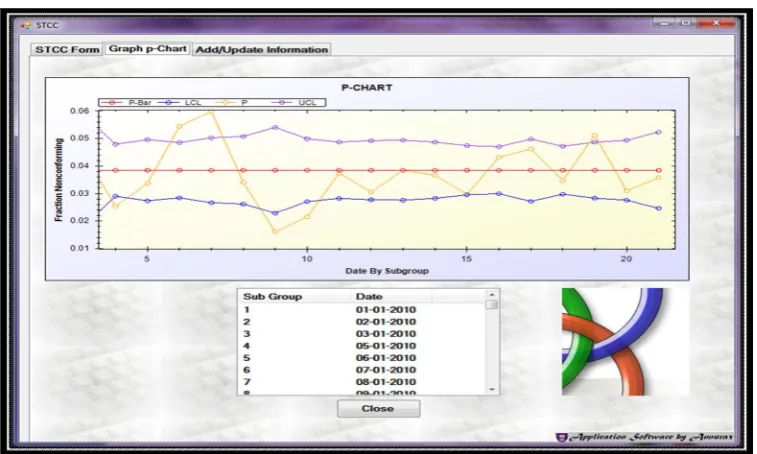
Figure 5 Interface for display graph p-chart
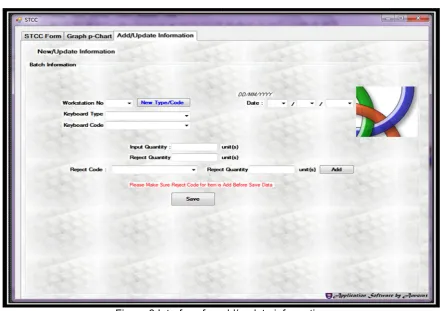
5.2.4 Implementasi Module Fill and Update Information
Figure 6 Interface for add/update information
5.3 Testing
The test involves testing the functionality of the system and ensures that the system has been developed to function within the scope of the set. In addition, the system is tested to ensure that users are satisfied with the system developed according to needs. Tests are performed to test the system functionality and user acceptance testing.
5.3.1 Function System Testing
Testing of the system functions are carried out to ensure that every function in the wake of the system functions as required. Function in the test system to test the ability of the system to function efficiently, the ability to handle data entry and can be used. There are four tests are created and all will be tested to ensure that the system can function and function well.
5.3.2 User Acceptance Testing
6.0 Conclusion and Suggestion
This chapter discusses the outcome of a development system toolkit control chart (STCC) is implemented, namely the constraints of the system and suggestions for the future. There are several constraints on the STCC system is developed. Among the constraints that exist are: (i) Each of information keyboards that entered into the system can not be seen again except to re-enter the new information to update existing information,(ii) This information search is subject to only one type of keyboard. This causes the user is difficult to make comparisons between the other information keyboards, and (iii) only one graph display of the control chart of the seven quality control tools in the SPC. This causes users to make a study based on graph p-chart.
In developing a better system in the future, recommendations are always required to be disclosed and taken into account. Among the proposals that could help in improving the system are: (i) Provide display information that has been entered into the system to facilitate for correction of the information charging the keyboard, (ii) Provides a search function of keyboard and display various information to facilitate a comparison between the types of other keyboards, and (iii) Prepare a graph of the production quality control, such as Histogram, Cause and Effect Diagram, Flowchart, Pareto chart, line chart and Figure dispersion. This can be disabled and diversify the search to find a product defect.
For the conclusion, the development of STCC system is providing an innovation in computing today. The development of this system is also one of the government's calls to develop manufacturing industries in our country. Although this system has been developed fully, but still exists constraints as described earlier. This is to ensure that this system is perfect in terms of quality and functionality and can be applied not only to make the keyboard, but can be applied in each of the products produced by industrial companies in Malaysia.
REFERENCES
Castagliola, P., Celano, G. and Fichera, S. (2007). “Economic-statistical design of an SEWMA control chart for monitoring process variability.” Journal of Quality in Maintenance Engineering. 13 (3). 304 – 320.
Griffith, G.K.(2000). “Statistical Process Control Method for Long and Short Runs.” Journal of Quality in Maintenance Engineering. 23 (2). 102– 245
Kroenke, D. M. (2000). “Database Processing :Fundamentals, Design And Implementation.” New Jersey : Prentice Hall.
Satzinger, J., Jackson, R., & Burd, S. (2009). Systems Analysis and Design in a Changing World. Course Technology, Cengage Learning.
Shammas N. C. (1993) “Visual basic : easy Windows programming” New Work :McGraw-Hill.
Su, F. Y. dan Chung, M. Y. (2004). “Economic statistical process control for overadjusted process mean.” International Journal of Quality & Reliability Management. 21 (4). 412 – 424.
Srikaeo, K., Furst, J. E. and Ashton, J. (2005).“Characterization of wheat-based biscuit cooking process by statistical process control techniques.” Food Control. 16 (4). 309 – 17.
Wang, W. and Zhang, W. (2008). “Early defect identification: application of statistical process control methods.” Journal of Quality in Maintenance Engineering. 14 (3). 225 – 236.
Xia, P. (2006). “Computer-aided SPC and cybernatic view on quality control. International Journal
of Quality & Reliability Management. 23 (9). 1192 – 1203.