PPAR
aa
deficiency reduces insulin resistance
and atherosclerosis in apoE-null mice
Karen Tordjman, … , Daniel P. Kelly, Clay F. Semenkovich
J Clin Invest.
2001;
107(8)
:1025-1034.
https://doi.org/10.1172/JCI11497
.
PPAR
a
is a ligand-dependent transcription factor expressed at high levels in the liver. Its
activation by the drug gemfibrozil reduces clinical events in humans with established
atherosclerosis, but the underlying mechanisms are incompletely defined. To clarify the role
of PPAR
a
in vascular disease, we crossed PPAR
a
-null mice with apoE-null mice to
determine if the genetic absence of PPAR
a
affects vascular disease in a robust
atherosclerosis model. On a high-fat diet, concentrations of atherogenic lipoproteins were
higher in PPAR
a
–/–apoE
–/–than in PPAR
a
+/+apoE
–/–mice, due to increased VLDL
production. However, en face atherosclerotic lesion areas at the aortic arch, thoracic aorta,
and abdominal aorta were less in PPAR
a
-null animals of both sexes after 6 and 10 weeks
of high-fat feeding. Despite gaining as much or more weight than their PPAR
a
+/+apoE
–/–littermates, PPAR
a
–/–apoE
–/–mice had lower fasting levels of glucose and insulin. PPAR
a
-null animals had greater suppression of endogenous glucose production in
hyperinsulinemic clamp experiments, reflecting less insulin resistance in the absence of
PPAR
a
. PPAR
a
–/–apoE
–/–mice also had lower blood pressures than their
PPAR
a
+/+apoE
–/–littermates after high-fat feeding. These results suggest that PPAR
a
may
participate in the pathogenesis of diet-induced insulin resistance and atherosclerosis.
Article
Find the latest version:
Introduction
Vascular disease is the most common cause of death in people with type 2 diabetes, which is characterized by obesity, hyperglycemia, hyperinsulinemia, hyperten-sion, and dyslipidemia. Insulin resistance is associated with each of these disorders (1). PPARs, ligand-activat-ed nuclear transcription factors (2), represent a poten-tial biologic link between insulin resistance and athero-genesis. Fibrates and thiazolidinediones, drugs commonly used to treat people with diabetes and vas-cular disease, are respective ligands for two of these
receptors, PPARαand PPARγ.
PPARαis present at high levels in the liver (3), where its activation increases fatty acid oxidation and alters apolipoprotein expression. PPARγis present at high lev-els in adipose tissue (4) where its activation increases lipid storage and enhances insulin sensitivity through poorly understood mechanisms. PPARs are found at multiple other sites including the kidney, a key deter-minant of blood pressure, and the vascular wall (5), a site commonly affected by insulin resistance (6, 7).
Atherosclerosis is characterized by the abnormal accu-mulation of lipid in blood vessels. Functional binding sites for PPARs are found in the promoters for several
genes involved in cellular lipid accumulation, including lipoprotein lipase (LPL) (8), the scavenger receptor CD36 (9), fatty acid transport protein (10), and long-chain acyl-CoA synthase (11). LPL and CD36 are expressed in the vascular wall. Mice deficient in LPL (12) or CD36 (13) are resistant to atherosclerosis. These findings raise the pos-sibility that PPARs and their natural ligands may partic-ipate in the progression of atherosclerotic lesions. Con-flicting data (9, 14) address the capacity of PPARs to promote the development of foam cells, essential partic-ipants in the atherosclerotic process. Gemfibrozil, a
PPARαactivator, decreases vascular events in humans
with established atherosclerosis (15), and PPARγligands decrease lesion formation in male (but not female) mice (16). These findings raise the possibility that systemic effects of PPAR activators overcome any potential adverse effects of these agents at the vessel wall. Defects in PPAR signaling have been implicated in the develop-ment of hypertension (17, 18). Hepatic activation of
PPARαaffects production of fibrinogen and
plasmino-gen-activator inhibitor-1 and improves dyslipidemia
(19). PPARα agonists may decrease adiposity and
increase insulin sensitivity (20). Collectively, these data suggest that the absence of PPARαwould increase lipids
PPAR
α
deficiency reduces insulin resistance and
atherosclerosis in apoE-null mice
Karen Tordjman,
1Carlos Bernal-Mizrachi,
1Laura Zemany,
1Sherry Weng,
1Chu Feng,
1Fengjuan Zhang,
1Teresa C. Leone,
1Trey Coleman,
1Daniel P. Kelly,
1,2and Clay F. Semenkovich
1,31Department of Medicine and the Center for Cardiovascular Research, 2Department of Molecular Biology and Pharmacology, and
3Department of Cell Biology and Physiology, Washington University School of Medicine, St. Louis, Missouri, USA
Address correspondence to: Clay F. Semenkovich, Division of Atherosclerosis, Nutrition, and Lipid Research,
Washington University School of Medicine, Campus Box 8046, 660 South Euclid Avenue, St. Louis, Missouri 63110, USA. Phone: (314) 362-4454; Fax: (314) 747-4477; E-mail: semenkov@im.wustl.edu.
Karen Tordjman and Carlos Bernal-Mizrachi contributed equally to this work. Received for publication October 6, 2000, and accepted in revised form March 13, 2001.
PPARαis a ligand-dependent transcription factor expressed at high levels in the liver. Its activation by the drug gemfibrozil reduces clinical events in humans with established atherosclerosis, but the underlying mechanisms are incompletely defined. To clarify the role of PPARαin vascular disease, we crossed PPARα-null mice with apoE-null mice to determine if the genetic absence of PPARαaffects vascular disease in a robust atherosclerosis model. On a high-fat diet, concentrations of atherogenic lipoproteins were higher in PPARα–/–apoE–/–than in PPARα+/+apoE–/–mice, due to increased VLDL
production. However, en face atherosclerotic lesion areas at the aortic arch, thoracic aorta, and abdominal aorta were less in PPARα-null animals of both sexes after 6 and 10 weeks of high-fat feed-ing. Despite gaining as much or more weight than their PPARα+/+apoE–/–littermates, PPARα–/–apoE–/–
mice had lower fasting levels of glucose and insulin. PPARα-null animals had greater suppression of endogenous glucose production in hyperinsulinemic clamp experiments, reflecting less insulin resist-ance in the absence of PPARα. PPARα–/–apoE–/– mice also had lower blood pressures than their
PPARα+/+apoE–/–littermates after high-fat feeding. These results suggest that PPARαmay participate
in the pathogenesis of diet-induced insulin resistance and atherosclerosis.
and blood pressure, decrease insulin sensitivity, and pro-mote atherosclerosis.
In this study, we address the role of PPARαin
diet-induced atherosclerosis and insulin resistance by
cross-ing PPARα-null mice (21) with apoE-deficient mice
(22). High-fat–fed PPARα-null mice have higher levels
of atherogenic lipoproteins, but surprisingly, are more responsive to insulin, have lower blood pressures, and develop less atherosclerosis.
Methods
Animals. PPARα-null mice (21) were crossed with apoE-null mice (22) in the C57Bl/6 background. Once
PPARα/apoE double-null mice were generated, these
animals were again crossed with apoE-null mice in the C57Bl/6 background, and offspring were bred to gen-erate PPARα–/–apoE–/– mice and PPARα+/+apoE–/–
lit-termates that were used as controls. We studied large numbers of these littermates with the same C57Bl/6 background of approximately 75%. Identical athero-sclerosis results were seen in mice with a C57Bl/6 back-ground of approximately 50% (see Figure 5a). Double-knockout founder mice were genotyped by Southern blotting and multiplex PCR. Offspring were geno-typed by PCR techniques alone. Mice were weaned to a rodent diet with a total fat content of 6% at 21 days of age. At 8 weeks of age, animals were started on a Western diet containing 0.15% cholesterol and pro-viding 42% calories as fat (TD 88137; Harlan Teklad, Madison, Wisconsin, USA). In some experiments,
ani-mals were fed the Western diet containing the PPARα
agonist WY-14,643 (TD 00591; Harlan Teklad). For these experiments, WY-14,643 was shipped directly from the supplier (Biomol Research Laboratories, Ply-mouth Meeting, Pennsylvania, USA) to Harlan Teklad and incorporated into diet TD88137 at a concentra-tion of 0.1% (wt/wt).
Analytical procedures. Mice were fasted for 4 hours before blood drawing. On the same day as blood draw-ing, serum was assayed for triglycerides, cholesterol, glucose, and nonesterified fatty acids (NEFA), as described (12, 23). Insulin was assayed by radioim-munoassay (Linco Research Inc., St. Charles, Missouri, USA). Levels of lipoproteins were analyzed by fast-pro-tein liquid chromatography as described (12, 23).
Lipoprotein metabolism. VLDL turnover was deter-mined using radiolabeled VLDL as described by Wein-stock et al. (24). PPARα+/+apoE–/–mice were injected
with 200 µCi [9,10-3H] palmitic acid in corn oil.
Forty-five minutes later, serum was isolated and subjected to
centrifugation overnight at 95,700 gusing a Beckman
TL55 rotor and a TL-100 ultracentrifuge. Radiolabeled VLDL was isolated and injected in fasting mice fol-lowed by collection of serum at 0.5, 1, 2, 5, and 20 min-utes. Triglyceride production rates were determined by chemically inhibiting intravascular lipolysis (25). Tri-ton WR 1339 was made 4% (vol/vol) in PBS (pH 7.4). Baseline triglycerides were measured in fasted mice, animals were injected with Triton WR 1339 at a dose
of 100 mg/kg, then serum triglycerides were deter-mined 15 and 30 minutes later.
Determination of LPL activity in postheparin plasma and macrophages. For postheparin LPL, mice were injected intraperitoneally with 200 U of sodium heparin as described (26). Thirty minutes later, venipuncture was performed, plasma was isolated, and LPL enzyme activ-ity was assayed as described (27). Macrophages were isolated as described by Febbraio et al. (13). Mice were injected intraperitoneally with a 4% solution of thio-glycolate on day 1. On day 5, peritoneal macrophages were isolated, washed, counted, and plated in DMEM plus 10% FBS. Cells were fed on day 6. On day 7, cells were washed and incubated in DMEM plus 0.5% BSA for 4 hours, followed by incubation with 0.5 U/ml heparin, collection of medium, and subsequent deter-mination of LPL activity.
Intimal lesion quantification. Lesion area was determined as described (12, 23). Images of pinned aortas were cap-tured using a digital camera and analyzed using an image-processing program. Data are reported as the percentage of involvement of the intimal surface area for the arch (extending from the aortic valve to a point just distal to the left subclavian artery), the thoracic aorta (extending to the last intercostal artery), and the abdominal aorta (extending to the ileal bifurcation).
Immunocytochemistry. Hearts were frozen in Tissue-Tek OCT compound (Sakura Finetek, Torrance, Cali-fornia, USA). Frozen sections at the proximal aorta were fixed with acetone, and endogenous peroxidase activity was quenched with 0.6% hydrogen peroxide in methanol. Slides were blocked for 45 minutes at room temperature in PBS with 1% BSA, 0.3% Triton X-100, and 5% horse serum (S-2000; Vector Laboratories, Burlingame, California, USA). Slides were incubated for 60 minutes at room temperature with a 1:50
dilu-tion of goat polyclonal anti-PPARαAb (SC-1982; Santa
Cruz Biotechnology Inc., Santa Cruz, California, USA), rinsed, then incubated with a 1:200 dilution of biotiny-lated anti-goat Ab (BA-9500; Vector Laboratories). Slides were rinsed again, sequentially incubated with streptavidin peroxidase followed by aminoethyl car-bazole substrate solution, then rinsed and counter-stained with hematoxylin.
Quantitative RT-PCR–based gene expression analyses. Ani-mals were fed a Western diet plus 0.1% WY-14,643 for 1 or 4 weeks, then aortas (from the origin to the iliac arteries) were isolated, weighed, and used to prepare RNA using guanidinium isothiocyanate and sedimen-tation through cesium chloride. Hepatic RNA was also prepared from each animal. Aortas from three to seven animals were pooled for each RNA analysis. There was no effect of genotype on aortic weights or RNA yields. Monocyte chemotactic protein (MCP-1), LPL, CD36, and GAPDH mRNA levels were quantified in the aorta, and acyl CoA oxidase (ACO) and GAPDH mRNA were determined in the liver. After treatment with DNase, 1
µg of total RNA was reverse transcribed using
with an oligo-dT primer. PCR was performed with the GeneAmp 5700 Sequence Detection System using the SYBR green dye kit (Applied Biosystems, Foster City, California, USA). Each assay included a negative con-trol using RNA not subjected to reverse transcription.
The following primers were used: LPL: 5′
CAGCAAGAC-CTTCGTGGTGA 3′(forward) and 5′ GTACAGGGCGGC-CACAAGT 3′(reverse); CD36: 5′ CAAGCTCCTTGGCATG-GTAGA 3′ (forward) and 5′ TGGATTTGCAAGCACAA-TATGAA 3′(reverse); ACO: 5′ ATTCTCACAGCAGTGGGAT-TCC 3′ (forward) and 5′ TCTGCAGCATCATAACAGT-GTTCTC 3′(reverse); MCP-1: 5′ CAGCCAGATGCAGT-TAACGC 3′ (forward) and 5′ GCCTACTCATTGGGAT-CATCTTG 3′ (reverse); GAPDH: 5′ GGCAAATTCAAC-GGCACAGT 3′(forward) and 5′ CGCTCCTGGAAGATG-GTGAT 3′(reverse). Product specificity was verified by running products on an agarose gel and by subjecting products to a heat-dissociation protocol. Messenger RNA levels were expressed as a percentage of GAPDH mRNA levels, which were not significantly different between genotypes.
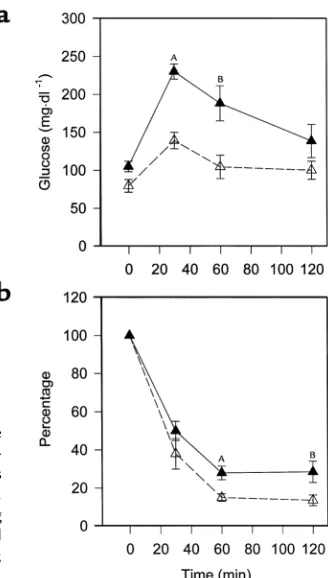
Glucose-tolerance and insulin-tolerance tests. Studies were performed as described (28). For several days before each study, mice were accustomed to handling. Glu-cose-tolerance testing preceded insulin-tolerance test-ing by at least 1 week. Both were performed followtest-ing an overnight fast, accounting for the lower fasting glu-cose levels (seen in Figure 8a) as compared with those (seen in Figure 2) which followed a 4-hour fast. Mice
received an intraperitoneal injection of 10% D-glucose (1 g/kg body weight) for glucose-tolerance testing, and an intraperitoneal injection of human regular insulin (Eli Lilly and Co., Indianapolis, Indiana, USA) at a dose of 0.75 U/kg body weight for insulin-tolerance testing. Tail vein blood (5–10 µl) was assayed for glucose at 0, 30, 60, and 120 minutes.
Hyperinsulinemic clamp. Clamp experiments were per-formed exactly as described previously (29). After
place-ment of a double-lumen catheter, 3-[3H]glucose was
[image:4.576.388.537.52.349.2]administered as a priming dose followed by an infusion of 0.04 µCi/minute for a 1-hour control period. Tail vein
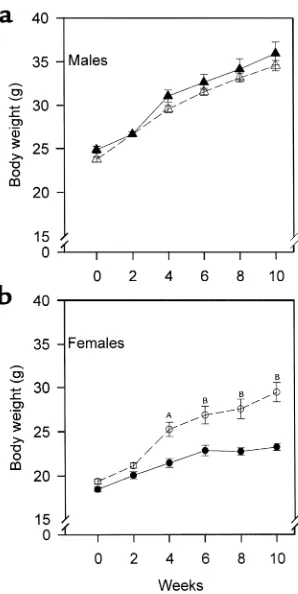
Figure 1
Sex-specific effect of PPARα deficiency on weight gain after high-fat feeding. PPARα–/–apoE–/–(open symbols) and PPARα+/+apoE–/–(filled symbols) mice were start-ed on a Western diet at the age of 2 months (week 0) and weighstart-ed every 2 weeks. (a) Tri-angles represent males and (b) circles represent females. AP= 0.0002 vs. PPARα+/+apoE–/–. BP< 0.0001 vs. PPARα+/+apoE–/–. For a, n= 19 at each time point for PPARα+/+apoE–/–
males and n= 27 for PPARα–/–apoE–/–males. For b, n= 23 for PPARα+/+apoE–/–females and n= 27 for PPARα–/–apoE–/–females.
Table 1
LPL enzyme activity in Western diet–fed mice
WY-14,643 PPARα+/+apoE–/– PPARα–/–apoE–/– Pvalue
Heparin-releasable No 5.77 ± 0.3 5.84 ± 0.2 0.8478
macrophage activity (12) (12)
(nmol/h/mg protein)
Postheparin plasma activity No 191 ± 29 158 ± 25 0.4161
(µmol/h/ml) (16) (12)
Postheparin plasma activity Yes 262 ± 7 168 ± 14 0.0017
(µmol/h/ml) (3) (3)
[image:4.576.57.530.552.669.2]glucose specific activity was determined at 45, 52, and 60 minutes to verify steady-state conditions. An insulin infusion (regular human; Eli Lilly and Co.) was started with an infusion of dextrose (25%) that was varied to maintain the blood glucose at 120 mg/dl for at least 90 minutes of the experimental period. 3-[3H]glucose
infu-sion was maintained, and 3-[3H]glucose was added to
the 25% dextrose infusion to approximate the glucose specific activity in the blood at the end of the control period. Specific activity in blood samples was deter-mined 10, 20, and 30 minutes before and at the end of the experimental period. The glucose infusion rate was stable for at least 30 minutes before the first specific-activity determination. Both blood glucose and glucose specific activity were at steady state during these sam-pling periods. The rate of appearance of glucose (Ra),
which is equal to glucose utilization (Rd) at steady state,
was determined by dividing the infusion rate of labeled glucose by the specific activity at the same time. Endoge-nous glucose production was determined by subtracting the unlabeled glucose infusion rate from Ra.
Blood pressure determinations. Systolic blood pressure was measured noninvasively in conscious mice using a tail-cuff system ( RTBP2005; Kent Scientific, Litchfield, Connecticut, USA). Mice were habituated to handling and placement in the blood pressure system for sever-al days. To optimize the pulse signsever-al, mice were heated to 38°C during each session. Five to eight measure-ments were recorded for each mouse at each session. Blood pressure results represent the mean of two or three sessions for each mouse on consecutive days.
Results
Effects of high-fat feeding on body weight. Mice were started on a high-fat, cholesterol-containing diet at the age of 8 weeks. In males, weight gain associated with high-fat
feeding was not affected by PPARαgenotype (Figure
1a). There was a genotype effect on weight gain in females (Figure 1b). PPARα–/–apoE–/–females (open
cir-cles) gained more weight than their PPARα+/+apoE–/–
littermates with high-fat feeding. By week 10, female
[image:5.576.60.352.50.309.2]PPARα–/–apoE–/– weighed 27% more than female
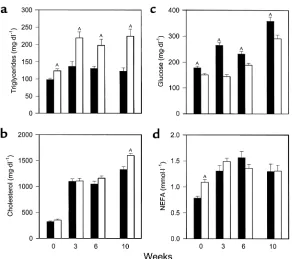
Figure 2
[image:5.576.57.529.616.702.2]Serum values in PPARα+/+apoE–/–mice (filled bars) and PPARα–/–apoE–/–littermates (open bars) after a 4-hour fast. Serum was obtained in animals at the age of 8 weeks on a chow diet (week 0). Mice were started on a Western-type diet containing 0.15% cholesterol and providing 42% calories as fat, then blood drawing was repeated at weeks 3, 6, and 10. Samples were assayed for triglycerides (a), cholesterol (b), glu-cose (c), and NEFA (d) the same day of sample collection. Bars, mean ± SEM for 27–57 mice measured in eight separate experiments over 18 months. AP< 0.01 with exact Pvalues for sever-al comparisons given in the text.
Table 2
Endogenous glucose production and insulin responsiveness in Western diet–fed mice
PPARα+/+apoE–/– PPARα–/–apoE–/– Pvalue
Basal Ra 14.7 ± 1.9 10.0 ± 1.6 0.1073
(mg/kg/min)
Clamp Rd 46.8 ± 11.0 46.2 ± 7.4 0.9654
(mg/kg/min)
Endogenous glucose production 5.1 ± 1.1 0 0.0286
(mg/kg/min)
Data are expressed as mean ± SEM. Tracer-determined rates of glucose utilization were performed at steady state in four equal-weight mice of each genotype. Endogenous glucose production was calculated by subtracting the glucose infusion rate from steady-state Raduring the clamp and was 0 for each of the
PPARα+/+apoE–/–mice (P< 0.0001). Food intake was
unaffected by PPARα genotype. Single-knockout
PPARαfemale (but not male) mice eating chow diets
are known to develop obesity with aging (30).
Fasting serum chemistries. For all serum measurements, values tended to be higher in males, but genotype effects were the same in both sexes so data from males and females are presented together. Fasting triglyc-erides (Figure 2a) were significantly higher in PPARα–/–apoE–/–mice than PPARα+/+apoE–/–mice at
baseline (week 0) and remained significantly higher at 3, 6, and 10 weeks of high-fat feeding. Cholesterol lev-els (Figure 2b) were the same in PPARα–/–apoE–/–and
PPARα+/+apoE–/–on a chow diet (week 0) and increased
threefold in both genotypes with cholesterol feeding by 3 weeks. Cholesterol levels were 10% higher in PPARα–/–apoE–/–mice at 6 weeks and 20% higher at 10
weeks (P= 0.0019; n= 30 for PPARα–/–apoE–/–and n=
29 for PPARα+/+apoE–/–).
Fasting glucose (Figure 2c) was 18% lower in PPARα–/–apoE–/–mice compared with PPARα+/+apoE–/–
mice at baseline (P = 0.0006). High-fat feeding
increased glucose levels in both genotypes, but levels
were significantly lower at each time point in PPARα–/–
mice. After 10 weeks on the Western diet, glucose levels were 23% lower in PPARα–/–apoE–/–mice (P= 0.0022; n= 32 for PPARα–/–and n= 38 for PPARα+/+). Insulin
levels were 0.25 ± 0.03 ng/ml in PPARα–/–apoE–/–mice
(n= 15) and 0.55 ± 0.08 ng/ml in PPARα+/+apoE–/–mice
(n= 17) at the 10-week time point (P= 0.0036),
sug-gesting that lower glucose levels in PPARα-null mice
reflect enhanced insulin sensitivity compared with their wild-type littermates.
Fasting NEFA levels (Figure 2d) were 39% higher in PPARα-null mice at baseline (week 0, P< 0.0001; n= 50 for PPARα–/–apoE–/–and n= 42 for PPARα+/+apoE–/–). This
genotype-specific difference was lost with high-fat feeding (compare weeks 3, 6, and 10 with week 0 in Figure 2d).
Lipoprotein characterization and metabolism in PPARα+/+apoE–/–and PPARα–/–apoE–/–mice. Size
[image:6.576.368.523.53.336.2]exclu-sion chromatography of lipoproteins (Figure 3) from
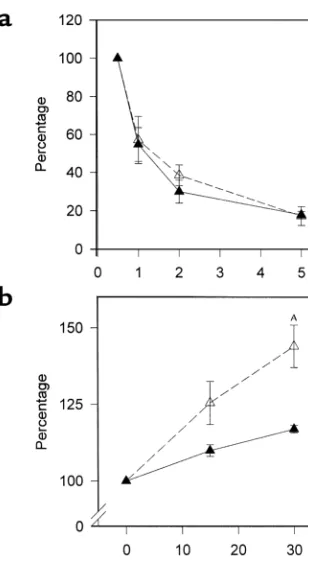
Figure 3
[image:6.576.64.218.440.705.2]High-resolution size-exclusion chromatography profile of serum triglycerides (a) and cholesterol (b) from PPARα–/–apoE–/– mice (open symbols, broken line) and PPARα+/+apoE–/–littermates (filled symbols, solid line). Serum samples from eight males of each genotype eating a Western-type diet for 6 weeks were pooled, sepa-rated by chromatography, and individual fractions were assayed for lipid content. The profile is representative of four independent lipoprotein profile comparisons performed in different cohorts of mice.
Figure 4
male mice fed a Western diet for 6 weeks showed that
elevated triglycerides in PPARα–/–apoE–/–mice were
due to elevated concentrations of VLDL (Figure 3a). PPARα–/–apoE–/–mice also tended to have higher
lev-els of VLDL and IDL/LDL cholesterol (Figure 3b) that became more pronounced by 10 weeks on the Western diet (not shown). The same patterns were seen in female mice.
VLDL clearance was the same in animals of each genotype (Figure 4a). For these studies, we used
radio-labeled VLDL synthesized by PPARα+/+apoE–/–mice to
focus on LPL and not particle composition. VLDL from
PPARα–/–apoE–/–animals would be expected to have
decreased clearance in part due to an elevated apoCIII content. Triglyceride production was increased in
PPARα–/–apoE–/– animals (Figure 4b), providing an
explanation for the elevated VLDL concentrations seen in these mice (Figure 3).
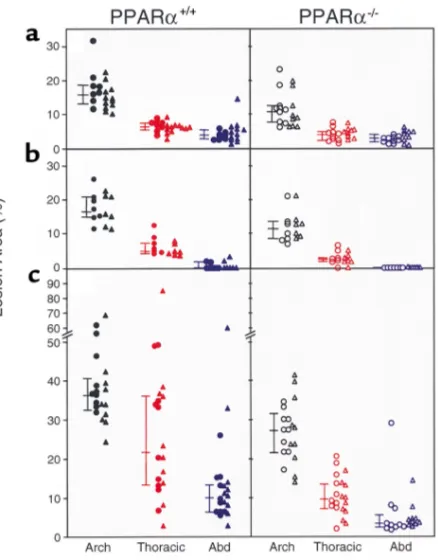
Lesion extent in Western diet–fed mice. Atherosclerosis was quantified by pinning aortas en face and measur-ing the percentage of intimal surface affected by atheroma at three different sites in each animal: aortic arch, thoracic aorta, and abdominal aorta. Figure 5 shows lesion extent in 54 PPARα+/+apoE–/–mice and 53
PPARα–/–apoE–/–mice studied after either 6 weeks
(Fig-ure 5, a and b) or 10 weeks (Fig(Fig-ure 5c) on the Western diet. Littermates with the same C57Bl/6 background of approximately 75% were used for Figure 5, b and c. Fig-ure 5a shows data from mice with a C57Bl/6 back-ground of approximately 50%.
Despite having 20% higher serum cholesterol than PPARα+/+apoE–/–littermates, PPARα–/–apoE–/–mice fed
[image:7.576.66.285.51.331.2]the Western diet for 10 weeks had less atherosclerosis (Figure 5c). Median lesion area was 25% lower at the
Figure 5
Aortic intimal lesions measured in 54 PPARα+/+apoE–/–mice (left side of figure, filled symbols) and 53 PPARα–/–apoE–/–mice (right side of figure, open symbols) after 6 weeks (aand b) or 10 weeks (c) on a Western diet. Mice in ahad a lower background admixture of C57Bl/6 genes (∼50%) than the mice in band c(∼75%). Males are indicated by triangles and females by circles. For each aorta, separate measurements of lesion area were made at the arch, thoracic aorta, and abdominal aorta. Connect-ed bars to the left of each data set indicate the mConnect-edian with 25% and 75% confidence intervals. Lesion area was significantly greater in PPARα+/+than PPARα–/–mice for each of the nine data sets (see text for P values). Comparisons were made between the same aortic regions. As an example, in cthe lesion area at the thoracic aorta in PPARα+/+mice (indicated by the filled red symbols on the left side) was significantly greater than the lesion area at the thoracic aorta in PPARα–/–mice (indi-cated by the open red symbols on the right side).
Figure 6
[image:7.576.237.517.541.733.2]arch (P< 0.0001), 54% lower at the thoracic aorta (P<
0.0001), and 65% lower at the abdominal aorta (P<
0.0001) in PPARα–/–apoE–/– compared with
PPARα+/+apoE–/– mice. As expected, overall lesion
extent was less after 6 weeks on the Western diet, but PPAR genotype effects were the same (Figure 5b).
Lesion area at 6 weeks was 31% lower at the arch (P=
0.0038), 60% lower at the thoracic aorta (P< 0.0001),
and 100% lower at the abdominal aorta (P= 0.0385) in
the PPARα-null animals. The same genotype effects on
atherosclerosis were seen in mice with a lower admix-ture of C57Bl/6 background genes (Figure 5a). At 6
weeks, lesion area was 34% lower at the arch (P =
0.0017), 34% lower at the thoracic aorta (P< 0.0001),
and 29% lower at the abdominal aorta (P= 0.0316) in
PPARα-null animals.
Immunocytochemistry of vascular lesions. To confirm that
PPARα was present in the atherosclerotic lesions of
PPARα+/+apoE–/– mice, immunocytochemical studies
were performed (Figure 6). Immunostaining for PPARα
was prominent in nuclei throughout the lipid-filled neointima of PPARα+/+apoE–/–lesions. Some endothelial
cells showed staining for PPARα. In addition, nuclear
staining was detected in the media within elongated, spindle-shaped cells (arrows, Figure 6) resembling smooth muscle cells. Parallel staining (not shown) using an anti-macrophage Ab (MAC-3; BD Pharmingen, San
Diego, California, USA) and an anti-smooth muscle α
actin Ab (Zymed, South San Francisco, California, USA) confirmed that the PPARα+/+-positive cells in the
neoin-tima and media were macrophages and smooth muscle cells, respectively.
Plasma and macrophage LPL enzyme activity. PPARαmay regulate LPL expression, and LPL in the vasculature can promote atherosclerosis. The lack of a difference in
VLDL clearance (Figure 4a) suggests that PPARα
geno-type does not have a major effect on LPL activity in these mice. Heparin-releasable activity was identical in thio-glycolate-elicited peritoneal macrophages from PPARα+/+apoE–/–mice and PPARα–/–apoE–/–mice (Table
[image:8.576.76.274.55.331.2]1). There was also no significant difference in posthep-arin plasma LPL activity between these animals (Table 1). However, these animals were studied in the fasting
Figure 7
Aortic expression of LPL, CD36, and MCP-1. PPARα+/+apoE–/–(filled bars) and PPARα–/–apoE–/–(open bars) mice were fed a Western diet plus 0.1% WY-14,643 for 1 week or 4 weeks, followed by isolation of RNA from the entire aorta and analysis by quantitative RT-PCR. Data are presented relative to GAPDH mRNA levels in the same samples. (a) AP= 0.0002, (b) AP= 0.0437, (c) AP= 0.0002, (d) AP= 0.0041, (f) AP= 0.0006, all versus PPARα–/–apoE–/–. Hepatic ACO mRNA in the same animals was 10.7-fold and 4.3-fold higher in PPARα+/+apoE–/–as compared with PPARα–/–apoE–/–mice at 1 and 4 weeks, respectively (both P< 0.001).
Figure 8
[image:8.576.357.521.440.729.2]state and natural PPARαagonists provided by feeding might alter LPL expression.
To determine if PPAR activation can affect LPL in these animals, mice were fed Western diet containing
0.1% WY-14,643, a potent PPARα agonist. After 1
week, postheparin plasma LPL activity was
signifi-cantly higher in PPARα+/+mice (Table 1). However,
VLDL clearance after 1 week of dietary supplementa-tion with WY-14,643 was virtually identical in PPARα+/+apoE–/–and PPARα–/–apoE–/–mice (n= 4 per
genotype, data not shown).
Aortic gene expression. Consistent with our finding of
greater postheparin LPL enzyme activity in PPARα
agonist–treated PPARα+/+ mice, LPL mRNA levels
(normalized to GAPDH) were significantly higher in
the aortas of PPARα+/+apoE–/– as compared with
PPARα–/–apoE–/–mice after 1 week of agonist
treat-ment (Figure 7a). At the same time point, aortic mes-sage levels for CD36 and MCP-1 were also higher in agonist-treated PPARα+/+mice (Figure 7, b and c). This
difference was sustained at 4 weeks of agonist treat-ment for MCP-1 (Figure 7f). However, CD36 mRNA levels were the same in both genotypes (Figure 7e), and
LPL mRNA levels were significantly lower in PPARα+/+
mice after 4 weeks of WY-14,643 (Figure 7d). In the
same animals, hepatic ACO (a known PPARα
-respon-sive gene) mRNA levels were 10.7-fold higher in PPARα+/+apoE–/–as compared with PPARα–/–apoE–/–
mice (P= 0.0004) at 1 week and 4.3-fold higher in
PPARα+/+apoE–/–as compared with PPARα–/–apoE–/–
mice (P= 0.0002) at 4 weeks.
Glucose metabolism. To determine if a difference in insulin sensitivity is present before the time points showing differences in atherosclerosis, we performed glucose-tolerance and insulin-tolerance tests in sepa-rate cohorts of animals after 4 weeks of high-fat
feed-ing. PPARα–/–apoE–/–mice had lower glycemic
excur-sions than PPARα+/+apoE–/–mice at 30 minutes (P=
0.0003) and 60 minutes (P= 0.0162) after a glucose
challenge (Figure 8a). PPARα–/–apoE–/–mice became
more hypoglycemic than PPARα+/+apoE–/– mice in
response to exogenous insulin (Figure 8b). Hyperinsu-linemic clamp experiments demonstrated that the
lower glucose levels were due to the effects of insulin on endogenous glucose production (Table 2).
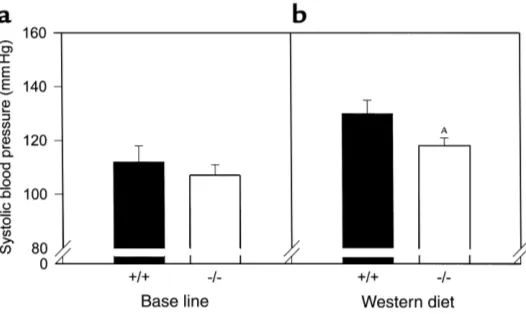
Blood pressure determinations. Since hypertension is associated with insulin resistance and promotes ather-osclerosis, we measured blood pressures in these mice. There was no effect of PPARαon systolic blood pressure at baseline (Figure 9a). Blood pressure increased in both genotypes after 4 weeks of high-fat feeding (Figure 9b),
but were 10% lower in PPARα–/–apoE–/–mice as
com-pared with PPARα+/+apoE–/–mice (P= 0.0336; n= 29 for
PPARα–/–apoE–/–and n= 17 for PPARα+/+apoE–/–).
Discussion
In this study, we show that apoE-null mice are rela-tively protected from diet-induced insulin resist-ance and atherosclerosis by the genetic absence of
the ligand-activated transcription factor PPARα.
Mice deficient in PPARαhad higher concentrations
of atherogenic lipoproteins but more insulin sensi-tivity, lower blood pressures, and fewer intimal
lesions. These results were unexpected since PPARα
agonists decrease clinical events in humans with vascular disease.
To our knowledge, humans with complete PPARα
deficiency have not yet been described. However, a leucine to valine missense mutation at residue 162 of
the PPARαmolecule is common in different ethnic
groups (31–33). This mutation is in the DNA-binding domain and has functional consequences in transacti-vation assays (33). Humans with this mutation, like
mice with PPARαdeficiency, have higher
concentra-tions of atherogenic lipoproteins. The current results raise the possibility that dyslipidemia in these individ-uals may not have the same adverse consequences as
dyslipidemia in those with wild-type PPARα.
PPARαdeficiency in mice may decrease atherosclerosis either through systemic or vessel wall effects. In terms of systemic effects, the liver is a source of several PPARα -responsive molecules implicated in atherosclerosis, including fibrinogen, plasminogen activator inhibitor-1 (PAI-1), and apoAI. Genetic modulation of fibrinogen (34) or PAI-1 (35) does not appear to affect lesion size in apoE-null mice. Overexpression of apoAI decreases
ath-Figure 9
[image:9.576.273.536.55.212.2]erosclerosis in apoE-null mice (36), and apoAI levels are
known to be elevated in PPARα-null mice (37). We did
not measure apoAI levels in our experiments. As expect-ed, HDL levels in these Western diet–fed mice were extremely low regardless of genotype, making it unlikely that HDL has a major effect on the vascular phenotype. Glucose levels were significantly lower in PPARα-null animals, providing another potential systemic etiology for less atherosclerosis in these mice. In humans, glu-cose levels are strongly and positively associated with ischemic heart disease even among nondiabetics (38). In mice, experimental diabetes can be associated with increased atherosclerosis (39, 40). However, dyslipi-demia rather than hyperglycemia may be responsible for this effect (41).
Blood pressures were lower in PPARα-null animals, a
systemic effect that might explain why animals with higher concentrations of atherogenic lipoproteins would have fewer lesions. Independent of lipid levels, apoE-null mice deficient in endothelial nitric oxide syn-thase have higher blood pressures and more
athero-sclerosis (42). PPARα-null mice were protected from
insulin resistance, which might explain the lower blood pressures in these mice. Insulin infusion does not dilate blood vessels in subjects with insulin resistance due to impaired nitric oxide production by insulin-resistant endothelial cells (7). Endothelial expression of Akt, a mediator of insulin signaling, increases nitric oxide production and promotes vasodilation (43).
The absence of PPARαin the vessel wall may have
contributed to the vascular phenotype. PPARαcan
increase LPL activity. Vascular wall LPL promotes the retention of atherogenic lipoproteins and has been shown to be proatherogenic by independent groups using different mouse models (12, 44–46). Using
short-term administration of a potent PPARαagonist
(WY-14,643) as a tool to mimic activation of PPARα
that might be expected to occur with feeding, we found higher levels of plasma postheparin LPL enzyme activity and higher levels of aortic mRNA for
LPL in PPARαmice. Message levels for the
proathero-genic molecules CD36 (13) and MCP-1 (47) were also
higher in PPARα+/+as compared with PPARα–/–mice
at a time point when large differences in atheroscle-rosis would not be expected. These observations do
not prove that PPARαin the vessel wall is
proathero-genic since systemic effects can alter vessel wall gene expression. However, they are consistent with recent data showing that WY-14,643 induces MCP-1 synthe-sis by endothelial cells and that atherogenic lipids increase MCP-1 production by these cells through a
PPARα-dependent mechanism (48).
PPARαpromotes fatty acid oxidation. Defects in
fatty acid oxidation are known to affect glucose
metabolism, and PPARα-null mice are prone to the
development of hypoglycemia in response to stressors (49, 50). Our data show that these mice are protected from diet-induced insulin resistance, consistent with the notion that inhibition of fatty acid oxidation is a
potential strategy for the treatment of diabetes (51). More than 30 years ago, Williamson and colleagues (52) showed that fatty acid oxidation promotes insulin resistance in the liver, a major site of PPARαexpression, in part by generating NADH. The availability of cytoso-lic NADH promotes an NADH/NADPH oxidase activ-ity (53), a major source of superoxide generation. Superoxide anion may promote atherogenesis by mul-tiple mechanisms, including the promotion of
hyper-tension. PPARα deficiency in the vessel wall could
decrease fatty acid oxidation, leading to less production of NADH, less superoxide production, lower blood pressure, less oxidative modification of lipoproteins, and less atherosclerosis. If this scheme is true, selective
antagonists of PPARαacting at the vessel wall could
decrease vascular disease.
Acknowledgments
This work was supported by the NIH grants HL-58427, DK-53198, the Washington University Clinical Nutrition Research Unit (DK56341), and the Washington Univer-sity Diabetes Research and Training Center (DK20579). L. Zemany was supported by the Four Schools Physician-Scientist Program. We thank Jay Heinecke and Jeff Saffitz for commenting on the manuscript.
1. Howard, G., et al. 1996. Insulin sensitivity and atherosclerosis. Circula-tion.93:1809–1817.
2. Kersten, S., Desvergne, B., and Wahli, W. 2000. Roles of PPARs in health and disease. Nature.405:421–424.
3. Palmer, C.N.A., Hsu, M.-H., Griffin, K.J., Raucy, J.L., and Johnson, E.F. 1998. Peroxisome proliferator activated receptor-αexpression in human liver. Mol. Pharmacol. 53:14–22.
4. Braissant, O., Foufelle, F., Scotto, C., Dauca, M., and Wahli, W. 1996. Dif-ferential expression of peroxisome proliferator-activated receptors: tis-sue distribution of PPAR-α, -β, and -γin the adult rat. Endocrinology.
137:354–366.
5. Chinetti, G., et al. 2000. CLA-1/SR-BI is expressed in atherosclerotic lesion macrophages and regulated by activators of peroxisome prolifer-ator-activated receptors. Circulation. 101:2411–2417.
6. Laakso, M., Edelman, S.V., Brechtel, G., and Baron, A.D. 1990. Decreased effect of insulin to stimulate skeletal muscle blood flow in obese man. A novel mechanism of insulin resistance. J. Clin. Invest. 85:1844–1852. 7. Steinberg, H.O., et al. 1997. Elevated circulating free fatty acid levels impair
endothelium-dependent vasodilation.J. Clin. Invest.100:1230–1239. 8. Schoonjans, K., et al. 1996. PPARαand PPARγactivators direct a
tissue-specific transcriptional response via a PPRE in the lipoprotein lipase gene. EMBO J. 15:5336–5348.
9. Tontonoz, P., Nagy, L., Alvarez, J.G., Thomazy, V.A., and Evans, R.M. 1998. PPARγpromotes monocyte/macrophage differentiation and update of oxidized LDL. Cell. 93:241–252.
10. Frohnert, B.I., Nui, T.Y., and Bernlohr, D.A. 1999. Identification of a functional peroxisome proliferator-activated responsive element in the murine fatty acid transport protein gene. J. Biol. Chem. 274:3970–3977. 11. Schoonjans, K., et al. 1995. Induction of the acyl-coenzyme A synthetase gene by fibrates and fatty acids is mediated by a peroxisome proliferator response element in the C promoter. J. Biol. Chem. 270:19269–19276. 12. Semenkovich, C.F., Coleman, T., and Daugherty, A. 1998. Effects of het-erozygous lipoprotein lipase deficiency on diet-induced atherosclerosis in mice. J. Lipid Res. 39:1141–1151.
13. Febbraio, M., et al. 2000. Targeted disruption of the class B scavenger receptor CD36 protects against atherosclerotic lesion development in mice. J. Clin. Invest. 105:1049–1056.
14. Chinetti, G., et al. 2001. PPAR-αand PPAR-γactivators induce choles-terol removal from human macrophage foam cells through stimulation of the ABCA1 pathway. Nat. Med.7:53–58.
15. Rubins, H.B., et al. 1999. Gemfibrozil for the secondary prevention of coronary heart disease in men with low levels of high-density lipopro-tein cholesterol. N. Engl. J. Med.341:410–418.
J. Clin. Invest.106:523–531.
17. Yu, H., and Nicolantonio, R. 1998. Altered nuclear protein binding to the first intron of the renin gene of the spontaneously hypertensive rat.
Clin. Exp. Hypertens. 20:817–832.
18. Barroso, I., et al. 1999. Dominant negative mutations in human PPARgamma associated with severe insulin resistance, diabetes mellitus and hypertension. Nature.402:880–883.
19. Torra, I.P., Gervois, P., and Staels, B. 1999. Peroxisome proliferator-acti-vated receptor alpha in metabolic disease, inflammation, atherosclero-sis and aging.Curr. Opin. Lipidol.10:151–159.
20. Guerre-Millo, M., et al. 2000. Peroxisome proliferator-activated receptor alpha activators improve insulin sensitivity and reduce adiposity. J. Biol. Chem.275:16638–16642.
21. Lee, S.S.T., et al. 1995. Targeted disruption of the αisoform of the per-oxisome proliferator-activated receptor gene in mice results in abolish-ment of the pleiotropic effects of peroxisome proliferators. Mol. Cell. Biol.
15:3012–3022.
22. Zhang, S.H., Reddick, R.L., Burkey, B., and Maeda, N. 1994. Diet-induced atherosclerosis in mice heterozygous and homozygous for apolipopro-tein E gene disruption. J. Clin. Invest.94:937–945.
23. Towler, D.A., Bidder, M., Latiffe, T., Coleman, T., and Semenkovich, C.F. 1998. Diet-induced diabetes activates an osteogenic gene regulatory pro-gram in the aortas of low density lipoprotein receptor-deficient mice. J. Biol. Chem.273:30427–30434.
24. Weinstock, P.H., et al. 1995. Severe hypertriglyceridemia, reduced high density lipoprotein, and neonatal death in lipoprotein lipase knockout mice. Mild hypertriglyceridemia with impaired very low density lipopro-tein clearance in heterozygotes. J. Clin. Invest.96:2555–2568. 25. Abdel-Fattah, G., Fernandez, M.L., and McNamara, D.J. 1995.
Regula-tion of guinea pig very low density lipoprotein secreRegula-tion rates by dietary fat saturation. J. Lipid Res.36:1188–1198.
26. Coleman, T., et al. 1995. COOH-terminal disruption of lipoprotein lipase in mice is lethal in homozygotes, but heterozygotes have elevated triglyc-erides and impaired enzyme activity. J. Biol. Chem.270:12518–12525. 27. Seip, R.L., Angelopoulos, T.J., and Semenkovich, C.F. 1995. Exercise
induces human lipoprotein lipase gene expression in skeletal muscle but not adipose tissue. Am. J. Physiol.268:E229–E236.
28. Li, B., et al. 2000. Skeletal muscle respiratory uncoupling prevents diet-induced obesity and insulin resistance in mice. Nat. Med.6:1115–1120. 29. Marshall, B., et al. 1999. Relative hypoglycemia and hyperinsulinemia in mice with heterozygous lipoprotein lipase (LPL) deficiency: islet LPL reg-ulates insulin secretion. J. Biol. Chem.274:27426–27432.
30. Costet, P., et al. 1998. Peroxisome proliferator-activated receptor α -iso-form deficiency leads to progressive dyslipidemia with sexually dimor-phic obesity and steatosis. J. Biol. Chem. 273:29577–29585.
31. Flavell, D.M., et al. 2000. Variation in the PPARalpha gene is associated with altered function in vitro and plasma lipid concentrations in type II diabetic subjects. Diabetologia.43:673–680.
32. Vohl, M.C., et al. 2000. Molecular scanning of the human PPARαgene: association of the L162V mutation with hyperapobetalipoproteinemia.
J. Lipid Res.41:945–952.
33. Sapone, A., et al. 2000. The human peroxisome proliferator-activated receptor alpha gene: identification and functional characterization of two natural allelic variants. Pharmacogenetics.10:321–333.
34. Xiao, Q., et al. 1998. Fibrinogen deficiency is compatible with the devel-opment of atherosclerosis in mice. J. Clin. Invest. 101:1184–1194. 35. Sjoland, H., et al. 2000. Atherosclerosis progression in LDL
receptor-defi-cient and apolipoprotein E-defireceptor-defi-cient mice is independent of genetic alterations in plasminogen activator inhibitor-1. Arterioscler. Thromb. Vasc. Biol.20:846–852.
36. Paszty, C., Maeda, N., Verstuyft, J., and Rubin, E.M. 1994. Apolipopro-tein AI transgene corrects apolipoproApolipopro-tein E deficiency-induced athero-sclerosis in mice. J. Clin. Invest.94:899–903.
37. Peters, J.M., et al. 1997. Alterations in lipoprotein metabolism in perox-isome proliferator-activated receptor α-deficient mice. J. Biol. Chem.
272:27307–27312.
38. Khaw, K.-T., et al. 2001. Glycated hemoglobin, diabetes, and mortality in men in Norfolk cohort of European Prospective Investigation of Cancer and Nutrition (EPIC-Norfolk). BMJ. 322:1–6.
39. Schreyer, S.A., Wilson, D.L., and LeBoeuf, R.C. 1998. C57BL/6 mice fed high fat diets as models for diabetes-accelerated atherosclerosis. Athero-sclerosis.136:17–24.
40. Park, L., et al. 1998. Suppression of accelerated diabetic atherosclerosis by the soluble receptor for advanced glycation endproducts. Nat. Med.
4:1025–1031.
41. Reaven, P., Merat, S., Casanada, F., Sutphin, M., and Palinski, W. 1997. Effect of streptozotocin-induced hyperglycemia on lipid profiles, for-mation of advanced glycation endproducts in lesions, and extent of ath-erosclerosis in LDL receptor-deficient mice. Arterioscler. Thromb. Vasc. Biol.
17:2250–2256.
42. Knowles, J.W., et al. 2000. Enhanced atherosclerosis and kidney dys-function in eNOS(–/–)Apoe(–/–) mice are ameliorated by enalapril treat-ment. J. Clin. Invest.105:451–458.
43. Luo, Z., et al. 2000. Acute modulation of endothelial Akt/PKB activity alters nitric oxide-dependent vasomotor activity in vivo. J. Clin. Invest.
106:493–499.
44. Babaev, V., et al. 1999. Macrophage lipoprotein lipase promotes foam cell formation and atherosclerosis in vivo. J. Clin. Invest. 103:1697–1705. 45. Babaev, V., Carter, K.J., Semenkovich, C.F., Fazio, S., and Linton, M.F. 2000.
Macrophage lipoprotein lipase promotes foam cell formation and ather-osclerosis in LDL receptor deficient mice.J. Biol. Chem.275:26293–26299. 46. Van Eck, M., Zimmermann, R., Groot, P.H.E., Zechner, R., and Van Berkel, T.J.C. 2000. Role of macrophage-derived lipoprotein lipase in lipoprotein metabolism and atherosclerosis. Arterioscler. Thromb. Vasc. Biol.20:e53–e62.
47. Gu, L., et al. 1998. Absence of monocyte chemoattractant protein-1 reduces atherosclerosis in low density lipoprotein receptor-deficient mice. Mol. Cell.2:275–281.
48. Lee, H., et al. 2000. Role for peroxisome proliferator-activated receptor alpha in oxidized phospholipid-induced synthesis of monocyte chemotac-tic protein-1 and interleukin-8 by endothelial cells. Circ. Res.15:516–521. 49. Djouadi, F., et al. 1998. A gender-related defect in lipid metabolism and glucose homeostasis in peroxisome proliferator-activated receptor α -deficient mice. J. Clin. Invest. 102:1083–1091.
50. Kersten, S., et al. 1999. Peroxisome proliferator-activated receptor α mediates the adaptive response to fasting. J. Clin. Invest. 103:1489–1498. 51. Foley, J.E. 1992. Rationale and application of fatty acid oxidation inhibitors in treatment of diabetes mellitus. Diabetes Care.15:773–784. 52. Williamson, J.R., Browning, T., and Scholz, R. 1969. Control mecha-nisms of gluconeogenesis and ketogenesis. I. Effects of oleate on gluco-neogenesis in perfused rat liver. J. Biol. Chem.244:4607–4616. 53. Gupte, S., Rupawalla, B.A., Phillibert, D., and Wolin, M.S. 1999.