International Research Journal of Engineering and Technology (IRJET)
e-ISSN: 2395 -0056Volume: 02 Issue: 04 | July-2015 www.irjet.net p-ISSN: 2395-0072
© 2015, IRJET.NET- All Rights Reserved
Page 745
Comparative Study of Page Loading Speed as Design Issue in Various
Websites
Vibhakar Mansotra
1, Jatinder Manhas
21
Professor, Computer Sciences & IT, University of Jammu, J&K, India
2Sr. Assistant Professor, Computer Sciences & IT, University of Jammu, J&K, India
---***---Abstract -
Websites are very important means ofcommunication in this current era of information technology. Different institutions / organizations put lot of efforts to portray complete information on beautifully designed websites. Dedicated efforts are required to provide users with all the facilities of the concerned institutions / organizations online through websites, which act as an online agent through which a user can get his work done without physically visiting the organizations. With this the responsibility of the designer and the concerned institutions / organizations increases manifold so that the websites behavior should remain interactive enough for the user to avail provided facilities of the website comfortably. Page loading speed of a website is one of the most important criteria which make users to access complete information from a given website with optimal internet connectivity. Author in this paper developed an online tool using .NET Framework using C# to study feedback facility as Design issue in various categories of the websites like Government, Commercial, Educational, Social networking and Job portals. The automated tool developed by author function on the basis of the different standards prescribed in W3C [2] and act like a parser which renders the complete code of a website and produces result by examining the page loading speeds of the websites over various modem speeds and their effects from the communication perspective between user and the web. The results produced shows that out of the five different categories of the websites employed for analysis the educational sites follow the maximum of standards as far as page loading speed parameter is concerned.
Key Words:
Websites, Design, page loading speed,
standards, .NET.
1. INTRODUCTION
International Research Journal of Engineering and Technology (IRJET)
e-ISSN: 2395 -0056Volume: 02 Issue: 04 | July-2015 www.irjet.net p-ISSN: 2395-0072
© 2015, IRJET.NET- All Rights Reserved
Page 746
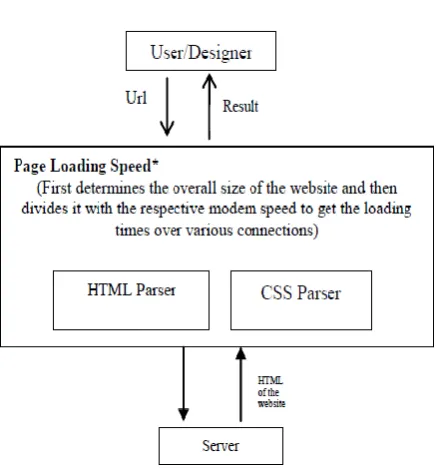
[image:2.595.54.274.104.339.2]Fig 1. Block Diagram of Page loading speed Parameter.
The parser will take URL of the website as input and then send it to the server and from the server HTML code of the website is supplied to the interface for making comparison with the existing standards.
The algorithm of the automated tool developed is given below:
Algorithm: For determining page loading speed of a website over different modem connections.
Input: URL of the website
Output: Page loading speed of a website (in sec.)
Method: (steps are numbered for better understandability)
Begin
Step I: Calculates the speed of the current connection by taking the average of the bytes received over a period of time.
Step II: Calculate the total size of the website by employing the algorithm 4 described above.
Step III: Obtain the loading speeds for a website over current connection and different modem speeds by dividing the total size by the respective connection speeds.
End
2. METHODOLOGY
2.1 Problem Identification
By page loading time we mean the time taken by a webpage to get completely loaded on to a web browser. Load speed optimization is an important factor in web page designing. In today’s fast paced mobile environment
no one wants to wait. Most potential customers do not want to wait for a seemingly endless page to load. Instead, they hit the browser ‘stop’ button and go elsewhere. Even though your website may be unique, you are not the only result when someone searches for your type of business. That being said, if your website takes too long to load, potential users will quickly move on to your competition. One of the research finding mention that website which has slow download time are less attractive compare than website with faster download time [1].There are several ways to fix your current site, but being conscious of page loading times during the website design process will save your headache in future.
Another factor is that search engines hate websites with heavy load times. Now a days search engines like Google are using page speeds in its search ranking algorithms [2].They know that if a person gets frustrated by high loading times, they are likely to leave the site very quickly. This exodus of visitors causes a site to have high bounce rate. A bounce rate is based on how quickly a visitor leaves a site once having arrived. If they detect a high bounce rate and slow page load speeds, they are likely to send users to another site. According to a survey conducted by Hamilton (1997)speed (i.e., slow speed) was the number one complaint of Web users (77%) [3]. By employing best practices during your website design process, you will ensure the best possible experience for your customer, and this will contribute to better page speed score. Fast loading times mean higher visitor engagement, visitor retention, and ultimately a higher conversion rate. These are all goals of any successful web development strategy.
Page loading speed is directly proportional to size of the web page [2]. As size increases the more time it takes to load a page. Another factor that shows up on the load time of a web page is the type of modem employed by the user.
2.2 Online tool for testing Websites
The tool Website Design Evaluator developed for the purpose to determine the deviations in the design issues among different categories of websites from the standards provided by the concerned organizations considered various features of the design parameters. For page loading time parameter the loading speeds of the websites were calculated with reference to the various types of modems employed by the user. A number of modems are currently available with different bit rates. The modem speeds that are considered by this tool to compute statistics regarding page loading time for websites are as under [4]:
International Research Journal of Engineering and Technology (IRJET)
e-ISSN: 2395 -0056Volume: 02 Issue: 04 | July-2015 www.irjet.net p-ISSN: 2395-0072
© 2015, IRJET.NET- All Rights Reserved
Page 747
In addition to the above, the modem speed and the loading time for the connection on which the user/designer will be operating on is also provided by this tool.
2.3 Sample Data
The Sample data taken in gathering statistics for the website size parameter is given in the Table 1 below. A
International Research Journal of Engineering and Technology (IRJET)
e-ISSN: 2395 -0056Volume: 02 Issue: 04 | July-2015 www.irjet.net p-ISSN: 2395-0072
© 2015, IRJET.NET- All Rights Reserved
Page 748
2.4 Results and Discussion
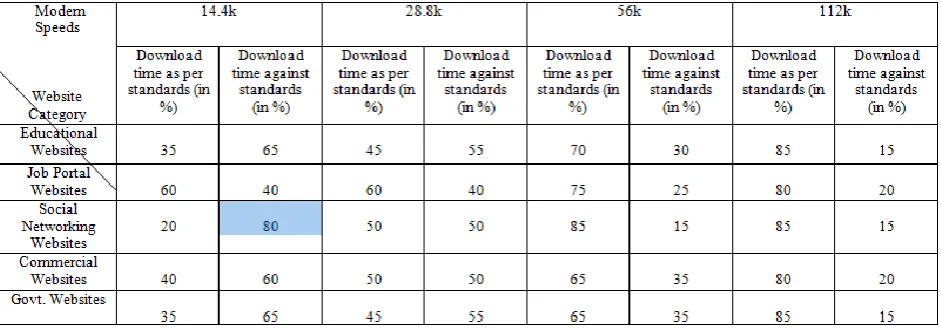
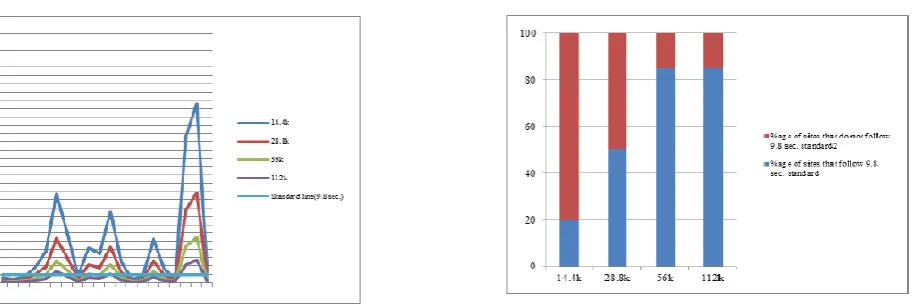
[image:4.595.63.534.433.598.2]The below given table 2 shows percentage of websites following different standards while running various categories of the websites on different modems and “Fig. 3,” to “Fig. 7,” shows the download time in different modem speeds. Based on the analysis from the below graph the sites with maximum time to load on all types of modems used during analysis are social networking sites and the sites which take minimum time to load on all types of modems are educational sites which means that out of the five different categories of websites employed for analysis the educational sites follow the maximum of standards as far as page loading speed parameter is concerned prescribed in W3C and as prescribed in analysis performed in [2].
International Research Journal of Engineering and Technology (IRJET)
e-ISSN: 2395 -0056Volume: 02 Issue: 04 | July-2015 www.irjet.net p-ISSN: 2395-0072
[image:5.595.61.537.145.526.2]© 2015, IRJET.NET- All Rights Reserved
Page 749
[image:5.595.68.537.575.763.2]International Research Journal of Engineering and Technology (IRJET)
e-ISSN: 2395 -0056Volume: 02 Issue: 04 | July-2015 www.irjet.net p-ISSN: 2395-0072
[image:6.595.69.267.161.310.2]© 2015, IRJET.NET- All Rights Reserved
Page 750
[image:6.595.311.533.196.551.2]Fig. 6. Download time against standards (in %) using 112k modem.
Fig.7. Graphical analysis for page loading speed.
Analysis based on different categories of websites separately for Page Loading Speed parameter: Statistics taken from Website Design Evaluator for Page Loading Speed parameter for different categories of websites taken from Sample Data is given below in table 3.
Government websites
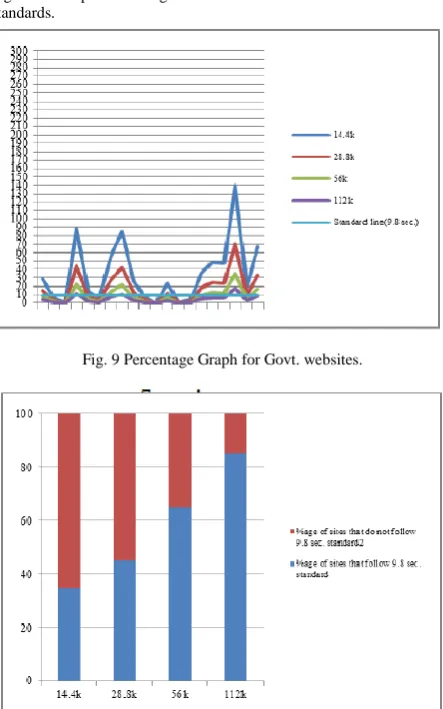
The testing of all the govt. sites was done by using the website design evaluator tool which was developed to calculate the page loading time of websites on various types of commonly used modem speeds and results are shown in “Fig. 8,” and “Fig. 9,”. It has been observed that on average 58.75 percent of govt. sites
are with less than or equal to 9.8 seconds load time which means rest all does not follow the standard of having a page loading time less than or equal to the recommended[2]loading time of 9.8 seconds.
Fig 8. Graph showing deviation of Govt. sites from the standards.
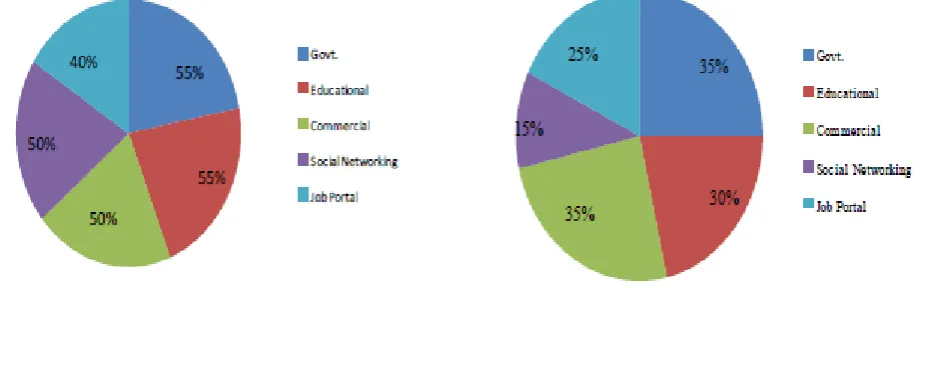
Fig. 9 Percentage Graph for Govt. websites.
Educational websites
[image:6.595.60.285.359.541.2]International Research Journal of Engineering and Technology (IRJET)
e-ISSN: 2395 -0056Volume: 02 Issue: 04 | July-2015 www.irjet.net p-ISSN: 2395-0072
[image:7.595.300.555.60.235.2]© 2015, IRJET.NET- All Rights Reserved
Page 751
[image:7.595.35.280.89.411.2]Fig. 10 Graph showing deviation of Educational sites from the standards.
Fig. 11 Percentage Graph for Educational websites.
Commercial websites
The testing of all the commercial sites was done by using the website design evaluator tool which was developed to calculate the page loading time of websites on various types of commonly used modem speeds and results are shown in “Fig. 12,” and “Fig. 13”. It has been observed that on average 58.75 percent of commercial sites are with less than or equal to 9.8 seconds load time which means rest all does not follow the standard of having a page loading time less than or equal to the recommended[2]loading time of 9.8 seconds.
Fig. 12 Graph showing deviation of Commercial sites from the standards.
Fig. 13 Percentage Graph for Commercial websites.
Social Networking websites
The testing of all the social networking sites was done by using the website design evaluator tool which was developed to calculate the page loading time of websites on various types of commonly used modem speeds and results are shown in “Fig. 14,” and “Fig. 15”. It has been observed that on average 60 percent of social networking sites are with less than or equal to 9.8 seconds load time which means rest all does not follow the standard of having a page loading time less than or equal to the recommended[2]loading time of 9.8 seconds.
Fig. 14 Graph showing deviation of Social Networking sites from the standards.
[image:7.595.37.264.125.277.2] [image:7.595.311.524.443.576.2] [image:7.595.56.513.601.753.2]International Research Journal of Engineering and Technology (IRJET)
e-ISSN: 2395 -0056Volume: 02 Issue: 04 | July-2015 www.irjet.net p-ISSN: 2395-0072
© 2015, IRJET.NET- All Rights Reserved
Page 752
Job Portal websites
[image:8.595.36.271.287.640.2]The testing of all the job portal sites was done by using the website design evaluator tool which was developed to calculate the page loading time of websites on various types of commonly used modem speeds and results are shown in “Fig. 16,” and “Fig. 17”. It has been observed that on average 68.75 percent of job portal sites are with less than or equal to 9.8 seconds load time which means rest all does not follow the standard of having a page loading time less than or equal to the recommended [2]loading time of 9.8 seconds.
Fig. 16 Graph showing deviation of Job Portal sites from the standards.
Fig. 17 Percentage Graph for Job Portal websites.
3. LIMITATIONS
There are various ways through which presence of feedback within a website can be determined. Although the method used in Website Design Evaluator provides statistics regarding feedback up to exact levels but the method involved may fail at instances. Almost all website designers provide feedback via an anchor tag but certain designers though very few include feedback within the design inside the xml of the website. Website Design
Evaluator determines the feedback within the websites by parsing anchor tag but it fails to find out when designer has provided it within xml during the design. In websites where feedback is included inside xml the tool is not able to determine its existence and hence provides incorrect statistics regarding them for this parameter.
4. FUTURE SCOPE
In future more detailed study of this parameter can help in bring out the features that have been over sighted due to their negligible effects on this parameter and will be taken into consideration. Provisions for the factors that are either external or internal to the parameter will be considered to make their inclusion into this parameter in order to make this tool a solution for maximum number of webpage design issues related to page loading speed problem and to provide statistics that are more accurate and will help the designers to find out the deviations in the page loading speeds of websites from the standards provided by concerned organizations and hence create page that are more efficient and user centric.
5. CONCLUSION
It is clear from the above statistics and analysis more effort is required to meet with these criteria in the context of website design as far as page loading speed is concerned. Very small percentage of websites among the website categories considered for evaluation are having page loading times that are up to required mark. In the recent time the average time of the connection speed is 5Kbps (kilobytes per second). This facts give an implication that one web page with 40Kb page size will be downloaded during 8 second. This matter in accordance with the 'eight second rule', this 8 second is a normal time for loading webpage and will not be tolerable from the user. This result are supported by many research result mentioned that mean of tolerable download time in the user side is 8.57 with standard deviation 5.9 second [5].
Hence it can be concluded that to gain better performance and user count it is necessary that page loading time of the websites be restricted to the tolerable figures as it is one of the important performance factor for websites. . It is clear that more efforts are required to meet with the criteria in context of webpage loading speeds for websites provided by concerned institutions/organizations.
Acknowledgment
[image:8.595.37.268.287.427.2]International Research Journal of Engineering and Technology (IRJET)
e-ISSN: 2395 -0056Volume: 02 Issue: 04 | July-2015 www.irjet.net p-ISSN: 2395-0072
© 2015, IRJET.NET- All Rights Reserved
Page 753
A special thanks to the world wide web consortium for providing such a beautiful design standards so that websites can be designed in a given set parameters to make website behaviors uniform for all types of different categories of the users.
REFERENCES
[1] HandaruJati, Dhanapal Durai Dominic, Quality Evaluation of E-Government Website Using Web Diagnostic Tools: Asian Case, International Conference on Information Management and Engineering 2009.
[2] www.addedbyte.com.
[3] Dave Gehrke, Efraim Turban, Determinants of Successful Website Design: Relative Importance and Recommendations for Effectiveness, 32nd Hawaii International Conference on System Sciences – 1999. [4] www.websiteoptimization.com/services/analyze. [5] Bouch, A., Kuchnisky, A., Bhatti, N. .Qualityis in the