© 2016, IRJET | Impact Factor value: 4.45 | ISO 9001:2008 Certified Journal
| Page 1456
Detection of suspicious lesion based on Multiresolution Analysis using
windowing and adaptive thresholding method.
Ms. N. S. Pande
Assistant Professor, Department of Computer Science and Engineering ,MGM’s COE, Nanded
---***---Abstract -
Mammography is a method to examine breast and is used as a tool to diagnosis breast cancer. In this paper an algorithm that first detects the type of lesion that mammogram contains and then it operates on multiresolution images of the original mammogram by using adaptive global thresholding and adaptive local thresholding segmentation by applying adaptive windowing is developed. The algorithm has tested 170 mammogramsfrom Mammographic Image Analysis Society
MiniMammographic database.
Key Words: Adaptive thresholding; breast cancer; computer- aided detection; mammography; NSCT; segmentation.
1.
INTRODUCTION
The most common and most hazardous disease amongst women found around the world is breast cancer. The world health organization’s International Agency for Research on cancer (IARC) has estimated that due to breast cancer more than 40,000 women expire each year [1]. The amount of breast cancer is increasing all around the world and to cure this disease it is necessary for the early diagnosis of the breast cancer.
For the detection of breast cancer mammography is a very effective technique. In mammography, mammograms are developed which can be called as X-ray of the breast. But detection of suspicious lesion just by observing the mammograms is a difficult task for doctors because at a very early stage the appearance of cancer in a mammogram is very subtle and unstable [2]. To avoid any mistake doctors’ now-a-days use a very easy method called as computer aided detection.
In computer aided detection method the computer works on a predefined algorithm that basically works with two steps one is segmentation and second is removal of false positive and then the tumor is detected as final results.
A tumor can be classified into two types one is benign and other is malignant. Benign tumor is a mass of cells that lacks the ability to affect the neighboring cells and tissues. This is a major property of a cancerous cell thus benign tumors are cancerous cells. But in spite of being non-cancerous still some benign tumors can have a negative effect. Malignant tumors are the masses that carry a property to potentially grow in size i.e. these cells can harm the neighboring cells easily and can have a serious effect on the patient which can even lead to death.
The detection of tumor is not a very easy task because of the dense breast tissues. Thus, various different techniques are used amongst which one is the use of Wavelet transform. Wavelet-transform-based method offers a natural framework for multiscale image representation that can be separately analyzed [2], [3], [4]. Zhang and Desai [3] proposed a histogram based adaptive thresholding method that used first a 2D undecimated wavelet transform of an image at 4-5 scales then took its histogram which was considered as the probability density function of an image and then one scale was selected on which 1D undecimated wavelet transform is implemented and again 4-5 scales are obtain amongst which the largest local minima is calculated and is considered as a threshold for image segmentation. This method is very fast and simple but the method is not effective when the difference between the target and the background area is very less. The problem with mammographic masses is that they are overlapped with dense tissues which have a higher density than the masses thus it is difficult to directly segment the mammogram with accuracy.
Kom et al. [4] proposed a new approach called as window based adaptive thresholding. In this method, mammograms undergo various pre-processing stages and then two windows one small and one large window are selected. On the basis of windowing method the mammogram is processed and a threshold value is calculated adaptively. Segmentation is carried out based on the calculated threshold value. This algorithm works best for segmentation in local area but it does not considers the small window. The center area is of the lesion is not segmented.
© 2016, IRJET | Impact Factor value: 4.45 | ISO 9001:2008 Certified Journal
| Page 1457
further detect the actual lesion from the dense breasttissue by combining the greylevel feature and shape feature of the lesion. The global and local thresholds required for the detection will be selected adaptively by this algorithm because of which the chances of incorrect results will be reduced. We have used the mammograms obtained from Mammographic Image Analysis Society (MIAS) Mini Mammographic database to test the proposed algorithm. The result of this algorithm shows that this algorithm works effectively for feature extraction, classification, segmentation and detection techniques. The organization of the paper is as follows. Section II is a brief review of the histogram based adaptive thresholding, window based adaptive thresholding and adaptive thresholding based on multiresolution analysis. Section III gives a detail description of the proposed algorithm. In Section IV the experimental results are discussed and Section V concludes the work.
2.
LITERATURE REVIEW
2.1 Histogram based adaptive thresholding and window based adaptive thresholding.
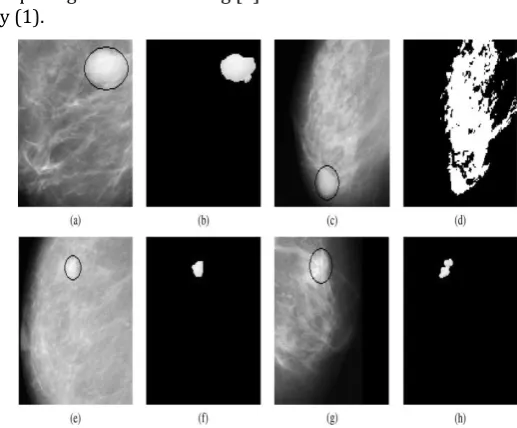
The adaptive global analysis [3] is proved to be a very efficient way of segmentation but in this method the threshold that is selected for the segmentation is based on histogram and can be called as global threshold. This global threshold can easily segment the masses that have a global superiority of grey-levels in the complete image and can easily segment them and declare them as suspicious area. But mammographic masses are surrounded by dense breast tissues.
Thus, it is difficult to segment mammogram and the chances of wrong segmentation are high. The example of such erroneous segmentation is shown above in Fig. 1(c) and 1(d).
According to Kom et al. [4] in adaptive local thresholding windowing techniques are used. Based on the windowing values a threshold is calculated which is used for segmentation. But this method calculates the threshold in the neighborhood of the pixels and if the neighboring normal pixel has a greater superiority than the base pixel then it is also segmented as a suspicious lesion as shown in Fig. 2(g) and 2(h).
2.2 Detection Algorithm of Suspicious Lesions by Adaptive Thresholding Based on Multiresolution Analysis
To overcome the drawbacks of adaptive local [3] and adaptive global thresholding [5] Hu, Gao and Li proposed a method that calculates the wavelet transform of the original image I₀ twice to obtain two different multiresolution sub images I and I . Image I is again applied with some morphological filter enhancement [5] and image M is obtained whereas Image I undergoes
adaptive global thresholding [3] and a threshold is selected by (1).
Fig.1. Adaptive global thresholding. Original images [(a), (c), (e), (g)] of mdb025, mdb021, mdb155, mdb264 in mini-MIAS, respectively. Circled region contains lesion, [(b), (d), (f), (h)] segmented images of mdb025, mdb021, mdb155, mdb264, respectively.
(1)
The segmentation of the image I₁ takes place by the equation (2) and B is obtained.
(2)
Image B is mapped to higher resolution by equation (3) and is obtained.
(3)
After mapping the image, convolution of image M and B₁ is to be performed as shown in equation (4).
[image:2.595.314.573.109.323.2]© 2016, IRJET | Impact Factor value: 4.45 | ISO 9001:2008 Certified Journal
| Page 1458
Fig.2. Adaptive local thresholding. Original images [(a),(c), (e), (g)] of mdb025, mdb021, mdb155, mdb264 in mini-MIAS, respectively. Circled region contains lesion, [(b), (d), (f), (h)] segmented images of mdb025, mdb021, mdb155, mdb264, respectively.
After obtaining the value of A₁, the method of adaptive local thresholding is applied. A value for small window ranging from 5 5 pixels to 15 15 pixels is selected and for large window a value within the range of 128 128 pixels and 256 256 pixels is selected. For each pixel in the breast a threshold is calculated as follows.
If MvoisiP > α.SIdif and (|MvoisiP – SI(i,j) |/Mvoisip) < 1-α, then SI(i,j) is likely to be a pixel in potential suspicious mass and TH(i,j) is calculated as
(5)
else
(6)
Where,
α
and
γ
are thresholding bias coefficients,and
their values range is from zero to one. In particular,
α
is the key parameter. We use it as the decision
threshold to get the free-response ROC (FROC) curve
to analyze the experimental results. After many tests,
γ
value is
chosen empirically and we obtain good
result with
γ
= 0
.
5. The fine segmentation is a local
segmentation since the threshold is just for each
pixel
SI
(
i, j
) [4]. The experimental results show that,
through the fine segmentation, we get more precise
segmentation results of suspicious lesion
But the major problem with this approach is that
the window size is not accurate and it changes for
each image and thus to select both the window sizes,
trial and error based method is to be applied and
thus it can happen that the result obtain by one
window size can be inappropriate but we have
considered it as appropriate and thus the chances of
mistake is more.
3.
DETECTION METHOD
3.1. Image Preprocessing
In classification, first the mammogram is to be judged as a cancerous tumor containing mammogram or a normal mammogram. If the mammogram is cancerous then the tumor is classified as malignant or benign.
For this classification the mammogram first has to undergo pre-processing stage. The pre-processing stage is necessary for the suppression of undesired distortion and enhancement of image features. Every mammogram contains some extra background information and the noise. Thus to eliminate this only the Region of Interest (ROI) of 800 800 is selected from the center of the image. The grey level thresholding is applied to ROI and the upper threshold and lower threshold are set to 260 and 140 respectively. To improve contrast in the mammogram adaptive histogram equalization is applied and thus the pre-processing stage is completed. The Pre-processing stage is as shown in figure 3.
Fig.3. Pre- processing stage
INPUT IMAGE
ROI SELECTION
GLOBAL
THRESHOLDIND
© 2016, IRJET | Impact Factor value: 4.45 | ISO 9001:2008 Certified Journal
| Page 1459
3.2.
Image segmentation by Adaptive
thresholding and Adaptive windowing
After classification stage, the original pre-processed image undergoes two times Daubechies wavelet (DB10) and low frequency sub images at different resolutions are obtained [2]. The method of histogram based adaptive thresholding and Windows based adaptive thresholding is applied on the multiresolution sub images [2]. But the main drawback of the method in [2] was that the window size was to be mentioned by the user and selection of window manually was very erroneous method. Thus by the proposed method this possibility of errors is eliminated because here we undergo an adaptive windowing method.
For adaptive windowing first the initial size of the small window is selected as 5 5 and large window is selected as
128 128. Then by calculating mean of small window the value for MvoisiP is obtained. The SImin and SImax i.e. minimum and maximum pixel value is calculated from the large window and by taking the difference of these two values SIdif is obtained.
(7)
The value for threshold is calculated for each pixel by equation (5) and (6). After threshold selection is completed the segmentation stage is to be carried out.
For the process of segmentation each pixel has to satisfy the condition that if pixel value of image I i.e. I(i,j ) ≥
TH(i,j) && SIdif ≥ MvoisiP then pixel I(i,j) belongs to suspicious area else both the window sizes are to be incremented by one. Again the values for MvoisiP ,SIdif and thresholds are calculated and again the segmentation is performed by equation (8). After segmentation the obtained image consists of the entire suspicious area pixels as 1 and remaining pixels as 0.
(8)
4.
EXPERIMENTAL RESULTS
The data used in our experiment is obtained from mini MIAS database of mammographic image society [6]. All the images are digitized at resolution of 1024 1024 pixels and 8-bit accuracy (gray level). The proposed algorithm was implemented in MATLAB environment on a PC (Intel CORE i3, 2.3 GHz CPU and 2GB RAM).
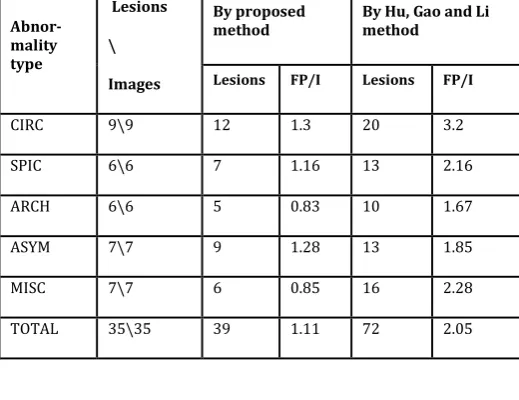
The processes has been verified on total 80 images amongst which 45 mammograms were classified as normal, 35 abnormal images with 35 lesions in total. In these 35 images 9 were circular lesions, 6 were speculated lesions, 6 architectural images, 7 asymmetrical images and 7 miscellaneous images. As shown in the table I and II.
Abnor-mality type
Lesions \ Images
By proposed
method By Hu, Gao and Li method
Lesions FP/I Lesions FP/I
CIRC 9\9 12 1.3 20 3.2
SPIC 6\6 7 1.16 13 2.16
ARCH 6\6 5 0.83 10 1.67
ASYM 7\7 9 1.28 13 1.85
MISC 7\7 6 0.85 16 2.28
[image:4.595.308.568.102.302.2]TOTAL 35\35 39 1.11 72 2.05
TABLE I : COMPARISON BETWEEN PROPOSED METHOD AND HU, GAO AND LI METHOD BASED ON
[image:4.595.321.564.310.459.2]DETECTION RESULTS AND FP/I.
Fig.5.Detection steps.
Taking into account that Hu, Gao and Li method [2] used the same database and same mammograms the comparison between these two methods elaborates that the false positive per image (FP/I) for CIRC lesion mammograms by Hu, Gao and Li method is 3.2 where as by proposed method is 1.3, for SPIC lesion mammograms by Hu, Gao and Li method is 2.16 where as by proposed method is 1.16, for ARCH lesion mammograms by Hu, Gao and Li method is 1.67 where as by proposed method is 0.83, for ASYM lesion mammograms by Hu, Gao and Li method is 1.85 where as by proposed method is 1.28 and for MISC lesion mammograms by Hu, Gao and Li method is 2.28 where as by proposed method is 0.85. And results for [4] and such other references cannot be obtained because the image database used in this method is different.
© 2016, IRJET | Impact Factor value: 4.45 | ISO 9001:2008 Certified Journal
| Page 1460
CONCLUSION
The proposed method first classifies the given mammogram into normal or abnormal mammogram and if found abnormal then it again classifies the tumor as benign or malignant based on the feature extraction method. Then with the use of wavelet transform multiresolution sub images are obtained. These sub images undergo adaptive local and adaptive global thresholding. In adaptive global thresholding the threshold is selected by observing the global local minimum point and in adaptive local thresholding the window sizes are chosen adaptively and pixel by pixel threshold is calculated. Thus from the experimental results it is clearly observed that the results of the proposed method has a very low false positive rate as compared to other method.
Further the method can be improved to be applicable for microcalcifying lesions also.
References
[1] N.R. Pal, B. Bhowmik, S. K. Patel, S. Pal,’’A Multistage neural network aided system for detection of microcalcification in digital mammograms”, Nero computinf 71(2008), 2625- 2634
[2] Kai Hu, Xieping Gao, Fei Li,“Detection of Suspicious lesions by adaptive thresholding Based on Multiresolution analysis in Mammograms”, IEEE Trans. Instru. & mearurement, vol 60, No. 2, feb 2011
[3] X. P. Zhang and M. D. Desai,”Segmentation of bright targets using wavelets and adaptive thresholding,” IEEE Trans.Image Process. , vol. 60, No. 2, feb 2011.
[4] G. Kom, A. Tiedeu, and M. Kom, “Automated detection of masses in mammograms by local adaptive thresholding,” Comput. Biol. Med., vol. 37, no. 1, pp. 37–48, Jan. 2007.
[5] H. Li, Y. Wang, K. J. Ray Liu, S.-C. B. Lo, and M. T. Freedman, “Computerized radiographic mass detection— Part I: Lesion site selection by morphological enhancement and contextual segmentation,” IEEE Trans. Med. Imag., vol. 20, no. 4, pp. 289–301, Apr. 2001.