Deposited research article
Evidence of functional selection pressure for alternative splicing
events that accelerate evolution of protein subsequences
Yi Xing and Christopher Lee
Address: Molecular Biology Institute, Center for Genomics and Proteomics, Dept. of Chemistry and Biochemistry, University of California, Los Angeles, Los Angeles, CA 90095-1570, USA.
Correspondence: Christopher Lee. E-mail: [email protected]
comment
reviews
reports
deposited research
interactions
information
refereed research
.deposited research
AS A SERVICE TO THE RESEARCH COMMUNITY, GENOME BIOLOGY PROVIDES A 'PREPRINT' DEPOSITORY TO WHICH ANY ORIGINAL RESEARCH CAN BE SUBMITTED AND WHICH ALL INDIVIDUALS CAN ACCESS FREE OF CHARGE. ANY ARTICLE CAN BE SUBMITTED BY AUTHORS, WHO HAVE SOLE RESPONSIBILITY FOR THE ARTICLE'S CONTENT. THE ONLY SCREENING IS TO ENSURE RELEVANCE OF THE PREPRINT TO
GENOME BIOLOGY'S SCOPE AND TO AVOID ABUSIVE, LIBELLOUS OR INDECENT ARTICLES. ARTICLES IN THIS SECTION OF THE JOURNAL HAVE NOTBEEN PEER-REVIEWED. EACH PREPRINT HAS A PERMANENT URL, BY WHICH IT CAN BE CITED. RESEARCH SUBMITTED TO THE PREPRINT DEPOSITORY MAY BE SIMULTANEOUSLY OR SUBSEQUENTLY SUBMITTED TO GENOME BIOLOGY OR ANY OTHER PUBLICATION FOR PEER REVIEW; THE ONLY REQUIREMENT IS AN EXPLICIT CITATION OF, AND LINK TO, THE PREPRINT IN ANY VERSION OF THE ARTICLE THAT IS EVENTUALLY PUBLISHED. IF POSSIBLE, GENOME
BIOLOGYWILL PROVIDE A RECIPROCAL LINK FROM THE PREPRINT TO THE PUBLISHED ARTICLE. Posted: 11 April 2005
GenomeBiology2005, 6:P8
The electronic version of this article is the complete one and can be found online at http://genomebiology.com/2005/6/5/P8
© 2005 BioMed Central Ltd
Received: 6 April 2005
This is the first version of this article to be made available publicly and no other version is available at present.
Evidence of Functional Selection Pressure for
Alternative Splicing Events that Accelerate
Evolution of Protein Subsequences
Yi Xing, Christopher Lee Molecular Biology Institute
Center for Genomics and Proteomics Dept. of Chemistry & Biochemistry University of California, Los Angeles Los Angeles, CA 90095-1570
EMAIL: [email protected]
TEL: 310-825-7374 FAX: 310-206-7286
Draft 13
Abstract
Recently, it was proposed that alternative splicing may act as a mechanism for opening
accelerated paths of evolution, by reducing negative selection pressure, but there has been
little evidence so far whether this could produce adaptive benefit. Here we employ
metrics of very different types of selection pressures (e.g. against amino acid mutations
(Ka/Ks); against mutations at synonymous sites (Ks); and for protein reading-frame
preservation) to address this question via genome-wide analyses of human, chimpanzee,
mouse, and rat. These data show that alternative splicing relaxes Ka/Ks selection
pressure up to seven-fold, but intriguingly that this effect is accompanied by a strong
increase in selection pressure against synonymous mutations, which propagates into the
adjacent intron, and correlates strongly with the alternative splicing level observed for
each exon. These effects are highly local to the alternatively spliced exon. Comparisons
of these four genomes consistently show an increase in the density of amino acid
mutations (Ka) in alternatively spliced exons, and a decrease in the density of
synonymous mutations (Ks). This selection pressure against synonymous mutations in
alternatively spliced exons was accompanied in all four genomes by a striking increase in
selection pressure for protein reading-frame preservation, and both increased markedly
with increasing evolutionary age. Restricting our analysis to a subset of exons with
strong evidence for biologically functional alternative splicing produced identical results.
Thus alternative splicing apparently can create evolutionary “hotspots” within a protein
Introduction
Alternative splicing has recently emerged as a major mechanism of functional
regulation in the human genome and in other organisms (1-3), with up to 80% of human
genes reported to be alternatively spliced (4). One question that has attracted much
interest is comparing alternative splicing in different genomes. Several groups have
sought to assess whether alternative splicing is more abundant in the human genome vs.
other genomes (5-7). Another major focus has been to use sequence conservation
(regions of high percent identity) to discover motifs that are important for regulation and
alternative splicing (8-11). These data indicate that such regulatory motifs are clustered
near splice sites, in both exonic sequence and the flanking introns. For example,
measurements of conservation by percent identity between human and mouse show an
approximately 20% increase in the 30nt of intron sequence immediately adjacent to
alternatively spliced exons, relative to that for constitutive exons (8). The sequence of
alternatively spliced exons also appears to have slightly higher conservation than
constitutive exons, perhaps by a few percentage points of identity in comparisons of
human vs. mouse (11).
It has also been proposed that alternative splicing can greatly increase the rate of
certain types of evolutionary alterations, such as exon creation, by reducing negative
selection pressure against such events (12-14). Evidence from many groups have shown
associations between alternative splicing and increases in different types of evolutionary
change, including exon duplication (15, 16);Alu element-mediated exonization (17);
exon creation / loss (13, 18); and introduction of premature protein termination codons
conservation during genome evolution. These lines of evidence suggest that alternative
splicing has played a significant role during mammalian evolution, by opening neutral
pathways for more rapid evolutionary change. However, at least superficially, these data
would appear to be inconsistent with reports that alternative splicing is associated with
increased levels of conservation (8, 11).
These data raise several questions about the role of alternative splicing in evolution.
First, is the hypothesis that alternative splicing reduces negative selection pressure a
general phenomenon? For example, does it hold true even for alternatively spliced exons
that are clearly functional, or is it limited to alternatively spliced exons that have no
biological function? Several groups have presented evidence for a stringent criterion that
an alternative splicing event is functional, based on independent observations of that
specific alternative splicing event in two different organisms (e.g. human and mouse)
(20-22). For this dataset, evolutionary processes measured over this period have
genuinely taken place under the influence of alternative splicing, and should reflect its
effects. We have therefore performed a genome-wide analysis of exons observed to be
alternatively spliced in both human and mouse transcripts, which we will refer to as
‘ancestral alternative exons’.
Second, if alternative splicing does reduce selection pressure in a general way, is
there any evidence that this phenomenon is adaptive, i.e. that such events have been
selected for during evolution? Questions such as these require a transition from a single
metric of evolutionary change (such as percent identity), to multiple metrics that can
distinguish different types of selection pressure, e.g. selection pressure against amino acid
that disrupt important nucleotide motifs (e.g. binding sites for splicing factors), etc. We
have therefore analyzed the well-known selection pressure metrics Ka/Ks and Ks, which
give empirical measures of these two selection pressures (23, 24). Non-synonymous
nucleotide sites experience the background nucleotide mutation level (whose density is
symbolized by π), nucleotide selection pressure (which we will symbolize as ρ), and
amino acid selection pressure (ω), while synonymous sites experience only the first two
factors. Thus, in the standard formulation of Ka/Ks, the densities of observed mutations
at non-synonymous sites (Ka), and synonymous sites (Ks) are
Eq. 1 Ka=ωρπ
Ks=ρπ
and Ka/Ks=ω, with no dependence on π or ρ (23). Ka/Ks has been very widely used,
because the normalization by Ks yields a metric of amino acid selection pressure that is
independent of π (which varies enormously according to the total time of evolutionary
divergence between a pair of genomes (25)). A Ka/Ks ratio of 1 indicates neutral
evolution (absence of selection pressure); by contrast, in most protein coding regions
Ka/Ks is significantly less than 1, indicating strong negative selection pressure against
amino acid mutations (26).
In this paper, we analyze Ka and Ks both for ancestral alternative exons that have
strong evidence of functional alternative splicing, and in genome-wide comparisons of
four mammalian genomes (human, chimpanzee, rat, and mouse), to evaluate how
alternative splicing affected selection pressure over different evolutionary timescales. We
fraction of a gene’s transcripts that include an exon rather than skipping it (13) – and
measure its impact on Ka and Ks selection pressures.
Methods
Alternative splicing analysis
We detected alternative splice forms in human and mouse by mapping mRNA and
ESTs onto genomic sequences as previously described (27) using the following data: (i)
UniGene EST data (28) from June 2003 for human and mouse
(ftp://ftp.ncbi.nih.gov/repository/UniGene) (ii) genomic sequence data from June 2003
for human and mouse (ftp://ftp.ensembl.org/pub/current_human and
ftp://ftp.ensembl.org/pub/current_mouse). Internal exons were identified as genomic
regions flanked by two splices, and all exon boundaries were confirmed by checking
consensus splice site motifs. We computed exon inclusion level for each alternatively
spliced exon, defined as the number of ESTs that included an exon divided by total
number of ESTs that either included or skipped this exon. Based on this ratio, we
grouped alternatively spliced exons into three classes: major-form (inclusion level above
2/3), medium-form (inclusion level between 1/3 and 2/3) and minor-form (inclusion level
below 1/3).
We identified orthologous human-mouse exons as previously described (13), using
orthologous gene information from HOMOLOGENE (29)
(ftp://ftp.ncbi.nih.gov/pub/HomoloGene/ July2003), including all orthologous pairs of
genes that were successfully mapped onto genomic sequences during our splicing
calculation. We defined a pair of human-mouse orthologous exons as ‘ancestral
transcripts. Similarly we defined a pair of human-mouse orthologous exons as ‘ancestral
constitutive exons’ if the exon was constitutively spliced in both organisms. Our dataset
included 132 orthologous exon pairs in the ancestral alternative exon set, and 10190 pairs
in the constitutive set.
Ka/Ks and Ks sequence divergence metrics
We computed the Ks rate and Ka/Ks ratio between orthologous exon pairs following
the approach of Li and colleagues (30). Briefly, orthologous exon sequences from human
and mouse were both translated in all possible reading frames. Translations containing
STOP codons were removed and the remaining protein sequences were aligned in all
possible combinations. We computed sequence identities in all resulting alignments
using the global sequence alignment program needle in EMBOSS software package (31).
After excluding alignments between human and mouse protein sequences that were
translated from different reading frames (indicated by a cut-off of 50% protein sequence
identity), we selected the reading frame pair with the highest amino acid identity, and
then aligned these two protein sequences using CLUSTALW (32) under default
parameters. This protein alignment was used to re-align corresponding nucleotide
sequences, and gaps in the alignment were trimmed. We estimated the Ks rate and Ka/Ks
ratio from the codon-based nucleotide sequence alignment using both the Nei-Gojobori
method and Yang-Nielsen method, implemented in the yn00 program of PAML package
(33). These two methods yielded similar results. For each group of exons (constitutive,
major-form, medium-form, minor-form), we calculated its mean Ka and Ka/Ks, and
For each pair of orthologous exons, we aligned the entire exons as well as 250bp
upstream and downstream intronic sequences, using the program needle in EMBOSS
software package (31). We computed the observed nucleotide substitution density
(number of observed substitutions per site) in the alignment.
Genome-wide analyses of conserved constitutive and alternative exons in human,
chimpanzee, mouse and rat
We calculated Ka, Ks and Ka/Ks for constitutive and alternative exons conserved
between the genomic sequences of human and chimpanzee, or mouse and rat, or human
and mouse. The exon inclusion level was estimated based on human EST data (for human
vs. chimpanzee analysis, and human vs. mouse), or based on mouse EST data (mouse vs.
rat). We estimated Ka and Ks for each pair of orthologous exons between human and
mouse using the Yang-Nielsen method as described above, summing up the total number
of synonymous and nonsynonymous substitutions/sites for each group of exons
(constitutive, major-form, medium-form, minor-form). For human vs. chimpanzee, we
searched the entire chimpanzee genome (ftp://ftp.ensembl.org/pub/current_chimp
May2004) with each human exon, using BLASTN (34), requiring an expectation score of
10-4 or less, and a match-length within at least 12nt of the human exon’s length. Using
the best hit from the chimpanzee genome, we identified the best reading frame pair as
above, requiring 80% protein sequence identity. For mouse vs. rat, we searched the rat
genome (ftp://ftp.ensembl.org/pub/current_rat July2004), for each mouse exon, and
Frame preservation analysis
We defined an exon as “frame-preserving” if the length of the exon was a multiple of
3nt, and as “frame-switching” if not (35). Inclusion or exclusion of a “frame-preserving”
exon by alternative splicing leaves the downstream protein reading frame unchanged; for
this reason, frame-preservation has been proposed by several groups as evidence that an
alternative splicing event is functional (21, 35-37). We calculated the frame preservation
ratio for a given set of exons as the number of “frame-preserving” exons divided by the
number of “frame-switching” exons (35).
Results
Ka/Ks analysis: To understand in detail how alternative splicing affects selection
pressure, we performed a genome-wide analysis of exons observed to be alternatively
spliced in both human and mouse transcripts. Our results showed that ancestral
alternative exons had much higher Ka/Ks values compared to ancestral constitutive
exons. The average Ka/Ks estimated from the Yang-Nielsen method for the set of 132
ancestral alternative exons was 0.394, significantly higher than the average for the set of
10190 ancestral constitutive exons (0.114, P= 6.6x10⁻¹¹). The Nei-Gojobori method
yielded similar results.
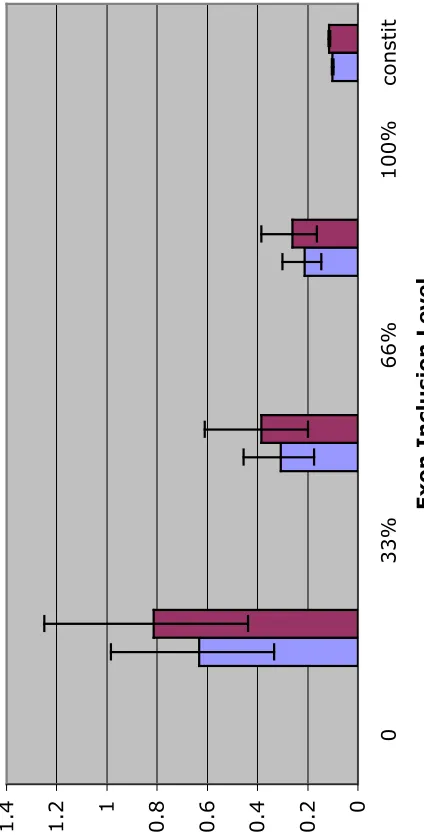
To make our analysis more quantitative, we used a standard metric for alternative
splicing — exon inclusion level (13, 38), defined as the number of transcripts observed to
include the exon, divided by total number of transcripts that either include or skip it. We
categorized ancestral alternative exons into three groups based on this ratio measured
from human transcript data. We found a striking negative correlation between the exon
2/3, defined as major-form exons) had a low Ka/Ks ratio (0.262), while exons with low
inclusion levels (θ < 1/3, defined as minor-form exons) had a Ka/Ks ratio (0.814) more
than 7-fold higher than constitutive exons. The difference in Ka/Ks ratio between
major-form and minor-major-form exons was statistically significant (P=0.0015). Thus, alternative
splicing appears to relax negative selection against amino acid changes, even when there
is strong evidence that these alternative splicing events are functional (they were
observed in both mouse and human transcripts). Moreover, the degree of relaxation
depends quantitatively on the amount of alternative splicing in these exons.
Ks analysis: The Ka/Ks metric divides the observed density of amino acid substitutions
(Ka) against the observed density of synonymous nucleotide substitutions (Ks). In
mammals, it has generally been assumed that synonymous substitutions are selectively
neutral (39), i.e. that Ks simply reflects the background mutation rate of a gene.
Consistent with this view, genes with relaxed selection pressure levels typically have
been found to be associated with increases in Ka,without significant changes in Ks (40,
41), reflecting the ubiquitous importance of protein-level selection pressure.
However, contrary to this expectation, when we measured Ka and Ks rates separately
for ancestral alternatively spliced exons, we found that increased Ka/Ks levels were
associated with a large drop in the Ks rate in minor form exons (Fig. 1B). The average
Ks rate (Yang-Nielsen estimates) for constitutive exons was 0.700, but dropped to 0.406
for major-form exons, and 0.133 for ancestral minor-form exons, a more than 5-fold
reduction. The differences in Ks rate between these groups of exons were statistically
significant (P<2.2x10⁻¹⁶ for ancestral constitutive vs. alternative exons; P=3.6x10⁻⁵ for
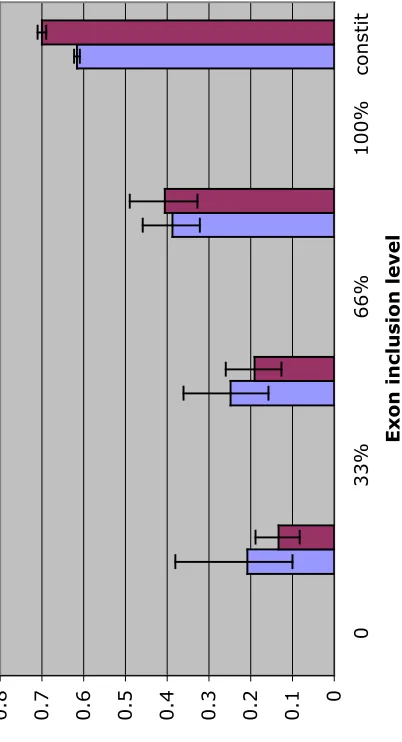
Control tests vs. neighboring exons and introns: To control for gene-specific effects
such as gene expression level, we also repeated our Ks analysis for constitutive exons
within the same genes as these minor-form exons (Fig .1C). The average Ks rate for this
subset of constitutive exons was 0.617, the same as that for other constitutive exons.
Thus, ancestral alternative exons experience a significant reduction in the rate of
synonymous divergence, even compared to neighboring exons within the same genes.
This suggests that the Ks rate at these exons is no longer proportional to the background
mutation rate. Instead these silent sites appear to be under purifying selection, and the
degree of selection is strongest at ancestral minor-form exons.
Evidence of selection pressure on silent sites is often attributed to factors such as
codon usage bias (42), which can cause reduced Ks and an artificial increase in Ka/Ks.
Might this explain our results? Since intronic sequences, by definition, are not translated
and are thus free from selection on codon usage, we sought to test this hypothesis by
measuring the rate of nucleotide divergence at intronic sequences flanking alternative
exons. Again we observed a striking reduction in the observed mutation frequency
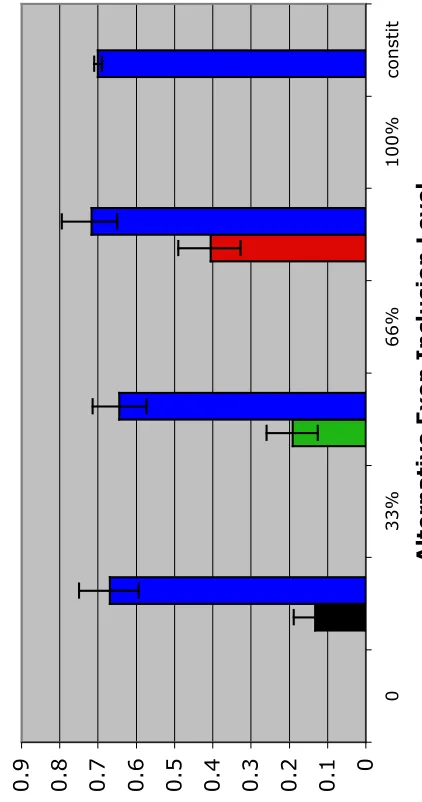
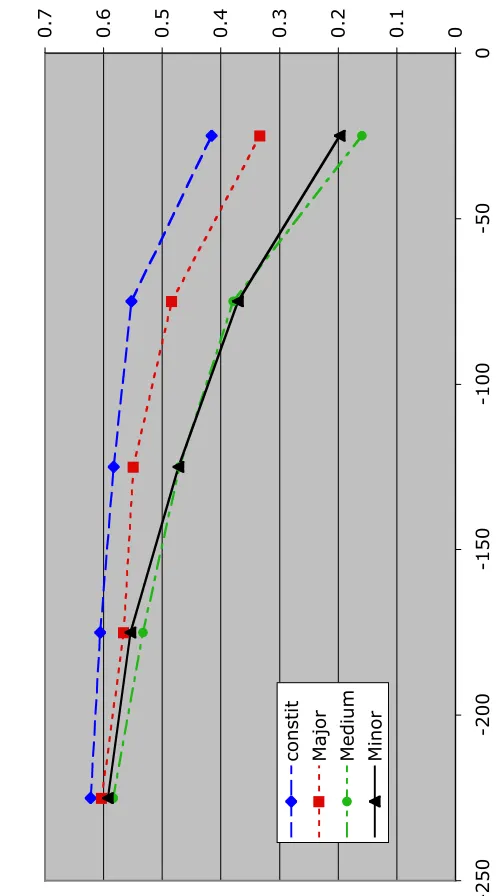
specifically for intron sequences flanking minor-form exons (Fig. 2). For the 50nt
intronic region upstream of constitutive exons, the density of observed substitutions was
0.414, versus 0.334 for major-form exons and 0.198 for minor-form exons, a more than
two-fold increase in selection pressure. The same trend was observed for the 50nt region
downstream of each exon. This selection pressure diminished beyond 150nt from the
exon, and beyond 250nt returned to the background level observed in constitutive exons.
Analysis of Ka and Ks in human, chimpanzee, mouse and rat genomes: In the
frequency π, and by definition can’t affect the protein-level selection factor ω, which is
an independent variable. The appearance of “Ks” in the denominator of the term “Ka/Ks”
might seem to imply that changes in Ks can change the value of Ka/Ks, but this is not true
in the standard formulation of Ka/Ks, because Ks is also present in the numerator of
Ka/Ks (see equation 1, Introduction). Indeed Ks is included in the denominator of Ka/Ks
solely to cancel its presence from the numerator, to obtain a measure of protein-level
selection pressure separate from the baseline nucleotide substitution frequency (23).
To test our interpretation completely independent of this assumption, we have
analyzed the observed density of amino acid substitutions (Ka) in several genome
comparisons ranging in timescale from human vs. chimpanzee (5.4 my), to mouse vs. rat
(41 my), to human vs. mouse (91 my) (43). For ancestral alternatively spliced exons
(human vs. mouse), we observed a marginal increase (24%) in Ka for minor-form exons
compared with major-form exons. In our genome-wide analyses, we observed no increase
in human vs mouse, a 41% increase in mouse vs. rat, and a nearly three-fold increase in
human vs. chimpanzee (Fig. 3 and Supplementary Data). Thus, even the absolute density
of amino acid substitutions, without any correction made for the underlying nucleotide
substitution density, shows a reproducible increase in alternatively spliced exons, and
correlates with the level of alternative splicing for each exon (i.e. its exon skipping
frequency).
Is the reduction in Ks observed in ancestral alternatively spliced exons reproducible
across these multiple genome comparisons? In all cases, Ks showed a clear correlation
with the exon inclusion level, with highest values for constitutive exons, and lowest
constitutive vs. minor-form exons was statistically significant, with the smallest
difference in human vs. chimpanzee (a 58% difference, P=3.7x10⁻³), and the largest
difference in human vs. mouse ancestral alternatively spliced exons (a more than
five-fold difference, P=6.6x10⁻¹⁶).
These multiple genome comparison data also provide some basis for assessing
whether our observed increase in Ka/Ks is real, or an artifact of decreasing Ks.
Specifically, are these data consistent with the standard formulation of Ka/Ks (in which
Ka/Ks is independent of Ks, because the nucleotide substitution density π is present in
both the numerator (Ka) and denominator (Ks), as outlined above), or do they support an
alternative model, in which decreases in Ks can cause increases in Ka/Ks? To assess this
question in our alternative splicing dataset, we calculated the minor-form / major-form
ratio for Ks, Ka, and Ka/Ks in the three different genome comparisons (Fig. 3). These
different datasets display substantial shifts in Ks (shifts ranging from 37% to nearly
four-fold), giving some opportunity to see the impact of changes in Ks on changes in Ka/Ks.
Strikingly, the large shifts in Ks produced no corresponding shift in Ka/Ks, which
remained approximately constant in all three datasets, because the observed shifts in Ka
exactly followed the trend of shifts in Ks. These results are exactly what is expected
under the standard formulation of Ka/Ks, and are not consistent with the hypothesis that
decreasing Ks causes increased Ka/Ks in our data.
Minor-form exons display increased selection pressure for frame-preservation: We
previously defined exons whose length is an exact multiple of 3nt as “frame-preserving”,
because inclusion or skipping of the exon will not alter the protein reading-frame of
be alternatively spliced in both human and mouse ESTs show an increased ratio of
frame-preserving vs. non-frame-frame-preserving exons (21, 35), implying selection pressure for
frame-preservation. We have therefore measured evidence for such selection pressure as
a function of exon inclusion level, across the genome-wide comparisons between human
vs. chimpanzee, mouse vs. rat, and human vs. mouse (see Fig. 4). These data show a
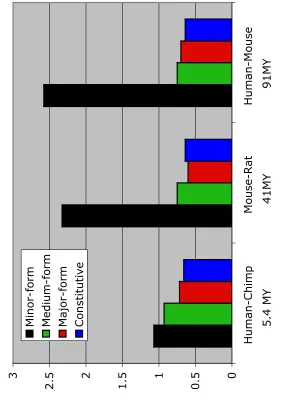
reproducible increase in frame-preservation ratio specifically in minor-form alternatively
spliced exons, up to a maximum value of 2.6 (vs. an average value of 0.6 in constitutive
exons).
Older alternatively spliced exons show increased evidence of RNA selection
pressure: Over the wide range of evolutionary timescales we have analyzed (5 my – 90+
my), the effect of alternative splicing on Ka/Ks was strikingly consistent. For example,
the ratio of Ka/Ks in minor-form vs. major-form exons was approximately constant in all
of these genome comparisons (see Fig. 3). At least over this range of timescales, the
effect of alternative splicing on Ka/Ks does not appear to be a sensitive function of time,
or to have changed substantially over the last 100 my of mammalian evolution.
By contrast, the effect of alternative splicing on Ks showed a very clear increasing
trend with increasing age of evolutionary conservation (Fig. 3), with the smallest
difference between minor-form vs. major-form Ks observed in human vs. chimpanzee
(37%), and the largest difference in human vs. mouse (3.8-fold). These data suggest that
older alternatively spliced exons, conserved over longer periods of evolutionary history,
display much stronger evidence of RNA selection pressure.
It is interesting to note that selection pressure for frame-preservation displayed a
4). The ratio between minor-form vs. constitutive frame-preservation was lowest in the
human vs. chimpanzee comparison (1.6), intermediate in the mouse vs. rat comparison
(3.6), and highest in the human vs. mouse comparison (4.0).
Discussion
These data suggest that alternative splicing reduces amino acid selection pressure,
even for alternatively spliced exons that are functional, while simultaneously increasing
nucleotide selection pressure. However, several alternative interpretations are possible.
First, might this be a trivial result? The observed increase in Ka/Ks might itself be
interpreted as evidence that these exons are newly created exons that have no biological
function. Second, can we accept these Ka/Ks data as valid evidence of reduced amino
acid selection pressure? The observed decrease in Ks raises some question of whether the
increase in Ka/Ks could be an artifact. Third, might our results be an artifact of regions
of unusually low mutation rate, rather than evidence of selection pressure? We will now
consider each of these hypotheses.
Might our data simply reflect newly created, non-functional exons? This does not
appear to be supported by the evidence. The age of creation of an exon does not seem to
affect our results; we observed the same four-fold Ka/Ks increase in very recent genome
comparisons (human vs. chimpanzee) as we did for exons that are over 80-100 my old
(human vs. mouse). Might some of these exons be newly created, i.e. truly exonic only
in one genome, and not the other? This also does not appear to explain our results. For
example, in the human vs. mouse ancestral alternative splicing dataset, each exon was
observed to be expressed both in human transcripts, and in mouse transcripts, yet we
several independent lines of evidence that these exons are functional. Not only have they
been conserved in the genome for over 80 my of evolution, but their pattern of alternative
splicing is conserved as well (i.e. they were independently observed to be both included
and skipped in human transcripts, and in mouse transcripts as well); this has been widely
used as a criterion indicating that an alternative splicing event is functional (20-22).
Furthermore, the observation of strong selection pressure on silent mutations in these
exons (up to five-fold reduction in Ks) indicates that these exons are indeed functional in
the sense of contributing to fitness. We have also observed in the same dataset that these
minor-form exons display a four-fold increase in selection pressure for having an exon
length that is an exact multiple of 3 nt (which preserves the protein reading frame when
the exon is inserted or skipped), relative to constitutive exons. This striking increase in
frame-preservation was observed for minor-form exons in all of the genome comparisons
we performed, and furthermore followed the same trend as was observed for Ks
(evolutionarily older exons showed the biggest increase in selection pressure).
Our observation of a simultaneous increase in Ka/Ks and decrease in Ks (for
minor-form exons) raises questions about whether decreases in Ks could actually cause apparent
increases in Ka/Ks (contrary to the standard formulation of Ka/Ks; see Results).
However, multiple analyses of the human, chimpanzee, mouse and rat genomes showed
that alternative splicing was associated with an increase in the observed density of amino
acid mutations (Ka), even without taking into consideration the underlying density of
nucleotide substitution (Ks).
Might our evidence of increased selection pressure in minor-form exons (e.g.
regions have been reported (44, 45), but do not appear to be consistent with our data.
First, we have observed other types of selection pressure in these minor-form exons (e.g.
a four-fold increase in the protein reading-frame preservation ratio, as described above),
which simply cannot be explained by a low mutation rate. Second, regions of low
mutation rate have been reported to be large, at least a megabase in size (44, 45). By
contrast, our analysis shows that the zone of reduced Ks includes only the alternatively
spliced exon and about 100 nt of flanking intron on either side; neighboring exons in the
same gene showed no decrease in Ks. This zone of reduced Ks is thus over a thousand
fold smaller than expected for reported regions of low mutation rate. Third, this
hypothesis requires many improbable coincidences: the low probability that such regions’
positions in the genome would coincidentally match a given set of exons; that they would
hit only alternatively spliced exons, and not constitutive exons; and that their occurrence
in the genome would correlate with the alternative splicing level of exons in mRNA (e.g.
hitting minor-form exons but not major-form exons).
Our data suggest that alternative splicing can relax selection pressure in a strongly
local fashion, without affecting neighboring constitutive exons in the same gene. Thus
alternative splicing can create “evolutionary hotspots” in which one part of a protein
sequence is allowed to accumulate amino acid mutations at a much higher rate than the
rest of the protein. It is customary to view poor protein sequence conservation (i.e.
neutral or near-neutral Ka/Ks values) as evidence of reduced functional importance.
However, while it is natural to interpret a high Ka/Ks value for an entire gene sequence as
evidence that it is not functional (e.g. a pseudogene), this assumption seems much less
the definition of Ka/Ks, it should be emphasized that high values of Ka/Ks simply mean
rapid change, not necessarily lack of function. For example, specific regions with high
Ka/Ks have often been shown to be functionally very important (e.g. the antigen
presentation cleft of major histocompatibility complex (MHC) proteins (46), and drug
resistance mutations in human immunodeficiency virus (HIV) (47)). In many such cases
the regions with highest Ka/Ks are the most important functional sites in the protein (such
as the antigen binding site in MHC, or drug resistance mutations in HIV protease).
Subsegments of elevated Ka/Ks, often corresponding to individual exons that are
alternatively spliced, appear to have been important in both the evolution and function of
many proteins, such as BRCA1 (48) and CD45 (49). Our Ks data and frame-preservation
results provide systematic evidence that such rapid evolution of a protein subsequence is
not necessarily indicative of loss of function. This suggests that such alternative
splicing-accelerated evolution has produced adaptive functions that have been selected for during
recent evolution.
Intuitively, it may seem surprising to suggest that alternative splicing can cause both
a loss of selection pressure (Ka/Ks), and an increase in selection pressure (Ks). However,
there is abundant support in the literature for both effects. Alternative splicing is
associated with reduced selection pressure against exon creation / loss (13, 18); presence
of Alu sequences in exons (17); premature protein termination codons (19); amino acid
substitutions (this study); and splice site movement (data not shown). It has also been
shown to increase selection pressure for protein reading frame preservation (35); and
splicing and splice-regulatory motifs are associated with increased percent identity in
genome comparisons has been widely reported (8, 10, 11, 36, 37).
Our Ks data provide additional evidence of extensive “RNA-level” selection pressure
that is distinct from protein-level selection. In alternatively spliced exons, Ks appears to
behave very differently from amino acid selection pressure (Ka/Ks), and this effect
extends into the flanking intronic sequence, as would be expected for selection pressure
on splicing regulatory motifs. Moreover, the fact that the Ks reduction correlates strongly
with the efficiency of the splicing reaction for that exon (i.e. its inclusion level), directly
indicates that this reflects selection pressure on the splicing reaction itself. This
conclusion is abundantly supported by reports of increased percent identity around
alternatively spliced exons, attributed to splicing regulatory motifs (such as splicing
enhancers and silencers) shown to be enriched in these exons (9, 10, 50, 51). Indeed
there is a known case in BRCA1 where alternatively spliced exons were found to have
greatly increased Ka/Ks and reduced Ks where several splicing regulator elements were
detected (48). Why don’t major-form alternatively spliced exons show as high a level of
RNA sequence selection pressure as form exons? This may suggest that
minor-form exons require more regulatory signals, and that their splicing may be more highly
regulated, whereas major-form exons may represent a “default” splicing pattern.
Acknowledgements
We wish to thank D. Black, G. Chanfreau, and B. Modrek for their discussions and
comments on this work, and P. Green and S. Eddy for discussions on the possible
interactions of Ks and Ka/Ks. C.J.L. was supported by NIH Grant U54-RR021813, and
References
1. Mironov, A. A., Fickett, J. W. & Gelfand, M. S. (1999) Genome Res.9, 1288-1293.
2. Brett, D., Hanke, J., Lehmann, G., Haase, S., Delbruck, S., Krueger, S., Reich, J. & Bork, P. (2000) FEBS Letters474, 83-86.
3. Modrek, B. & Lee, C. (2002) Nature Genet.30, 13-9.
4. Kampa, D., Cheng, J., Kapranov, P., Yamanaka, M., Brubaker, S., Cawley, S., Drenkow, J., Piccolboni, A., Bekiranov, S., Helt, G., Tammana, H. & Gingeras, T. R. (2004) Genome Res14, 331-42.
5. Brett, D., Pospisil, H., Valcarcel, J., Reich, J. & Bork, P. (2002) Nature Genet.30, 29-30.
6. Kim, H., Klein, R., Majewski, J. & Ott, J. (2004) Nat Genet36, 915-6; author reply 916-7.
7. Valenzuela, A., Talavera, D., Orozco, M. & de la Cruz, X. (2004) J Mol Biol335, 495-502.
8. Sorek, R. & Ast, G. (2003) Genome Res13, 1631-1637.
9. Bejerano, G., Pheasant, M., Makunin, I., Stephen, S., Kent, W. J., Mattick, J. S. & Haussler, D. (2004) Science304, 1321-5.
10. Fairbrother, W. G., Holste, D., Burge, C. B. & Sharp, P. A. (2004) PLoS Biol2, E268.
11. Itoh, H., Washio, T. & Tomita, M. (2004) Rna10, 1005-18. 12. Boue, S., Letunic, I. & Bork, P. (2003) Bioessays25, 1031-4. 13. Modrek, B. & Lee, C. (2003) Nature Genet.34, 177-180.
14. Lareau, L. F., Green, R. E., Bhatnagar, R. S. & Brenner, S. E. (2004) Curr Opin
Struct Biol14, 273-82.
15. Kondrashov, F. A. & Koonin, E. V. (2001) Hum Mol Genet10, 2661-9. 16. Letunic, I., Copley, R. R. & Bork, P. (2002) Hum Mol Genet11, 1561-7. 17. Sorek, R., Ast, G. & Graur, D. (2002) Genome Res12, 1060-7.
18. Pan, Q., Shai, O., Misquitta, C., Zhang, W., Saltzman, A. L., Mohammad, N., Babak, T., Siu, H., Hughes, T. R., Morris, Q. D., Frey, B. J. & Blencowe, B. J. (2004) Mol Cell16, 929-41.
19. Xing, Y. & Lee, C. (2004) Trends Genet20, 472-5.
20. Kan, Z., States, D. & Gish, W. (2002) Genome Res12, 1837-45.
21. Thanaraj, T. A., Clark, F. & Muilu, J. (2003) Nucleic Acids Res31, 2544-2552. 22. Sorek, R., Shamir, R. & Ast, G. (2004) Trends Genet 20, 68-71.
23. Yang, Z. & Bielawski, J. P. (2000) Trends in Ecology and Evolution15, 496-503. 24. Li, W. H. (1993) J. Mol. Evol.36, 96-99.
25. Hurst, L. D. (2002) Trends Genet 18, 486.
26. Makalowski, W. & Boguski, M. S. (1998) Proc Natl Acad Sci U S A95, 9407-12. 27. Modrek, B., Resch, A., Grasso, C. & Lee, C. (2001) Nucleic Acids Res.29,
2850-9.
28. Schuler, G. (1997) J. Mol. Med. 75, 694-698.
Tatusova, T. A. & Wagner, L. (2004) Nucleic Acids Res32 Database issue, D35-40.
30. Nekrutenko, A., Chung, W. Y. & Li, W. H. (2003) Nucleic Acids Res31, 3564-7. 31. Rice, P., Longden, I. & Bleasby, A. (2000) Trends Genet 16, 276-7.
32. Thompson, J. D., Higgins, D. G. & Gibson, T. J. (1994) Nucleic Acids Res.22, 4673-80.
33. Yang, Z. (1997) Comput Appl Biosci13, 555-6.
34. Altschul, S. F., Gish, W., Miller, W., Myers, E. W. & Lipman, D. J. (1990) J.
Mol. Biol.215, 403-410.
35. Resch, A., Xing, Y., Alekseyenko, A., Modrek, B. & Lee, C. (2004) Nucleic
Acids Res32, 1261-9.
36. Philipps, D. L., Park, J. W. & Graveley, B. R. (2004) Rna10, 1838-44.
37. Sorek, R., Shemesh, R., Cohen, Y., Basechess, O., Ast, G. & Shamir, R. (2004)
Genome Res14, 1617-23.
38. Hide, W. A., Babenko, V. N., van Heusden, P. A., Seoighe, C. & Kelso, J. F. (2001) Genome Res.11, 1848-1853.
39. Sharp, P. M., Averof, M., Lloyd, A. T., Matassi, G. & Peden, J. F. (1995) Philos
Trans R Soc Lond B Biol Sci349, 241-7.
40. Thomas, M. A., Weston, B., Joseph, M., Wu, W., Nekrutenko, A. & Tonellato, P. J. (2003) Mol Biol Evol20, 964-8.
41. Zhang, L. & Li, W. H. (2004) Mol Biol Evol21, 236-9. 42. Iida, K. & Akashi, H. (2000) Gene261, 93-105.
43. Hedges, S. B. (2002) Nat Rev Genet3, 838-49.
44. Matassi, G., Sharp, P. M. & Gautier, C. (1999) Curr Biol9, 786-91.
45. Lercher, M. J., Williams, E. J. & Hurst, L. D. (2001) Mol Biol Evol18, 2032-9. 46. Bernatchez, L. & Landry, C. (2003) J Evol Biol16, 363-77.
47. Chen, L., Perlina, A. & Lee, C. J. (2004) J Virol78, 3722-32. 48. Orban, T. I. & Olah, E. (2001) Trends Genet 17, 252-3.
49. Filip, L. C. & Mundy, N. I. (2004) Mol Biol Evol21, 1504-11. 50. Sorek, R. & Ast, G. (2003) Genome Res13, 1631-7.
Figure Legends
Figure 1: Ancestral alternative splicing: amino acid selection pressure and nucleotide
selection pressure as a function of alternative splicing
(A) Ka/Ks decreases as a function of increasing exon inclusion levels for alternatively
spliced exons, and was lowest in constitutive exons. Two methods of estimating Ka/Ks
are shown: Nei-Gojobori (blue); Yang-Nielsen (red). Error bars indicate the 95%
confidence interval for the mean Ka/Ks ratio computed by nonparametric bootstrapping.
(B) Ks increases as a function of increasing exon inclusion level for alternatively spliced
exons, and was highest in constitutive exons. Two methods of estimating Ks are shown:
Nei-Gojobori (blue); Yang-Nielsen (red). Error bars represent the 95% confidence
interval for the mean Ks ratio computed by nonparametric bootstrapping.
(C) Ks of alternatively spliced exons versus neighboring constitutive exons (blue bars)
within the same gene. Ks was measured using the Yang-Nielsen method. Error bars
indicate the 95% confidence interval for the mean Ks computed by nonparametric
bootstrapping.
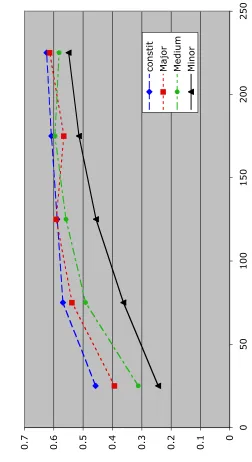
Figure 2: Intronic nucleotide substitution density as a function of alternative splicing and
distance to intron-exon junctions
Intronic nucleotide substitution density increases as a function of increasing exon inclusion levels for alternatively spliced exons, and was highest in constitutive exons. The greatest difference in the intronic nucleotide substitution density between minor-form and constitutive exons was observed in the 50-nucleotide intronic regions
immediately adjacent to the intron-exon junctions. (A) upstream introns. (B) downstream
introns.
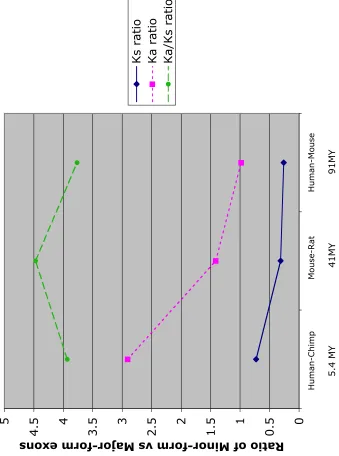
Figure 3: Increased Ka/Ks and decreased Ks is a general phenomenon associated with
alternative splicing during recent mammalian evolution
The ratios for minor-form exons over major-form exons calculated for Ka, Ks and Ka/Ks.
Reduced Ks and elevated Ka/Ks is observed in all three genome comparisons: human vs
chimpanzee, mouse vs rat and human vs mouse. Ka, Ks and Ka/Ks were estimated using
the Yang-Nielsen method.
Figure 4: Protein reading-frame preservation as a function of alternative splicing.
Ka/Ks
0
0.2
0.4
0.6
0.8
1
1.2
1.4
0
33%
66%
[image:24.612.229.441.192.612.2]100%
constit
Exon Inclusion Level
Fig
Ks
0
0.1
0.2
0.3
0.4
0.5
0.6
0.7
0.8
0
33%
66%
[image:25.612.220.421.214.585.2]100%
constit
Exon inclusion level
Fig 1C
Ks of alternative exons vs neighboring
constitutive exons
0
0.1
0.2
0.3
0.4
0.5
0.6
0.7
0.8
0.9
0
33%
66%
100%
constit
[image:26.612.232.443.189.590.2]Fig
2A
Density of Nucleotide Substitutions in Upstream
Introns
0
0.1
0.2
0.3
0.4
0.5
0.6
0.7
-250
-200
-150
-100
-50
0
[image:27.612.199.448.171.619.2]Fig 2B
Density of Nucleotide Substitutions in Downstream
Introns
0
0.1
0.2
0.3
0.4
0.5
0.6
0.7
0
50
100
150
200
250
[image:28.612.197.449.172.634.2]Fig 3
5.4 MY 41MY 91MY
0
0.5
1
1.5
2
2.5
3
3.5
4
4.5
5
Human-Chimp
Mouse-Rat
Human-Mouse
Ratio of Minor-form vs Major-form exons
Fig 4
Frame Preservation Ratio of Exons
0
0.5
1
1.5
2
2.5
3
Human-Chimp
[image:30.612.188.474.200.601.2]Mouse-Rat
Human-Mouse