Improving productivity of road surfacing
operations using value stream mapping
and discrete event simulation
Qasim, RM, Aziz, ZUH and Wajdi, S
http://dx.doi.org/10.1108/CI1120160058
Title
Improving productivity of road surfacing operations using value stream
mapping and discrete event simulation
Authors
Qasim, RM, Aziz, ZUH and Wajdi, S
Type
Article
URL
This version is available at: http://usir.salford.ac.uk/41471/
Published Date
2017
USIR is a digital collection of the research output of the University of Salford. Where copyright
permits, full text material held in the repository is made freely available online and can be read,
downloaded and copied for noncommercial private study or research purposes. Please check the
manuscript for any further copyright restrictions.
Improving Productivity of Road Surfacing Operations Using Value Stream
Mapping and Discrete Event Simulation
Abstract
Purpose: The Highways Infrastructure is one of the most valuable asset owned by the public sector. Efficient operations of Highways have the success of national and local economies as well as quality of life of the general public, dependent on it. Ensuring smooth traffic operations requires maintenance and improvements of the highest standard. This research investigates integration of Discrete Event Simulation (DES) and Value Stream mapping (VSM) to enhance the productivity of the delivery of road surfacing operations by achieving higher production rates and minimum road closure times.
Design/Methodology/Approach: Research approach involved use of primary data, collected from direct observation, interviews, review of archival records and productivity databases. Based on this, process maps and value stream maps were developed, which were subsequently used to produce discrete event simulation models, for exploration of different optimisation scenarios.
Findings: This research highlights a synergistic relationship between applications of Value Stream Mapping (VSM) along with Discrete Event Simulation (DES) methods in driving construction process innovation. Identified factors that affect roadworks process productivity include machine, manpower, material, information, environment, and method related factors. A Discrete Event Simulation model is presented to optimise the process and achieve higher production rates. A hybrid DES-VSM approach ensures an integrated approach to process optimisation.
Research Limitations: This research work is an application of hybrid version of previously published DES-VSM framework in manufacturing. Presented research has extended and tested its applicability within the road surfacing operations. Different what-If scenarios performed in this paper might not be applicable to other parts of the world due to various constraints. The research has focused on addressing waste inherent in pavement laying process. Even though external variables could possibly influence pavement process, those were ignored to allow for in-depth focus on process under consideration
Practical Implications:
Road users
are one of the most important stakeholders that will benefit from the positive implications of research. Private resurfacing companies and transport departments can optimise their overall process and style of working by comparing their end-to-end process and work plans with ones mentioned in this paper. It will boost the productivity of equipment like planers, pavers and other machines used in resurfacing operations.Originality: Existing approaches to process modelling such as Value Stream Mapping, Process diagrams are constrained by their effectiveness in analysis of dynamic and complex processes. This research presents a Discrete Event Simulation based approach to validate targeted improvements of the current state of road surfacing processes and in exploration of different optimisation scenarios.
1. Introduction
Road surfacing is a important component of Highways Development and Maintenance. Highways construction sector, in general, is characterised by its slow pace of change, low productivity, waste, fragmentation, and long established processes and ways of doing business, that has not changed over decades. Efficient running of road network has the success of national and local economies as well as quality of public life, dependant on it. Increasing volumes of traffic requires maintenance and improvements of the highest standard. For instance, National Infrastructure Plan (NIP) by HM Treasury, UK (2015) detailed existing commitments leading to the construction of at least 52 major road projects by 2020-21, leading to an addition of over 750 lane-miles of capacity to the busiest motorways and trunk roads; and resurfacing of about 80% of the Strategic Road Network (SRN) by 2020. Such huge public sector investments in road infrastructure comes alongside the Government’s cuts in operations and maintenance expenditures on infrastructure, due to macroeconomic challenges facing the economy. Thus, a key challenge is to deliver major road schemes in resource-constrained environments, while maintaining safety, cost efficiency, sustainability and minimal impact on road users. Enhancing productivity of existing processes is a key to operating in a resource-constrained environment.
Recent reviews of the construction productivity performance, specifically roadworks, indicate that the industry fell short in comparison to manufacturing and services-based industry sectors. Some of the key factors restraining the productivity of construction are related to quality, use of project controls, and proper levels of supervision. Similar observations were made in the annual UK Construction Industry Performance Report (2014), indicating that majority of construction projects continue to fail to meet their time and cost targets. These observations are often coupled with falling profitability and client dissatisfaction with regards to product quality, service and value for money. As explained by Jergeas (2009), there are excessive time extensions, over budgeting and lack of productivity connected with the conduct of major capital construction projects worldwide. Multiple researchers and practitioners have recognised poor management practices that cause poor performance. Namely; scope changes, lack of proper planning and scheduling, design errors and omissions, inadequate management of tools, equipment, materials, and labour in addition to many other factors. Resulting road closures result in negative feedback from road users.
Considering aforementioned findings, there is an urgent need for improving the productivity of road works projects within the construction industry to deliver ongoing and future projects, with maximum efficiency and minimum waste. To address the issue of efficiency, various opportunities have been realised in highways sector. Discrete Event Simulation (DES) along with Value Stream Mapping (VSM) has been recognised as a technique that can improve the overall process as well as some specific key areas. Manufacturing, process, construction and healthcare sectors have advanced their processes and benefitted from either simulation, value stream mapping or the integration of both.
Rest of the paper is organised as below. Section 2 presents literature review, while Section 3 introduces readers to analysed case study. Section 4 introduces different scenarios of discrete event simulation model. This is followed by discussions in Section 5 and conclusions.
2. Literature Review
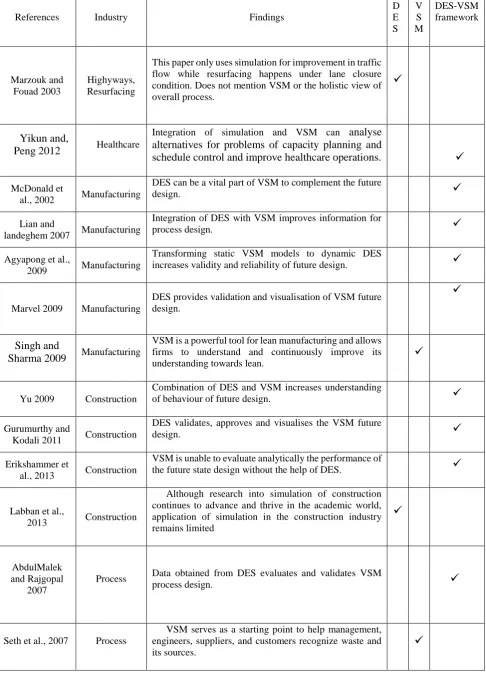
Table 1 Showing synergic relation of DES and VSM and its popular applications
References Industry Findings
D E S V S M DES-VSM framework Marzouk and Fouad 2003 Highyways, Resurfacing
This paper only uses simulation for improvement in traffic flow while resurfacing happens under lane closure condition. Does not mention VSM or the holistic view of overall process.
Yikun and,
Peng 2012 Healthcare
Integration of simulation and VSM can analyse alternatives for problems of capacity planning and schedule control and improve healthcare operations.
McDonald et
al., 2002 Manufacturing
DES can be a vital part of VSM to complement the future
design.
Lian and
landeghem 2007 Manufacturing
Integration of DES with VSM improves information for
process design.
Agyapong et al.,
2009 Manufacturing
Transforming static VSM models to dynamic DES
increases validity and reliability of future design.
Marvel 2009 Manufacturing
DES provides validation and visualisation of VSM future design.
Singh and
Sharma 2009 Manufacturing
VSM is a powerful tool for lean manufacturing and allows firms to understand and continuously improve its understanding towards lean.
Yu 2009 Construction
Combination of DES and VSM increases understanding
of behaviour of future design.
Gurumurthy and
Kodali 2011 Construction
DES validates, approves and visualises the VSM future
design.
Erikshammer et
al., 2013 Construction
VSM is unable to evaluate analytically the performance of
the future state design without the help of DES.
Labban et al.,
2013 Construction
Although research into simulation of construction continues to advance and thrive in the academic world, application of simulation in the construction industry remains limited
AbdulMalek and Rajgopal
2007
Process Data obtained from DES evaluates and validates VSM
process design.
Seth et al., 2007 Process
VSM serves as a starting point to help management, engineers, suppliers, and customers recognize waste and its sources.
VSM was formed from Toyota production system and Lean manufacturing principles (Womack et al 1990). It is defined as an iterative method to map and analyse value streams and its goal is to evaluate and communicate production process aspects, such as material and information flows as well as non-value adding actions (Rother and Shook, 2003, Lasa et al., 2008). It is used in improvements schemes like increasing throughput and for reduction of Lead time and work in progress (WIP) (Alvarez et al., 2009). VSM is made up of three components; a) Current State Gap that visualises value adding and non-value adding activities in a process, b) Future State Design, a value stream that solves the identified problems of current state and c) Yearly Value Stream Plan that creates the operational plan to reduce gap between current and future state. (Martin and Osterling 2014). VSM, however, cannot provide hard facts for decision making and simply points toward a direction. It lacks the ability to analytically forecast the effects on future performance of a system, hence the need of Simulation arises to experiment and evaluate the future behaviour of a scheme (Jarkko et al. 2013). Basic lean tools, including VSM, are sufficient for analysing simple and linear processes with relatively consistent demand patterns. Static approaches are incapable of analysing processes that incorporate volatile demand dynamics, mix product complexity or the shared use of resources. In such scenarios, time dependencies are important as a process simulation model can accurately describe and visualise the dynamics of the process, its performance, and the required resources.
Simulation is the process of modelling a real world situation and developing a framework within which the system can be analysed (Law & Kelton, 2000). Application of simulation in construction operations has many advantages including estimation of possible delays, productivity determination and improvement. In addition to resource management and optimisation, stochastic system response to unexpected conditions, and ability to respond to random and dynamic features, while the system is operating (Halpin, 2003). Simulation is also defined as a “controlled statistical sampling technique (experiment) that is used, in conjunction with a model, to obtain approximate answers for the question about complex, multifactor probabilistic problems” (Lewis & Orav, 1989). This technique is used by many industries to model real-life and hypothetical situations, due to its dynamic nature and complex scenarios. This was acknowledged as well by (Bhasin, 2015), stating that as an integral part of a lean activity, companies spend much time designing new processes layouts, producing CAD drawings and building process maps en-route. The cost of these activities can run into significant amount while none of these outputs will indicate whether the new process will succeed or not. That is the job of process simulation which can examine the capability of the new design and provide vital implementation support to decision-makers that they are on the right path or not.
The integration of VSM with DES is more dominant in manufacturing industry than construction. Simulation based VSM makes it possible to investigate complex systems and interpret the simulation results in a language that lean recognizes (Solding and Gullander 2009). Both DES and VSM provide a holistic assessment of system and DES also adds a fourth dimension, time, to VSM. This combination offers insights that may have been missed if VSM alone had been used (Donatelli and Harris 2009). It has been noticed that DES can enhance VSM and a process can benefit incredibly with the integration of both (Erikshammer et al 2013). Major purpose of using their integration is to boost the productivity of resurfacing process, reduce waste and maximise the efficiency of resources involved in the process.
done per hour at the gang or individual level. Finally, the project approach measures the productivity of the entire project as a unit of observation. Dozzi & AbouRizk (1993) stated that productivity has two significant measures, which are the efficient use of labour, and the relative competency of labour to achieve what is required; the latter is the most important to contractors and organised labour. Rebholz, Al-Kaisy, & Nassar (2004) defined productivity in road construction industry as the quantity of laid asphalt in tonnes per hour or per day was adopted. For purposes of this research, this definition was adopted.
3. Research Methodology
Key focus of this effort is improving the productivity of the road surfacing process. The research draws upon lean theory and tools, to improve road resurfacing operations. There are about 40 lean tools that are being used in diverse operations worldwide and they all have different style of operation. Some of the common tools are 5s, Andon, Last planner, Single Minute Exchange of Dies (SMED), Kanban, VSM, process mapping, visual management and kaizen etc. This paper however focuses on VSM and attempt to improve and validate it with simulation technique. The reason for choosing VSM is its frequent application in highways operations. VSM is used to visualise and map the processes, leading to attainment of higher production levels. However, as mentioned in the literature review there are various weaknesses and drawbacks of VSM that can be eliminated through application of DES. The gaps and loopholes in value stream maps of resurfacing operation are diagnosed with the help of fishbone analysis.
For validation of VSM, simulation technique has been adopted. The main three types of simulation are; discrete-event, continuous, and Monte-Carlo. They were defined by (Nance, 1993) as Discrete Event Simulation (DES)
which utilises logical model of a real-life physical system that represents state changes at precise points of the simulated time. Both the nature of the state change and the time at which the change occurs dictate an accurate description. Secondly, Continuous Simulation that is based on the equational model rarely represents a real-life system which does not represent precise time and state relationships that happen in discontinuities. The objective of conducted researches utilising such models has no requirement for the explicit representation of state and time relationships. Finally, Monte-Carlo Simulation, which utilises models of uncertainty and representation of time, is required. The term originally attributed to a situation in which a difficult non-probabilistic problem is simulated through the presentation of stochastic process, which satisfies the relations of the deterministic problem
For the purpose of this research, the DES was chosen due to the flexibility and precise state fluctuation within the process. While multiple DES software applications were introduced to the market by different developers, such as FlexSim, Simio, Anylogic, JaamSim, MASON, Sim.JS, and many others, FlexSim was selected to carry out the intended simulations considering it is one of the most popular simulation software applications for its ease-of-use, rich functionality, and its capabilities of tracking different data points such as throughput, content, machine state, and utilisation. According to Manuj et al. (2009), there are seven major steps in the methodology of creating a simulation of a real life situation applying it back to system. These include:
i. Problem Formulation
ii. Specify dependant and independent variables
Dependant variables show the performance measures and independent variables contain the system parameters. Independent variables are manipulated and their effects on dependant variables are logged and investigated in a simulation model. The examination of dependant variable values provides answers to the problem formulated in step 1. As the outcome of model depends on what is included in it, the objective of research and specific questions guide the selection of dependant and independent variables. Various variables can influence the simulation including legal, technical, economic, organisational, managerial, monetary and historic factors. (Towill and Disney 2006)
iii. Develop and validate conceptual model
According to Banks (1998), a conceptual model is an abstraction of real life system under examination. It uses logical and mathematical relationships related to the components and structure of system. Unambiguous assumptions and specified descriptions in the conceptual model ensure that model is developed in accordance with the problem statement. Validity of outcomes directly depends on the inputs in system therefore, it is important to develop a conceptual model to validate prior to investing resources in computer based model.
iv. Collect data
This step can be challenging as data might not be readily available or in required formats. Some times the level of detail is inappropriate and this step is performed in parallel to development of conceptual model. Data requirements must be established first to define system parameters, layout, probability distributions and operating procedures. Data can be obtained from company databases, surveys, interviews and from other published sources. In some cases, data can be generated using computer if actual data can be approximated using distributions like poison, normal and exponential methods. This is data is the backbone of the whole work, any mistakes in this step will nullify all further analysis.
v. Develop and verify computer-based model
Computer modelling begins simply and the complexity can be added in steps until a model of adequate detail and complexity has been created (Banks 1998). Verification is performed to check whether the computer application of conceptual model is correct or not. According to Sargent (2007), verification is continuous process and it needs to be performed concurrently with development of computer model rather than doing at the end. Verification means analysis of outputs, debugging of errors and checking code. There are two benefits of verification; identification of undesirable system behaviour and checking if the complex steps can be replaced by simpler ones. (Fishman and Keviat 1968). There are various software in the market to create a simulation model and there are software to verify it as well.
vi. Validate model
Model validation is a process of establishing if a simulation is accurately representing the system under investigation. This validated model can then be used to make decisions similar to what the system could perform if they were feasible and economical to experiment (Law 2006). An invalid model cannot be trusted as it may lead to erroneous conclusions. There are various ways to validate a model including, consulting academic scholars and practitioners, focus group interviews and by performing sensitivity analysis.
vii. Perform simulations
number of simulation runs for each condition, reducing length of subintervals, and increasing the length of the run to raise the number of subintervals. (Bienstock 1994)
A similar method is used in this paper, however the VSM part differentiates this paper from another works. The figure below shows the adopted methodology to create conceptual framework, verification, data collection, development and validation. Figure 1 shows the framework developed for this particular work.
<Insert Figure 1 here>
4. Case Study Analysis
This section presents a detailed case study of a road surfacing process improvement project at the project level, involving usage of lean tools alongside Discrete Event Simulation to explore opportunities of optimising existing road surfacing process.
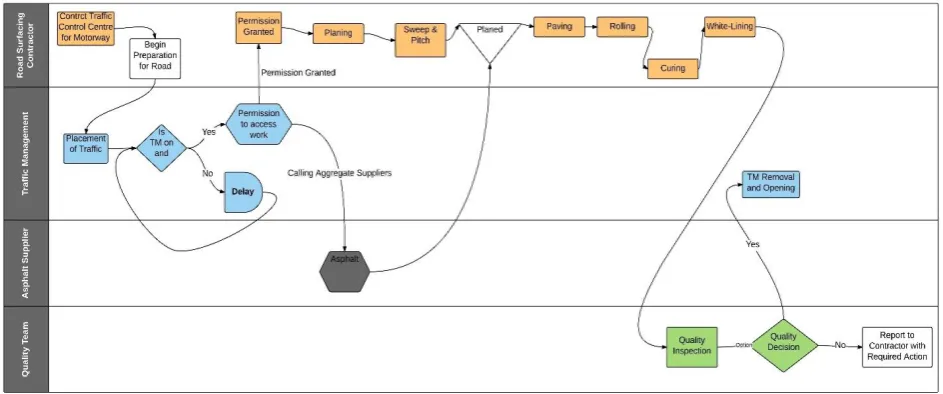
All types of road work processes, whether new constructions or maintenance work, are classified into two major types i.e. surfacing and resurfacing. Every road surface has its diverse characteristics, which vary according to its geography, location, surrounding terrain, speed related parameters, intended use, and type of pavement. A typical comprehensive resurfacing process of a Hot Mix Asphalt pavement is shown in Figure 2 (Area 9 Pavement Process Improvement, 2015). Key constraints that must be addressed before start of pavement process include setting up of Traffic Management (typically 15 minutes), material call-off and planer mobilisation (typically 30 minutes), and planning a head start (typically 45 minutes), leading to a total non-value adding the pre-paving time of 1 Hr 30 minutes. Key post-pavement process constraints include rolling (typically 30 minutes), cooling and curing (typically 75 minutes) and Traffic Management removal (typically 30 minutes). This means a total of 2 hours and 15 min post is paving shift period. A safety margin of around 1 Hr 30 Mins is left for safety related activities. Installation and removal of Traffic Management has an average duration between 30 minutes to 45 minutes and depend on a wide range of variables including use of different designs and types of TM, delays and operator/process related variables.
<Insert Figure 2 here>
Analysis of archived data and that collected from on-site observation was used to build a situation summary and current state of the process as shown below:
The average output for a paving gang is 240 tonnes per shift
The paver can lay 130 tonnes per hour when it is operational; This equates to 1.8 hours of value adding activity in a typical shift (240t /130t = 1.8hrs of Value Adding work)
Utilisation of plant and people based on the 10hr paid shift: o Planing gang: 137 mins / 600 mins = 22% utilisation; o Sweeper same as planing above = 22% utilisation;
o Spraying nominal utilisation as this is a very quick operation o Paving gang utilisation = 108 mins / 600 mins = 18% utilisation o Rolling – same as paving above = 18% utilisation
o White lining = 60 mins / 600 mins = 10% utilisation
o Trucks removing planing and delivering blacktop = 30-40% o Aggregate plant = circa 20-40% utilisation
86% of the time the paving gangs work within a 7-8 hour working window
14% of the time it is more than this – between 9 and 10 hours
There is an average 23 min delay between TM placed on and the first value adding activity starting
Figure 2 illustrate “As-Is” process as a bar chart, based on data observed from 2 site visits and supported by historical data. Key value adding activity (i.e. paving process) ran just for 2 hours 11 minutes in an 8-hours work window (10pm-6am) and 10-hour worker shift (9 pm – 7 pm). A total of 298 Tonnes at a stretch of 938 metres was laid in 2 hours 11 minutes value adding activity, leading to an hourly tonnage rate of 137 T and pavement productivity of 33%. While work window is till 6 am, traffic management is removed at 4:39 am, leading to 1 hr 29 minutes’ lesser utilisation of allocated work window.
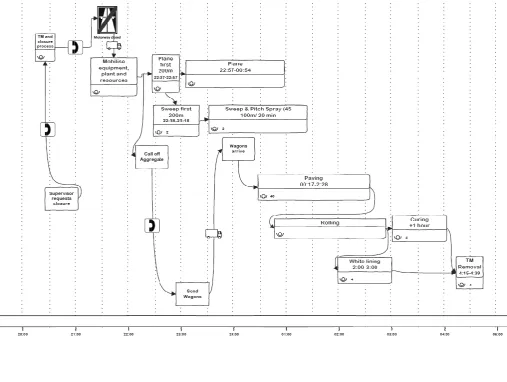
<Insert Figure 3 here>
Figure 3 above shows the Value stream map of as-is operation. Based on it, various opportunities for waste reduction can be identified. Firstly, planning operation start at 22:37, given site access has been granted at 22:08, this signifies a delay of 29 minutes after access to the area for surfacing has been granted. Secondly, main value adding activity paving starts at 00:17. This highlights a paver sitting idle for over 2 hours, awaiting material arrival. Thirdly, while working window is till 6 am, workers are off-site about one hr 21 minutes before allocating period, highlighting another area for improvement. Fourthly, there is a possibility to extend working window by obtaining an early access to work. Figure 4 below shows the as-is (baseline) process with respect to time.
<Insert Figure 4 here>
4.1 Identification of problems
In the problem definition phase, several collaborative workshops and meetings were held with all key project stakeholders involved in the process. Using a team-based approach, various process optimisation opportunities were discussed, key findings from the research were discussed, key constraints affecting output were analysed and opportunities for improvement were identified. A key challenge considered by the team was to increase output and production rates without the deployment of any additional resources. This was done primarily by addressing constraints that primarily affect the flow of work. Improved productivity was to be achieved, whilst addressing key constraints of safety (for both operatives and road users), resource wastage (e.g. ordering aggregate materials earlier than usual also increases risk of material wastage if work is abandoned because of road accident or weather), quality (e.g. increasing paver speed to enhance productivity could have negative consequences for quality), on-time traffic management removal (to avoid risks of late road openings of busy roads) and operative staff buy-in (in terms of longer working hours and different working methods).
4.2 Steps taken
In order to reduce time wastage between motorway closure and start of planning operation, various opportunities for improvement were identified. Firstly, by enabling an early contact between regional traffic control centres helped to speed up the process and reduced waiting time involved in the clearance process. The second area of improvement identified was to set out traffic management to close two lanes earlier (given safety constraints are addressed) and bring plant and material ahead of full closure. This ensured that plant and material are available ahead of full motorway closure. In order to increase the productivity of pavement process, calling material earlier would allow paver to begin operations early. There is a time lag of 14 minutes involved between planer and paver processes to commence, to allow time for cleaning and preparation.
Improved work diagram is shown in Figure 5. It involved increasing work window to 10 hours and 36 minutes. Total asphalt tonnage laid was 1024 Tonnes, in comparison with 298 Tonnes laid in the baseline process (Figure 4).
[image:10.595.50.531.183.345.2]<Insert Figure 5 here>
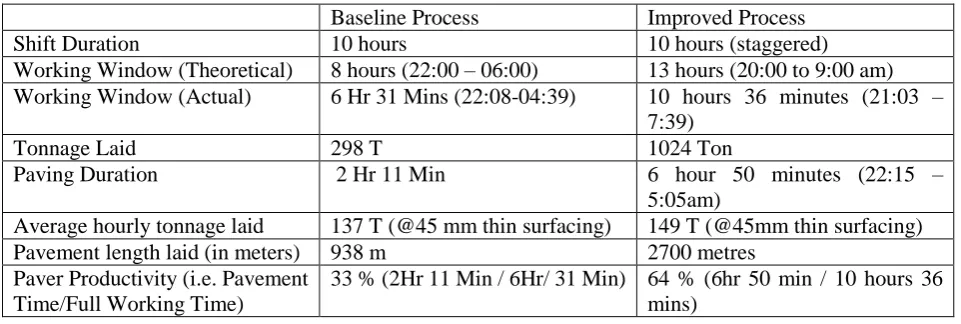
Table 2 showing Improvement Comparison
Baseline Process Improved Process
Shift Duration 10 hours 10 hours (staggered)
Working Window (Theoretical) 8 hours (22:00 – 06:00) 13 hours (20:00 to 9:00 am) Working Window (Actual) 6 Hr 31 Mins (22:08-04:39) 10 hours 36 minutes (21:03 –
7:39)
Tonnage Laid 298 T 1024 Ton
Paving Duration 2 Hr 11 Min 6 hour 50 minutes (22:15 – 5:05am)
Average hourly tonnage laid 137 T (@45 mm thin surfacing) 149 T (@45mm thin surfacing) Pavement length laid (in meters) 938 m 2700 metres
Paver Productivity (i.e. Pavement Time/Full Working Time)
33 % (2Hr 11 Min / 6Hr/ 31 Min) 64 % (6hr 50 min / 10 hours 36 mins)
Table 2 above shows the differences in efficiency between baseline and improved process state. In resurfacing operations, paving is the most important activity and its duration can highly impact the productivity. It can be seen that paver productivity rose from 33% to 64% that lead to 2700m of paved road compared to 938m on average.
4.3 Data collection for Simulation
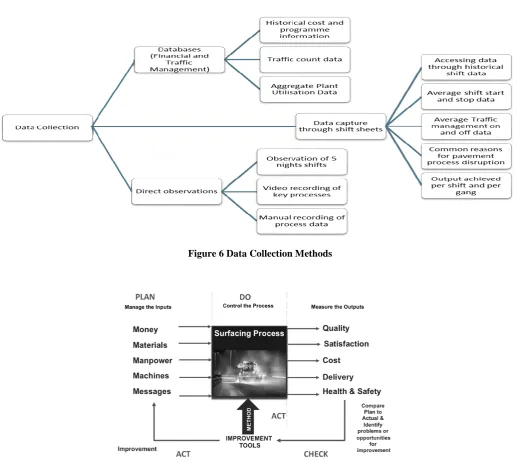
At this stage, an improvement scheme was implemented and there was an opportunity to record the data required for the development of simulation model. Data was required from various times and levels i.e. present day data, traffic counts, historic data, from aggregate industries, trucks and other equipment data. Most of the process related information was captured by people present on site in the form of videos and time lapse pictures. This information was then fed into simulation for better accuracy and validity. Figure 6 below shows the data collection steps and procedures that were required for the development for this simulation model.
<Insert Figure 6 here>
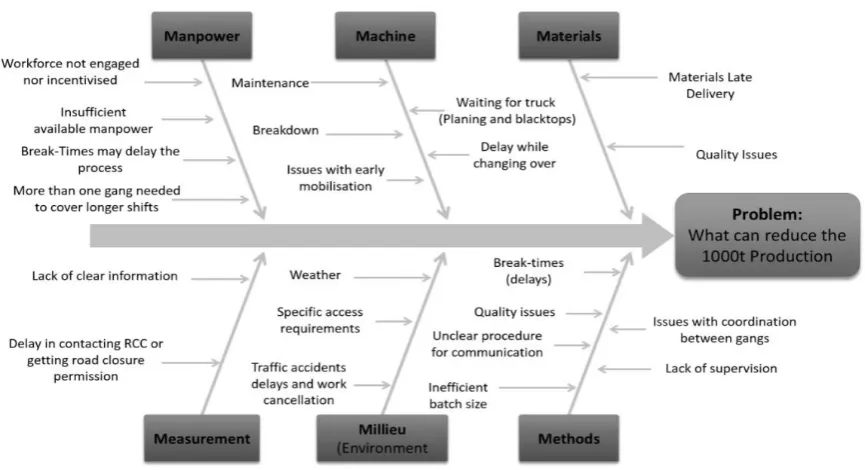
4.4 Root cause analysis
This Section presents root cause analysis from 6 different perspectives, with an end objective to improve the total production per shift. Figure 7 helps to give an understanding of the current issues of a surfacing operation system as well as to provide project strategy ideas to improve the output. Fishbone (Ishikawa) Diagram shows many constraints identified in road surfacing process review and their cause. The fishbone diagram was chosen due to the need of studying and analysing the possible reasons that can negatively affect the process output target. The four W’s questions should be answered and considered to analyse the fishbone diagram. “What” refers to
questions related to objects such as materials and machines, “Why” is used to answer questions concerned in
work conditions such as motivation of manpower. Moreover, “When” refers to problems related to time sequence
in the operation such as time needed in production. Finally, “Where” is concerned with effects related to the
<Insert Figure 7 here>
Material: Key raw materials required included asphalt and aggregate. Key risk factor involved reliance on a single supplier. Having an alternative supplier list provide more flexibility. Another constraining factor is aggregate plant capacity, which also can have a major effect on supplying the process with sufficient amount of aggregate to reach the target outputs. Other factors contributing to production output include the availability of trucks to deliver material and number of deliveries they can make.
Machines: Machines refer to the equipment, technology, and tools, required to perform the process. During road surfacing process, many machinery and tools are used, such as paver, roller, planer, pitch spraying machine. The following are some of the identified risks associated with machines:
- The capacity of the aggregate plant is limited to the night time working window it needs to operate within. - Changeover times within the laying process can have a big impact on output
- Machines can suffer breakdowns and need maintenance periodically during the laying process - Setup of any machine if not performed before material delivery will create a delay in the process.
Manpower (People): Site operatives need to have an adequate intellectual and physical capacity to cope with long duration shifts, varying from 8 to 13 hours. Moreover, the paving operations require high attention to details such as alignment of the asphalt truck to the paver. Furthermore, operator’s reliability is demanded to perform the process without errors. In this context:
- Shift patterns can be a limiting factor
- Since the working window was extended, more than one shift might be required. That could mean working part shifts, which may be inefficient or impractical
- The operatives lose out and may resist different and longer working hours for the same pay
- People and management may be a constraint as they currently tend to avoid risks; this can change over time.
Method (process): Methods refer to the performed process and the particular requirements for operating them. Lean production plays a major role to increase the productivity and the product quality while reducing the waste and cost. Key factors include:
- The type of contract will influence behaviour - Approach to risk, giving confidence to all concerned
- Programme planning; can positively affect many of the above constraints through balanced planning. - Pick the right gang configuration specific for each type of job
Information (Measurements). Measurements or information refers to the generated data from the different processes that are used to evaluate the quality.
- Loops will affect the process. However, that said loops affect tonnage but not necessarily utilisation. - Most of the improvement made would also improve the loop process in that more could be done on each
shift.
- The design of the product will affect the process i.e. deeper surfacing may require periods of curing between layers.
Figure 8 below represents the root cause analysis done above in a fish bone structure for better understanding and visualisation.
5. Simulation Model Design
The definition of the simulation scope is crucial for defining the analysis boundaries. Clearly defined scope of simulation system and boundaries could result in more useful simulation. The scope of simulation development in this study is limited to all activities involved from road surfacing activity start (i.e. from the time of road closure for surfacing purpose) till the road is open again. Programming of the project, the constraints of material deliveries or what goes on at asphalt plant/quarry level are beyond the scope of the presented simulation.
After defining the boundaries, it is important to identify key assumptions of how the system being studied, act together with its defined external environment (Beaverstock, Greenwood, & Nordgren, 2014). The following assumptions were considered in building the simulation model. Preparation and logistic activities were included in the model, taken as fixed timings as measured on site, and are not part of the analysis. The simulated operation activities included planing, sweeping and pitch spraying, paving, rolling, white-lining, and testing. Any sub-activities within each one of these sub-activities is not considered. All required material in the process is assumed to be always available and delivered on time. Downtime of equipment is not included in the simulation. Also, the Simulation is based on paving 45mm thick surface course. Figure 9 shows the developed simulation model in a software called Flexsim. Figure 10 below displays the 3d developed simulation of the equipment and process.
The research has focused on addressing waste inherent in pavement laying process. Even though external variables could possibly influence pavement process, those were ignored to allow for in-depth focus on process under consideration. This has been acknowledged as one constraint of the analysis presented.
<Insert Figure 9 here>
<Insert Figure 10 here>
In modelling the random elements within the road surfacing process, it is important to replace time certain components with a probability distribution. Three randomly distributed components are used: asphalt inter-arrival delivery, asphalt truck position time, and paving times. When analysing the system using simulation, times from these distributions can be ‘sampled’ and used to recreate a typical cycle of the process. The simulation of multiple cycles can then provide attributes of a particular operative set-up, such as overall time and average planing or paving rates. To get a realistic simulation model, actual data from site operations was used to ensure that model produced is realistic. According to (Smith, 1998), the steps of modelling a simulation model involve the following:
a. Gathering of actual data
b. Probability distribution selection
c. Generation of variates (random samples) from these distributions d. Simulation of resurfacing operations
e. Experimental analysis of surfacing operations.
To determine the probability distributions that are used to model the resurfacing process, historical data collected over 115-night shifts over a six months’ period was used. To select the suitable Probability Distribution, the historical data collected from 115-night shifts was analysed and tested against Anderson-Darling normality, using a statistical distribution software application (i.e. Minitab 17). Since the paving process constitutes a major operation, other subsidiary processes e.g. planing were assumed to match the production rate of the paver. However, detailed analysis of data indicates the average time for planing is 2.17 tonne/minute, and for paving it is 2.19 tonne/minute (Figure 11).
The following calculations were done to have unified units to be used in FlexSim: Assumingprocess flow-item equals one (1) tonne of asphalt. For Paving, the average paving rate is 2.19 tonne/min i.e. 131.4 tonne/hr, which means that (1) tonne requires 27.40 sec to be paved.
Paving is a rehabilitation process and is not treated as a typical construction project. It has more resemblances with manufacturing when observed at as a process. It is prevalent to use common distribution in manufacturing processes. Secondly, authors needed to find the average output of a typical paver to simulate various what-if scenarios. That was obviously done using hand calculations and then validated using Anderson-Darling test. This is the reason common distribution was used instead of beta, which is usually used in construction projects. 5.1.
Simulation outputs and Validation
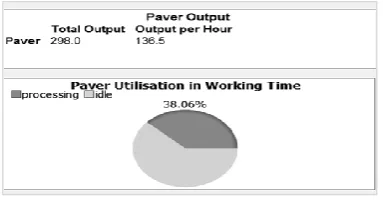
With a small difference in values, the simulation outputs came as a confirmation of the need to improve the current state as the percentages of paver utilisation is considered to be low compared to the permissible working window of the shift. The paver is working only for thirty-eight percent (38%) of the time starting from road closure until the road is open again (Figure 12). These outputs and percentages provide a credible evidence of the waste existence in the process of road surfacing. It can be concluded that the major waste in the process is in the form of “waiting” for the paver to start processing. In the existing process, the aggregate is called and requested only when the planing process has started, which puts the paving process on hold for about two hours until the material is delivered even though the road has been prepared for laying of asphalt (i.e. the road is planed, swept, and sprayed). There is an opportunity for process improvement presented by applying lean concepts to eliminate the identified waste by shifting the start time of the paver ahead. To do so, the request of material delivery has to be done before the start of planing process. The processing duration of paver is relatively short considering the working window of the shift. Another opportunity for improvement is presented in extending the operation time of the paver, which means requesting material early, and more planed, swept, and sprayed surfaces.
<Insert Figure 12 here>
Figure 13 illustrates simulation model of the improved state. Key improvements involved an order of material before the start of on-site activities. Because of increased of shift size and early commencement of pavement operations, overall paver utilisation has reached up to 67%.
To validate a simulation model, there are two required categories of data. Firstly, there is need to collect robust and detailed data from the job site. Secondly, for validation purpose, empirical data on production rates and machine utilisation rates are required, to allow for a comparison with the model output. The output created by a DES simulation model consists of results mimicking the physical project for the model to be validated. Both categories of data came from various sources including, company's sheets, reports, site observations. Also, some scenarios were simulated to validate the model and they produced the following results:
<Insert Figure 13 here>
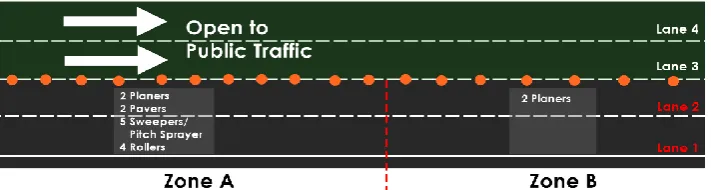
5.1.1 Scenario No.1: Creating Zones within the job site and increasing the number of Planers and Pavers. The first scenario assumes dividing the job site into two (2) equal zones (Zone A & B, as illustrated (Figure 14). Each zone has its planers, one for each lane, while maintaining two (2) lanes closed for resurfacing and two lanes open to public traffic. Both zones shares two (2) pavers, five (5) sweepers/pitch-sprayers and four rollers. In the same time, the scenario maintained the same working window. Key expected outcome is increased production in laid asphalt.
Simulation output is illustrated in Table 3, with total production rate increased up to two times (i.e. 276.9 Tonne/hour) the normal production rate. The simulation shows that the utilisation of pavers through the working window remains the same, despite added machinery with an average utilisation rate of 65.3%. As a result, an increment in the values of total production and production rate was expected, and the outcomes of simulation met these expectations. Even though production output has increased, the added cost because of extra machines should also be taken into account.
Table 3 showing results of Scenerio1
Scenario 1: Using Two pavers and closing two lanes together
Paver total output Paver Avg. output Paver 1 utilization Paver 2 utilization
1892 Tons 276.9 Tons/hour 65.3% 65.3%
5.1.2 Scenario No.2: Providing a 30 min break from 2:00-2:30 am
This scenario focuses on measuring the impact on production rates of a 30-minute worker break from 2:00 am to 2:30 am. Single paver operations are assumed. A 30-minute break resulted in a decrease in total production and production rate. 30-minute break lead to total asphalt laid decreasing to 865 Tonnes in comparison with the previous scenario of 1892 Tonnes output. The production rate was recorded as 126.6 Tonne per hour, respectively. The utilisation of Paver through the working window shrank by 5.6%. A 30-minute break could lead to significant delays in larger projects. As a result, staggered break times are suggested, in which each team takes its break in a manner that does not affect the flow of work.
Table 4 showing results of Scenerio2
Break from 2:00-2:30 am
Paver total output Paver Avg. output Paver utilization
865 Tons 126.6 Tons/hour 59.7 %
5.1.3 Scenario No.3: Forecasting the required time to carry out a certain job
3rd Scenario assumes limiting motorway closures to a 6 km stretch. Two lanes at a time are closed for public traffic, and a 45mm thick asphalt is to be overlaid. Each closure interval (2 lanes) requires one (1) extra hour to complete resurfacing of the closed lanes. The extra hour is required at the paving operation. Thus, an additional investigation of the paving operation is required in order to accelerate the operation and reduce the required time by one hour instead of adding one hour to it. Finally, resurfacing of the entire closure area requires an hour to be added or eliminated from each shift.
Table 5 showing results of scenario 3
6. Discussion
Literature review indicated that while there is an uptake of lean concepts and tools within the manufacturing, process and construction industry; there are very few examples and limited use of value stream mapping and process simulation within road transportation context. There is a need for integrated approaches that allow for a
Scenario 3: Closing two lanes at once
Paver total output Paver Avg. output Paver 1 utilization Paver 2 utilization
comparison between the performances of such practices to the existing systems (Detty & Yingling, 2000). An Integrated Value Stream Map and Discrete Event Simulation Framework based on the review of literature presented a systematic description of how future VSM can be validated before implementation and achieve benefits. McDonald, Aken, & Rentes (2002) explained how the integration might be able to predict the outcomes of dynamic situations that VSM is not capable of addressing alone. Once the current state is mapped, the workflow splits into two paths where DES and VSM are conducted in parallel. The flow diagram of the integrated framework is already shown in Figure 1.
By implementing a similar framework in Highways sector, critical path analysis and value stream maps can be visualised, validated and amended as various factors change. Simulation can be performed at micro and macro level in resurfacing operation. For instance, it can map a truck travelling from asphalt quarry to work site and experiment various situations when this truck is delayed or broken down. Similarly, over all process can be drawn This research dealt with the complicity of adopting Lean concepts and process simulation technology in changing the construction industry. It presented a systematic approach for the application of lean construction concepts and tools into computer simulation models. Moreover, paper demonstrates how road surfacing productivity can be enhanced by applying lean concepts and tools. These improvements are tangible; noticing the waste (waiting) was eliminated or reduced as well as non-value added activities. The hourly production rate, resource (paver) utilisation, and project duration were improved dramatically, as a result of implementing Lean concepts and tools. In terms of the simulation, the numbers and rates shown in models output confirm the validity of the built models which open opportunities of producing a template model that includes deeper and more detailed factors that could affect the entire process, such as distance between job site and asphalt plant; failure of machines; delays caused by work accidents, severe weather conditions; delivered material is failing under initial inspection and more site observation and detailed collection of data are required in order to build a further realistic model.
Material delivery time is also linked with the working style of gang on site. One of the major cause of delay in the everyday work was that after traffic management started and the gang arrived on site, material was called as the last step. It then took time for the material to arrive on site In the improved process shown in figure 5, material was called before the traffic management was started, which gave enough time for them to arrive.
It was noticed during data collection and analysis stage that road surfacing contractor only used the paving machine for 2 hours out of the 8 hour working window allowed. This decreased the efficiency of the paver to 25% which is pure waste of resources, however, after improving the process, it reached up to 75%. Road users are one of the most important stakeholders that will benefit from the positive implications of research. Private resurfacing companies and transport departments can optimise their overall process and style of working by comparing their end-to-end process and work plans with ones mentioned in this paper. It will boost the productivity of equipment like planers, pavers and other machines used in resurfacing operations.
7. Conclusion
The purpose of this research was to investigate the relationship between DES and VSM and then apply it in Highways operations perspective to achieve higher production rates and minimum road closures. Different scenarios have been performed in the simulation to optimise the process and the best practice can be chosen after validating it through focus group discussions or workshops etc. It has been seen in the case study that just by changing the working style, huge benefits can be achieved.
implications that can be gained by the society and motorists from the gains made through the ‘creation of zones’ as illustrated in Scenario No. 1. (i.e. see Figure 14).
8 References
Abdulmalek, Fawaz A. and Jayant Rajgopal. "Analyzing The Benefits Of Lean Manufacturing And Value Stream Mapping Via Simulation: A Process Sector Case Study". International Journal of Production Economics 107.1 (2007): 223-236. Web.
Agyapong-Kodua, K., J. O. Ajaefobi, and R. H. Weston. "Modelling Dynamic Value Streams In Support Of Process Design And Evaluation". International Journal of Computer Integrated Manufacturing 22.5 (2009): 411-427. Web.
Alvarez, R., Calvo, R., Peňa, M., & Domingo, R. (2009). Redesigning an Assembly Line through Lean Manufacturing. The International Journal of Advanced Manufacturing Technology, 49(9), 949-958.
Arditi, D., Ayrancioglu, M., & Lee, D. (2003). Night-time construction: Evaluation of Worker Safety Issues.
Chicago: Department of Civil and Architectural Engineering, Illinois Institute of Technology.
Banks, J. (1998), “Principles of simulation”, in Banks, J. (Ed.), Handbook of Simulation: Principles, Methodology, Advances, Applications, and Practice, Wiley, New York, NY.
Beaverstock, M., Greenwood, A., & Nordgren, W. (2014). Applied Simulation: Modeling and Analysis using FlexSim (Fourth ed.). Orem, UT USA: FlexSim Software Products.
Bhasin, S. (2015). Lean Management Beyond Manufacturing. New York: Springer.
Bose, T. K. (2012). Application of Fishbone Analysis for Evaluating Supply Chain and Business Process- A Case Study on the St James Hospital. Internation Journal of Managing Value and Supply Chains, 3(2), 17-24. Detty, R., & Yingling, J. (2000). Quantifying Benefits of Conversion to Lean Manufacturing with Discrete Event Simulaton: A Case Study. Iternational Journal of Production Research, 429-445.
Dhebar, A. (1993), “Managing the quality of quantitative analysis”, Sloan Management Review, Vol. 34 No. 2, pp. 69-75.
Douglas, K., & Park, S. (2003). Selection Criteria for Using Nighttime Construction and Maintenance Operation, Final Report. Washington DC: Oregon Department of Transportation Research Unit and Federal Highway Administration.
Dozzi, S., & AbouRizk, S. (1993). Productivity in Construction. Ontario, Canada: Institute for Research in Construction, National Research Council.
Elrahman, O. A. (2008). Night-Time Road Construction Operations: Synthesis of Practice. Retrieved from New York State Department of Transportation, Transportation Research and Development Bureau:
https://www.dot.ny.gov/divisions/engineering/technical-services/trans-r-and-d-repository/Final%20Night%20Time%20Report.pdf
Fishman, G.S. and Kiviat, P.J. (1968), “The statistics of discrete event simulation”, Simulation, Vol. 10 No. 4, pp. 185-95.
Gurumurthy, Anand and Rambabu Kodali. "Design Of Lean Manufacturing Systems Using Value Stream Mapping With Simulation". Journal of Manufacturing Technology Management 22.4 (2011): 444-473. Web.+ Halpin, D. W. (2003). A Construction Process Simulation Web Service. Winter Simulation Conference (pp. 1503-1509). New Orleans: IEEE.
Hinze, J., & Carlisle, D. (1990). An Evaluation of the Important Variables in Nighttime Construction. Seattle: Transportation Northwest (TransNow), Department of Civil Engineering, University of Washington.
HM Treasury. (2015). National Infrastructure Pipeline December 2014. Retrieved from
https://www.gov.uk/government/uploads/system/uploads/attachment_data/file/389490/National_Infrastructur e_Plan_December_2014_Pipeline_11122014.xlsx
Jergeas, G. (2009). Improving Construction Productivity on Alberta Oil and Gas Capital Projects. Alberta: University of Calgary.
Keebler, J.S. (2006), “Rigor in logistics and supply chain models”, Council of Supply Chain Management Professionals
Labban, Ramzi et al. "A Discrete Event Simulation Model Of Asphalt Paving Operations". Winter Simulations Conference (WSC). Alberta: IEEE, 2013. 2-7. Web. 19 June 2016.
Lasa, I., Laburu, C., & Vila, R. (2008). An Evaluation of the Value Stream Mapping Tool. Business Process Management Journal, 14(1), 39.
Law, A.M. (2006), Simulation Modeling and Analysis, McGraw-Hill, New York, NY
Law, A. M., & Kelton, W. (2000). Simulation Modeling and Analysis (3rd ed.). New York: McGraw Hill. Lewis, P. A., & Orav, E. J. (1989). Simulation Methodology for statisticaians, Operations Analysts, and Engineers (Vol. 1). Wadswroth & Brooks/Cole.
Lian, Y.-H. and H. Van Landeghem. "Analysing The Effects Of Lean Manufacturing Using A Value Stream Mapping-Based Simulation Generator". International Journal of Production Research 45.13 (2007): 3037-3058. Web. 3 May 2016
Manuj, I., Mentzr, J.T. and Bowers, M.R. (2009) "Improving the rigor of discrete‐event simulation in logistics and supply chain research", International Journal of Physical Distribution & Logistics Management, Vol. 39 Iss: 3, pp.172 - 201
Marvel, Jon H and Charles R. Standridge. "Simulation-Enhanced Lean Design Process". Journal of Industrial Engineering and Management 2.1 (2009): n. pag. Web. 12 June 2016.
Marzouk, M., Fouad, M. and El-Said, M., 2011. Simulation of resurfacing pavement operation of highways
under lane closure condition. InProceedings of the 28th International Symposium on Automation and Robotics
in Construction, Seoul, Korea.
Merrow, W., Sonnhalter, R., Somanchi, R., & Grifith, A. (2009). Productivity in the UK engineering Construction Industry. Reading, UK: Independent Project Analysis, Incorporated.
Moore, A. (2015). Area 9 Pavement Process Improvement. London: Highways England.
Nance, R. E. (1993). History of Discrete Event Simulation. Blacksburg, Virginia: Department of Computer Science, Virginia Polytechnic Institute and State University.
Office for National Statistics. (2015, August 14). A-Output in the Construction Industry, June 2015 and Quarter 2 (Apr to June) 2015. London. Retrieved from Office for National Statistics:
http://www.ons.gov.uk/ons/rel/construction/output-in-the-construction-industry/june-2015/rft-1.xls Rebholz, F., Al-Kaisy, A., & Nassar, K. (2004). Night-time Construction: Evaluation of Construction Operations. Urbana, Illinois: Department of Civil and Environmental Engineering.
Rother, M., & Shook, J. (2003). Learining to See: Value Stream Mapping to Create Value and Eliminate Muda (3 ed.). Brookline: Lean Enterprise Institute.
Sargent, R.G. (2007), “Verification and validation of simulation models”, Proceedings of the 2007 Winter Simulation Conference, pp. 124-37.
Seth D, Seth N, Goel D, (2008),"Application of value stream mapping (VSM) for minimization of wastes in the processing side of supply chain of cottonseed oil industry in Indian context", Journal of Manufacturing Technology Management, Vol. 19 Iss 4 pp. 529 - 550
Singh B.S and K. Sharma, (2009),"Value stream mapping as a versatile tool for lean implementation: an Indian case study of a manufacturing firm", Measuring Business Excellence, Vol. 13 Iss 3 pp. 58 - 68
Smith, S. D. (1998). Concrete Placing Analysis Using Discrete-Event Simulation. Proc. Instn Civ. Engrs Structs & Bldgs,, 128, 351-358.
Solding, P and P Gullander. "Concepts For Simulation Based Value Stream Mapping". Winter Simulation Conference. IEEE, 2009. 2231 - 2237. Web. 29 May 2016.
Towill, D.R. and Disney, S.M. (2008), “Managing bullwhip-induced risks in supply chains”, International Journal of Risk Assessment & Management, Vol. 10 No. 3, pp. 238-62.
Womack, J.P., Jones, D.T. and Roos, D. (1990), The Machine that Changed the World: The Story of Lean Production, Rawson Associates, New York, NY
Yikun Xie, Qingjin Peng, (2012),"Integration of value stream mapping and agent-based modeling for OR improvement", Business Process Management Journal, Vol. 18 Iss 4 pp. 585 - 599
Yu, Haitao et al. "Development Of Lean Model For House Construction Using Value Stream Mapping".
9 Appendix
Figure 1 DES-VSM Integration Framework (McDonald, Van Aken, & Rentes, 2002)
[image:19.595.44.516.517.714.2]Figure 3 VSM of As-Is Road Surfacing Process Operations
Figure 5 Road Resurfacing Operation, Improved Process (Taken From Moore, A. (2015) )
[image:21.595.39.555.294.522.2]Figure 6 Data Collection Methods
Figure 8 Root Cause Analysis
Figure 9 FlexSim Model Representation of “As-Is” State of Road Resurfacing (Software used FlexSim)
[image:22.595.48.564.569.716.2]Figure 11 Summary for Paving Rates (Tonnes/min)
Figure 12 Discrete Event Simulation Output of the based on as-is process (FlexSim)
[image:23.595.146.465.552.663.2]