Parallel versus Perpendicular plots
A comparative study
Raja Jamilah Raja Yusof, Roziati Zainuddin
Faculty of Computer Science and Information TechnologyUniversity of Malaya, 50603, Kuala Lumpur, Malaysia. rjry@um.edu.my, roziati@um.edu.my
Zulkifli Mohd Yusoff
Academy of Islamic StudiesUniversity of Malaya, 50603, Kuala Lumpur, Malaysia zulkifliy@um.edu.my
Abstract—A comparison study between parallel and
perpendicular (scatter plot) plot visualization techniques are addressed. Comparison discussion focuses on the disadvantage and advantages of the two techniques and a GOMS analysis of the related tasks based on a system called the PaCQ interface.
Keywords-parallel coordinate; scatter plot; information visualization; multidimensional; GOMS analysis;
I. INTRODUCTION
In this paper the comparison between two types of plots will be discussed, the parallel and the perpendicular plots. The discussion focuses on visualization of multidimensional variables that is projected into 2 dimensional displays. A parallel plot is essentially a type of visualization technique which some has categorized under the geometry projection typed [1][2][3]. The hyperbox [4] and the hyperslice [5] visualization are also under the geometry type. There are also many kinds of perpendicular plots (which use the Cartesian system) that had been developed for data analysis projecting multidimensional variables into 2 dimensional displays such as that of a pixel based typed. The scatter plot and line charts are examples of pixel based visualization plots. Although simple plots are also possible using scatter plot and line charts, discussions will include techniques used to make multidimensional variables possible in these plots.
Emphasis of the discussion is therefore the comparison between parallel coordinate (one type of geometry projection visualization technique) and pixel based plots under the family of scatter plot and line charts. The comparison between parallel coordinate and scatter plot is particularly chosen because of the principle of duality, the two techniques are somewhat interchangeable between each other and many literatures discuss and compare these two techniques [6][7][8]. The main outcome of this paper will be an importance for those who will be seeking to visualize multidimensional with relatively medium size data. With the current display technology, the parallel and the scatter plots are suitable in handling data up to thousands. However, other issues such as the task related in interpreting the data can be a factor that should not be ignored.
This paper will continue with the discussion of perpendicular and followed by the parallel coordinate plot
advantages and disadvantages. Next, the comparison of parallel coordinate and scatter plot matrix using the GOMS analysis based on an interface system called PaCQ.
II. OVERVIEW
A point can be represented in the perpendicular plot in a Cartesian system as , and a line as l: y= mx + b. The distance d, between the point and the line is represented by
d=|m - +b|/√1 (1) However, a point in the Cartesian system is represented by a line in the parallel plot. This is referred to as the principle of duality. A simple representation of this concept is illustrated in [9]. Assuming that the Cartesian system plane is represented as , where N=2 since it is 2-dimensional and the parallel plane is representing the Cartesian system plane. A line in the plane, ℓ can be represented in the plane as many lines, ℓ , where i correspond to a point in the line,
ℓ , : = +
ℓ : ℓ , : = +
. . . .
ℓ , : = +
where m and b are values related to the slope and the point on the parallel lines. Figure 1 illustrates an example of the concept.
Taking this further as a general point, [9] indicated that the point of intersection can be represented by
: , , m 1 (2) (3, 0)
(0, 3)
0
3
x
y
y x
(a) (b)
Figure 1: (a) the line ℓ in the Cartesian plane (b) Four selected points on the line ℓ in the parallel plane
ℓ : y=mx+b
[image:1.595.325.535.523.608.2]where is the distance between the two adjacent parallel axis and m is the slope of the line in the plane.
III. PERPENDICULARPLOTS
The perpendicular plots are referred to plots that use the x and y coordinates in a Cartesian system. As mentioned before, scatter plot and a line chart are example of perpendicular plots. These plots can be related to two dimensional variables although multidimensional variable are also possible to be displayed by overlapping [2], increasing data display density for display space efficiency [10] and small multiples [10] techniques. These techniques give rise to new type of charts such as stacked graphs, horizon graphs [10] and vizrank [2].
Interpreting a scatter plot would involve identifying correlations, functional dependencies, clusters and other interesting relations [1][11]. Sometimes these could be detected by looking at direction, forms, strength and outliers of the plot. For example, if the scatter plots forms a line with negative or positive slops, then a negative or positive relation could be implied between the attributes involved. Based from these, relations of the attributes involved could be predicted. However, if the dimensionality increases, the number of different plots to be inspected increases by m(m-1)/2, where m
is the number of attributes in the set of data. The data can be differentiated via color, symbol or shapes [2][8][11]. Values of attributes are represented as points and only the position is effected within the perpendicular x, y axis and not its size, shape and color [2].
A. Advantages and disavantages
The disadvantage of this plot is that only limited amount of data items can be visualized in the screen [3] although this could be overcome. Analysis of the scatter plots for example can be difficult and time consuming since the x and y projection increases exponentially with the number of attributes and tend to have O(N2) complexity [9][2]. In a larger dataset the points can overlapped and not perceived [10][2][3]. Ref. [13] estimated that a human cannot distinguish between two points closers than an area of 14 X 14 virtual pixels. This particular problem is called the occlusion problem, where occlusion is the number of identifiable points in relation to any other visible points [12]. In addition, sometimes data need to be compared across multiple charts [10][8] and this will get difficult if the data set is large.
The advantage is that these plots already exist for such a long time and are popularly utilized [11] amongst many people that had learned how to interpret them easily. The perceptibility of the data characteristic is therefore considered reliable. [10] refer this as the graphical perception.
B. Application and tools
There are several operations used with scatter plots especially to reduce cluttering and to enhance the occlusion percentage. Jittering and distortion can be used to promote
occlusion [13]. While jittering displaces the overlapped items around their original position so that they are visible, distortion presents more detail in less dense area and less detail in more dense area. Others operation involves are zooming (making the display bigger or smaller), panning (scrolling or moving the display to the intended position), filtering and selection detail-on-demand (choosing items to be analyzed), brushing (highlighting) and 3D manipulation [11].
Application of scatter plots, line charts and their families is not surprisingly wide. It had been use in contact of visualization of geographical data (such as NASA earth observation database), molecular biology project [1], financial data (such as stock prices and exchange rates), public policy (such as crime rates) [10] just to mention a few. Many of the targeted users are in the category of experts. The related tools for scatter plots are such as VisDB [1], VizRank [2], Spotfire [11a][14], XGobi [15a] and others.
IV. PARALLEL PLOTS
The parallel plot however, refers to variables that are multidimensional and these are arranged onto parallel axes equidistance from each other [9][1][8]. To illustrate further, if one were to transform the perpendicular plot explained in the previous section, the x and y axes will be plotted in parallel to each other. Instead of representing attributes as points, it is represented by m-1 connected line segments [2]. Adding a third dimension for example the z axis, will end up with another axis in parallel to the x and y axes. There are also a few types of parallel coordinate plot such as the extended parallel coordinate [15], the extruded parallel coordinate [16], scattering points in parallel coordinate [11] and 3-D parallel coordinate [17]. All these different types of parallel coordinate are created as an attempt to solve some of the problems related to the plot.
Interpreting parallel plots is also possible by looking at certain kind of patterns. A positive correlation between two attributes shows horizontal parallel lines without or minimum intersection between two adjacent vertical axes of the attributes. In contrasts a negative one shows intersection of lines on a point in between two vertical axes of the attribute concerned [9][18]. Cluster can also be identified by their edges within any pair of adjacent axes being closed to a point (which corresponds to a two-dimensional projected line in the Cartesian system) [8]. This can be seen since a point in the Cartesian system is represented by a line joined between two adjacent axes in the parallel plot. Figure 1(b) illustrates this.
A. Advantages and disavantages
not difficult to manipulate and can result in a more accurate interpretation of data even by novice users [19][20][21]. Also, parallel coordinate is not suitable for visualizing large data sets which are more than the range of hundreds to thousands and the relationships between attributes can only be easily identified for two adjacent axes [17][22]. Rearranging of the axes can overcome the mentioned problem.
The advantage of these plots is that it is considered as more effectively consuming the display space therefore increasing the amount of data a human can work with at the same time [10]. However, [17] found that 11 axes is the maximum threshold for a human to efficiently analyze the data. Also, N-dimensional properties can be visible from the screen [9].
B. Application and tools
The operations related to parallel plots are very similar to the scatter plots i.e. zooming, panning, filtering and selection, detail-on-demand, focus+context, linking+brushing [11][23][15] and 3D manipulation. There is also operation such as rearranging the axes in order to permit analysis between two adjacent axes [18][11].
Real application of parallel plots are also vast in number, in network attacks data [24], land satellite data [25], climate analysis [26], data envelopment analysis [30], fuel injection simulation [23], and others. The related tools for parallel plots usually include other types of visualization as well and these are such as GGobi [28], ComVis [23].
V. THE PACQ INTERFACE
The PaCQ interface was developed for supporting the Muslims of non-Arabic speakers to enhance their comprehension of an Arabic document called the Qur’an using the theory of word recognition. The problem faced by the non-Arabic speakers is not being able to comprehend what they read even though they are able to read the Arabic document. The reason is purely spiritual since the Qur’an is a source of guidance and is believed to be the word of Allah, God to the Muslims. PaCQ interface is targeted to support the Arabic word recognition process and therefore enhancing reading comprehension.
The PaCQ interface lets the user go through the Arabic document chapter by chapter which is called surah. Also, the user can browse the document sentence by sentence which is called ayat. The interface was built based on only 1/30 of the whole document and this is the 30th part or the last part of the document which is also named as Juz Amma. In browsing through the document, the user can add up their vocabulary to the list that will be stored in the system. The PaCQ interface lets the user see the overall percentage of their vocabulary in comparison to each surah. Also the PaCQ interface gives a comparison chart if all vocabulary is known in one surah and what percentage of these vocabulary words compared to other
surahs.
There are several variables sets involved:
• The Arabic word, A, where A ={ all Arabic words contain in Juz Amma}
• The Vocabulary words, V, where V ⊆ A
o This is because the vocabulary for a user in
relation to PaCQ is limited to only the Arabic words in Juz Amma
• The word count, C where C = { c’ ∈ ℕ } and ℕ is the set of positive natural numbers
• The corresponding Surah number, S where S = { s’ ∈ ℕ : 78 s’ 114}
o This is because the Surah that contains in
Juz Amma is from the Surah number 78 to
114
• The corresponding Ayat number, Y where Y = { y’ ∈
ℕ : y’ 46}
o This is because the maximum number of
Ayat / verse in Juz Amma is 46
• The percentage, T where T = { t’ ∈ ℕ : t’ 100} where ℕ is the set if natural numbers
The main relations between these variables can be written as
• = {(c, a, s, y):“There are c counts of Arabic word
a in Juz Amma and can be found in Surahs and Ayat
y” } where c∈ C, a∈ A, s∈ S and y∈ Y.
• = {(v, s, t): “There is T percentage of the vocabulary words V in Surah S”} where v ∈ V, s ∈
S, t ∈T.
• = { ( , , s, t): There is T percentage of Arabic words in Surah compared to other SurahsS in Juz
Amma and C count of Arabic words in the Surah S}
where : P( ) } and P( ) is exactly one Surah in
Juz Amma and s ∈ S, t ∈T.
VI. THE GOMSANALYSIS
In this section GOMS [29] analysis will be used to predict the time taken for a user to interpret information for the parallel and perpendicular plots. GOMS is one of task analysis methods contain a set of techniques on how to model task in terms of Goals, Operators, Methods and Selection Rules while using a graphical user interface. As all task analysis methods starts with analyzing the goal of the task, GOMS also starts with a goal of a task and decompose these tasks to smaller tasks up to the key-stroke level (for example mouse click, pressing a key on the keyboard, finding a target object on the screen, pointing to an object and others). Furthermore, the technique gives an estimated time to accomplish these key-stroke level tasks known as operators.
point, the parallel plot seems a better technique to adopt compared to the perpendicular one.
TABLE I. COMPARING PLOTS BASED ON RELATION
No. Relation to View
Parallel Plot Perpendicular Plot 1 800 intersecting
lines of Arabic word attributes - problematic BUT
panning or scrolling can be
avoided
800 symbols align next to each other
- problematic
2 1369 intersecting lines of base surah
and surah
comparison percentage – problematic BUT
panning or scrolling can be
avoided
1369 symbols align next to each
other - problematic
TABLE II. RELATION AND THE CORRESPONDING TASKS
Rela tion
Scenario/ Goal
Tasks Involved
What is the word with the highest count and where can this word be found?
R1G: Find the word with the highest count and where can this word can
be found S1:Find word
S1.1:Locate/identify count axis/ symbol
S1.2: Locate the highest count S1.3: Locate the corresponding
word
S2: Find where this word can be found
S2.1: Locate the corresponding
surah no.
S2.1.1: Locate/identify surah
axis/symbol
S2.1.2: Read the corresponding
surah no.
S2.2: Locate the corresponding
ayat no.
S2.2.1: Locate/identify ayat
axis/symbol
S2.2.2: Read the corresponding
ayat no. What is the
highest percentage
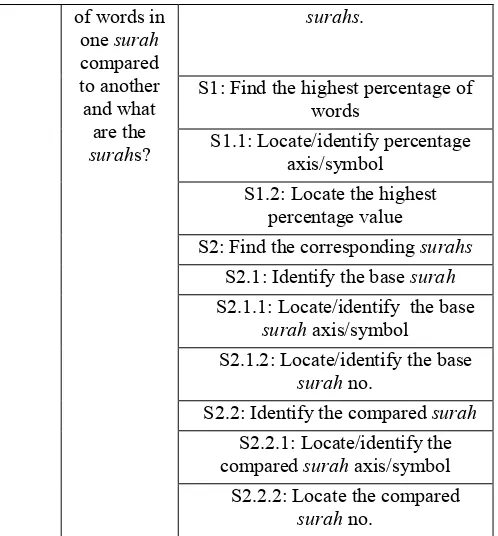
R3G: Find the highest percentage of words in one surah compare to
another and the corresponding
of words in
one surah
compared to another and what
are the
surahs?
surahs.
S1: Find the highest percentage of words
S1.1: Locate/identify percentage axis/symbol
S1.2: Locate the highest percentage value
S2: Find the corresponding surahs
S2.1: Identify the base surah
S2.1.1: Locate/identify the base
surah axis/symbol
S2.1.2: Locate/identify the base
surah no.
S2.2: Identify the compared surah
S2.2.1: Locate/identify the compared surah axis/symbol S2.2.2: Locate the compared
surah no.
A. GOMS analysis for relation
In order to carry out goal of relation , R1G, the lowest level tasks involve are identify count symbol, locate the highest count, locate the corresponding word, identify surah
symbol, read the corresponding surah no., identify ayat
symbol, read the corresponding ayat no.. In a perpendicular plot these tasks may involve other subtasks:
• Identify count symbol, can easily be accomplished by looking at the legend of the graph -1
• Locate the highest count, may involve other subtasks. In this case, the user may be confronting a display that is very cluttered; the highest point for the symbol attribute may appear the same as the second highest point. Therefore, user may need to zoom in to the particular point of interest which may be located anywhere along the horizontal axis (see Figure 2 for verification of this point of argument). Consequently, the subtask involved may be as the following:
o Select/located the area with the highest point
-2
o Vertical zoom into the area -3 o Read the highest count value -4
o Compare to next highest value (may involve
scrolling)
Scroll to the other potential highest point -5
Read the potential highest point – 6
Figure 2: Scatter plot graph
• Locate the corresponding word, involves the identification of the word with the highest count. As discussed previously, the words will be overlapping each other intensely that even if the vertical point had been zoom in, the horizontal line would still be cluttered. Therefore, the subtask involve may be the following:
o Click/mouse over on the highest point -8 o View the displayed word on the screen -9 • Identify surah / ayat no. can easily be accomplished
by reading the legend of the graph -10
• Read the corresponding surah / ayat no. There will be many corresponding surah/ ayat no. on the same vertical line corresponding to the highest count point and the Arabic word involve in this task scenario. User may find it difficult to identify all these surah /
ayat no. Furthermore, it is not possible to identify exactly for each surah no., the corresponding ayat no. All that will be traceable via perpendicular plot will only be the list of surah no. and the list of ayat no.. Therefore, the subtask involve:
o Ask the system to display out the specific
surah / ayat no. (which need to be further
decomposed in other subtasks) -11
In the parallel plot the same tasks as the above paragraph are involve as listed in Table II:
• Instead of identifying symbol, the user need to locate the count axis -1
• Locate the highest count; the user will also be confronting a cluttered display. However, there will not be much problem in comparing to the next highest point since the points are display vertically instead of horizontally in the perpendicular view. Therefore, the subtasks involved may be as the following:
o Select/located the area with the highest point
-2
o Zoom into the area – 3
o Read the highest count value -4
• Locate the corresponding word; at this point the words in the parallel plot will also be overlapping each other. Therefore, the subtask involve may be the following:
o Click the highest count value -5
This action can be connected to a filtering function. Once this value is clicked the system can automatically display the corresponding related attribute which is the word, the surah no. and the ayat no.. All other related values can be faded out or temporarily filtered off the display screen consequently simplifying all subtasks that comes after this.
o View the displayed word on the word axis
Locate the word axis -6 Read the word – 7
• Locate surah / ayat axis - 8
• Read the corresponding surah/ ayat no.. At this point in the parallel plot there will also be many possible
surah and ayat related to the highest word count but
it is possible to read all the surah and ayat no.. -9
Therefore, we found that to achieve a goal related to , the number of subtask involve in the perpendicular plot is more then 11 while in the parallel plot, there are 9 subtasks. At this point also the parallel plot seems a more efficient technique to adopt compared to the perpendicular plot.
B. GOMS analysis for relation
In order to carry out goal of relation , R3G, the lowest level tasks involve are identify percentage symbol, locate the highest percentage value, identify the base surah symbol, identify the base surah no., identify the compared surah
symbol, identify the compared surah no.. In a perpendicular plot these tasks may involve other subtasks:
• Identify the percentage symbol, as discussed previously; this can be done easily by looking at the legend. -1
• Locate the highest percentage value. The subtask involve is similar to identifying the highest count value in relation , but this time the overall display view will be more condensed. This is due to the 37 X 36 possibilities of comparison between surahs. Therefore the subtask involved may be as the following:
o Select/located the area with the highest
percentage -2
o Vertical zoom into the area above -3 o Read the highest percentage value -4 o Compare to next highest value (may involve
scrolling)
0 20 40 60 80 100
1 3 5 7 9 11 13
Percentage of words in Base Surah compared to other surah
Base Surah
Surah
Scroll to the other potential highest percentage -5
Read the potential highest percentage – 6
o Interpret the comparison -7 • Identify base surah symbol – 8
• Identify base surah no.. As there will be37 X 36 comparisons between surah, as mentioned earlier, the x axis will be very cluttered. Therefore, this particular task would be very similar to locating the highest percentage value which involves 5 subtasks. – 9-13
• Identify the compared surah symbol - 14
• Identify the compared surah no.: subtasks are very similar to identify base surah no., therefore this will involve 5 subtasks. 15-19
In the parallel plot, the subtasks involve are as the following:
• Locate the percentage axis -1
• Locate the highest percentage value: in this case, since the scale of percentage from 0-100 is at a detectable value, the user can follow the sequence of task as in relation to locate the highest count, which will involve 3 subtask – 2-4
o At this point the user can use a filter
function such as clicking on the highest percentage value that will display the corresponding attributes (the base and
compared surah). This action will automatically reduce the subtasks that comes next after this one - 5
• Locate the base surah axis -6
• Locate the base surah no. -7
• Locate the compared surah axis -8
• Locate the compared surah no. - 9
Therefore, we found that to achieve a goal related to relation , the number of subtasks involve in the perpendicular plot is 19 while in the parallel plot, it is 9. At this point also the parallel plot seems a more efficient technique to adopt compared to the perpendicular plot.
CONCLUSION
The comparison between the two plots through literature shows very similar outcomes in terms of features that the plots can support. In terms of visualizing multidimensional attributes, attribute representations, pattern interpretation, application and data cluttering, both plots seems to have similar ratings. However, in general, perpendicular plots are more popular and have a better perceptibility to users. Although many assumed that the parallel plot is better for novice users there are empirical evidence that the performance of the novice users using parallel plot is better.
In the last part, the contextual comparison between two plots using GOMS analysis shows that to achieve goals related to relations and the estimated subtasks involve are fewer in the parallel plot compare to the perpendicular plot. Therefore, it can be concluded that the parallel plot is a better plot to be adopted in the context of the PaCQ system interface.
REFERENCES
[1] Keim, D. A. and Kriegel, H. 1996. Visualization Techniques for Mining Large Databases: A Comparison. IEEE
Trans. on Knowl. and Data Eng. 8, 6 (Dec. 1996), 923-938.
[2] Leban, G., Zupan, B., Vidmar, G., and Bratko, I. 2006. VizRank: Data Visualization Guided by Machine Learning.
Data Min. Knowl. Discov. 13, 2 (Sep. 2006), 119-136.
[3] Ankerst M., Keim D. A. and Kriegel H.-P.: "Circle Segments: A Technique for Visually Exploring Large Multidimensional Data Sets", Proc. Visualization '96, Hot Topic Session, San Francisco, CA, 1996.
[4] Alpern, B. and Carter, L. 1991. The hyperbox. In
Proceedings of the 2nd Conference on Visualization '91 (San
Diego, California, October 22 - 25, 1991). G. M. Nielson and L. Rosenblum, Eds. IEEE Visualization. IEEE Computer Society Press, Los Alamitos, CA, 133-139.
[5] van Wijk, J. J. and van Liere, R. 1993. HyperSlice: visualization of scalar functions of many variables. In
Proceedings of the 4th Conference on Visualization '93 (San
Jose, California, October 25 - 29, 1993). D. Bergeron and G. Nielson, Eds. IEEE Visualization. IEEE Computer Society, Washington, DC, 119-125.
[6] Yonghong Xu; Wenxue Hong; Xin Li; Jialin Song; , "Parallel Dual Visualization of Multidimensional Multivariate Data," Integration Technology, 2007. ICIT '07. IEEE
International Conference on , vol., no., pp.263-268, 20-24
March 2007
[7] Grinstein, G. G., Hoffman, P. E., and Pickett, R. M. 2002. Benchmark development for the evaluation of visualization for data mining. In Information Visualization in Data Mining and
Knowledge Discovery, U. Fayyad, G. G. Grinstein, and A.
Wierse, Eds. Morgan Kaufmann Publishers, San Francisco, CA, 129-176.
[8] Shuo-Yan Chou, Shih-Wei Lin, Chia-Shin Yeh, Cluster identification with parallel coordinates, Pattern Recognition Letters, Volume 20, Issue 6, June 1999, Pages 565-572, ISSN 0167-8655.
[9] Inselberg A., Parallel Coordinates, visual multidimensional geometry and its application, Springer, London, 2009.
[10] Heer, J., Kong, N., and Agrawala, M. 2009. Sizing the horizon: the effects of chart size and layering on the graphical perception of time series visualizations. In Proceedings of the 27th international Conference on Human Factors in
Computing Systems (Boston, MA, USA, April 04 - 09, 2009).
CHI '09. ACM, New York, NY, 1303-1312.
Visualization and Computer Graphics, pp. 1001-1008, November/December, 2009
[11a] Ahlberg, C. 1996. Spotfire: an information exploration environment. SIGMOD Rec. 25, 4 (Dec. 1996), 25-29. [12]Bertini, E. and Santucci, G. 2006. Give chance a chance: modeling density to enhance scatter plot quality through random data sampling. Information Visualization 5, 2 (Jun. 2006), 95-110.
[13] Bertini, E., & Santucci, G. (2005). Is it darker? improving density representation in 2d scatter plots through a user study .
Proc. of SPIE Conference On Visualization and Data Analysis.
San Jose Marriott and San Jose Convention Center, San Jose, California, USA .
[14] TIBCO Spotfire, 2010. http://spotfire.tibco.com/, last accessed 11 May 2010.
[15] Hauser, H., Ledermann, F., Doleisch, H., 2002. Angular brushing of extended parallel coordinates, In: Proceedings of the IEEE Symposium on Information Visualization
(InfoVis'02), IEEE Computer Society (2002), pp. 127–131.
[15a] Symanzik, J., Majure, J. J., and Cook, D. 1996. The linked ArcView 2.1 and XGobi environment—GIS, dynamic statistical graphics, and spatial data. In Proceedings of the 4th ACM international Workshop on Advances in Geographic
information Systems (Rockville, Maryland, United States). S.
Shekhar and P. Bergougnoux, Eds. GIS '96. ACM, New York, NY, 147-154.
[16] Günter Rubik. Extruded Parallel Coordinates. Last
update: 19 July 1997, Last Accessed: 26 March 2010, URL:
[17] Johansson, j., Forsell, C., Lind, M., and Cooper, M. 2008. Perceiving patterns in parallel coordinates: determining thresholds for identification of relationships. Information
Visualization 7, 2 (Apr. 2008), 152-162. DOI=
[18] Forsell C, Johansson J. Task-based evaluation of multi-relational 3D and standard 2D parallel coordinates. IS&T/SPIE’s International Symposium on Electronic Imaging, Conference on Visualization and Data Analysis 2007 (San Jose, USA, 2007), SPIE: Bellingham and IS&T: Springfield; [18] Ledermann, 2002. ParVis project:
http://home.subnet.at/flo/mv/parvis/. Last accessed 24 March 2010.
[19] Siirtola H. and Räihä K.-J. 2006. Interacting with parallel coordinates. Interacting with Computers, 18(6):1278–1309 [20] Siirtola, H.; Laivo, T.; Heimonen, T.; Raiha, K.-J., "Visual Perception of Parallel Coordinate Visualizations,"
Information Visualisation, 2009 13th International
Conference , vol., no., pp.3-9, 15-17 July 2009
[21] Henley, M.; Hagen, M.; Bergeron, R.D.; , "Evaluating Two Visualization Techniques for Genome Comparison,"
Information Visualization, 2007. IV '07. 11th International
Conference , vol., no., pp.551-558, 4-6 July 2007
[22] Novotny, M.; Hauser, H.; , "Outlier-Preserving Focus+Context Visualization in Parallel Coordinates,"
Visualization and Computer Graphics, IEEE Transactions on ,
vol.12, no.5, pp.893-900, Sept.-Oct. 2006.
[23] Matkovic, K.; Jelovic, M.; Juric, J.; Konyha, Z.; Gracanin, D.; , "Interactive visual analysis and exploration of injection systems simulations," Visualization, 2005. VIS 05. IEEE , vol., no., pp. 391- 398, 23-28 Oct. 2005 [24] Choi H., Lee H., Kim H., Fast detection and visualization of network attacks on parallel coordinates, Computers & Security, Volume 28, Issue 5, July 2009, Pages 276-288, ISSN 0167-4048.
[25] Yong Ge, Sanping Li, V. Chris Lakhan, Arko Lucieer, Exploring uncertainty in remotely sensed data with parallel coordinate plots, International Journal of Applied Earth Observation and Geoinformation, Volume 11, Issue 6, December 2009, Pages 413-422, ISSN 0303-2434.
[26] Chad A. Steed, Patrick J. Fitzpatrick, T.J. Jankun-Kelly, Amber N. Yancey, J. Edward Swan II, An interactive parallel coordinates technique applied to a tropical cyclone climate analysis, Computers & Geosciences, Volume 35, Issue 7, July 2009, Pages 1529-1539, ISSN 0098-3004.
[27] Charles A. Weber, Anand Desai, Determination of paths to vendor market efficiency using parallel coordinates representation: A negotiation tool for buyers, European Journal of Operational Research, Volume 90, Issue 1, 5 April 1996, Pages 142-155, ISSN 0377-2217.
[28] Swayne, D. F., Lang, D. T., Buja, A., and Cook, D. 2003. GGobi: evolving from XGobi into an extensible framework for interactive data visualization. Comput. Stat. Data Anal. 43, 4 (Aug. 2003), 423-444
[29] John, B. E. and Kieras, D. E. 1996. The GOMS family of user interface analysis techniques: comparison and contrast.
ACM Trans. Comput.-Hum. Interact. 3, 4 (Dec. 1996),
320-351.