1180
SELECTIVE CONSISTENCY MODEL ON MONGODB BIG
DATA STORE
1VIJAY GHANEKAR 2DR. SHRADDHA PHANSALKAR
1Student of Mtech computer Science Symbiosis International University Pune , 2Head of Dept Com. Sci Symbiosis International University Pune
Email: 1[email protected] 2[email protected]
ABSTRACT
Data consistency is an integral part of CAP (consistency-availability-partition) guarantees. Data consistency however is rationed to the permissible levels to achieve higher availability, scalability and other performance guarantees. The presented technique is a rationed consistency model applied to selected data objects and is further extensible to selective transactions in NoSQL data store. In this paper, we conceptualize, design and build working prototype of selective data consistency model on MongoDB data store to apply higher levels of consistency only on selected data objects in transactional application and show the improvement in its performance. The paper also contributes by presenting a design of a data criticality analyser for case study on ecommerce application.
Keywords: Selective Consistency, TPC-C, Response Time, Mongodb, Read-Write Concern, Replication.
1. INTRODUCTION
Relational Database Management System (RDBMS) guarantees higher levels of consistency. Not Only Structured Query Language (No-SQL) and Big Data stores are emerging areas exploited by the application builders. The default level of consistency of No-SQL data stores is eventual consistency. No-SQL databases are increasingly used in big data and web based application for their property of configurable (tunable) consistency [7] and methods of partitioning [2]. Also No-SQL supports variety of data objects (type) in a single collection.
CAP (Consistency-Availability-Partition Tolerance) theorem states that only two properties of all three can be achieved at one time. Thereby an application with partitioning and availability needs to sacrifice the consistency of data. And if consistency and partitioning tolerance is given by data object then availability of data object is hindered in real time. The commercial distributed applications deployed on cloud often compromise on consistency to achieve the availability [4].
Data consistency has different levels. Strong level or strict consistency returns most recent read operation from database, whereas sequential level of consistency is weaker level where a read from a location returns the value
of the last write to that location [26,6]. Casual consistency is weaker model than sequential consistency and all read and causally-related write operations appear in the same order. Eventual consistency model allows concurrent access to the replicas for updates and reads and is weaker consistency model than casual consistency. Consistency is a costlier affair [14]. Choosing “pay only for how much you need “is recommended for data consistency. The No-SQL data stores are generally used to deploy the big data applications with increased demand of availability and scalability. There is an exhaustive work [16] on how this can be achieved. However most of these works tone down consistency to lower levels to achieve these new augmented metrics.
1181 consistency level as needed by user demand or
transaction purpose.
To apply selective data consistency we find critical data objects using data criticality analysis. Data criticality analysis is mathematical function which is calculated by numbers of data access and number of updates of data. Thus for the data objects which are critical, higher level of consistency is levied.
2. BACKGROUND
Data consistency means that data values are the same for all instances of an application [26].Consistency means agreement between the values of the replicas of a data-object.
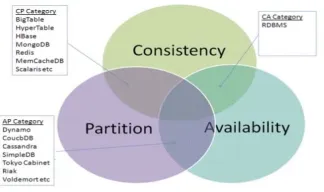
[image:2.612.107.269.477.573.2]A lot of work is done on the metrics which measure consistency. Era of consistency starts from cloud which has strong level of consistency. The figure 1 shows that different data stores with different guarantees of consistency (C), availability (A) and partition tolerance (P). The choice of No-SQL data stores is desirable because they are built for specific gains to performance other than consistency. Many of the No-SQL data stores used for commercial applications, have partition tolerance as common service and differ in availability and consistency guarantees of CAP theorem.
Figure 1CAP Theorem
The prototype is built with benchmark tool, TPC-C [10] which uses OLTP transactions [10] for an ecommerce application. The OLTP applications generally require higher levels of consistency as well as higher availability in the recent times. TPC Benchmark™ C (TPC-C) is an OLTP workload. It is a mixture of read-only and update intensive transactions that simulate the activities found in complex OLTP application environments. TPC-C benchmark is an Online Transaction Processing (OLTP)
workload. It is a popular benchmark for comparing OLTP performance on various software and hardware configurations.
Flexible Replication Architecture for a Consistency Spectrum model is to measure consistency where inconsistency is measured in terms of obsoleteness. [14]. Thus to overcome inconsistency Lease time is introduced to achieve higher level of consistency. Lease time technique has its time interval in which server informs proxy about updates. [13].
Conit-based continuous consistency model can be given as combination of numerical errors, order errors and staleness data. Numerical errors is limits that allow weight of the writes that can be applied across all replicas. Order error limits the number of tentative writes. And staleness is a real time bound on the delay of write propagation among replicas [15]. Different levels of consistency and their implementation in distributed system used to increase the consistency levels. Transaction Processing Engine (TPE) which will take care of execution of all transaction. Time Stamp Manager (TSM) which helps all transactions to execute in sequence [4]
Consistency in replicated services is designed with two layer infrastructure (top/bottom layer) which detect and resolve inconsistency in different levels. First level On-demand in which users explicitly request consistency resolution. In Hint-based system, system asks users to give hints about their approximate consistency requirements. While in Fully-automatic level improves consistency with best effort [12]. Consistency to data object get increased but dynamically adaption of the level of consistency are in three categories as a).Category-A – serializable b) Category-B – Adaptive c) Category-C-Session Consistency [11].
1182 latency just enough for an N-replicated system
[6]
Foundations of Selective Consistency: Concept
Consistency is a costly affair. Hence rationing the consistency to lower levels is desirable for complying the augmented metrics. Selective data consistency model is one of the ways to achieve this. It is observed that not all data in the business are critical. Many of them are not updated (write) and some of them are only referred (read). Some of them are frequently updated as well as written. The access patterns of these data objects indicate that instead of looking at the data objects from an unbiased purview of consistency, they can be biasedly constrained for consistency.
This is the inception of selective data consistency model. This leads to formulation of the hypothesis that selective data consistency model can leverage the performance gains in terms of availability and responsiveness. The aim of this experiment is to accept or reject this hypothesis.
The figure 1 shows that different data stores with different guarantees of consistency (C), availability (A) and partition tolerance (P). The choice of No-SQL data stores is desirable because they are built for specific gains to performance other than consistency. Many of the No-SQL data stores used for commercial applications, have partition tolerance as common service and differ in availability and consistency guarantees of CAP theorem. The choice of MongoDB for implementing the prototype of selective consistency is done for several reasons.
Firstly, MongoDB offers higher consistency at the document level with different levels of read and write concern.
MongoDB offers more flexibility with combinations read and write consistency. Secondly, it has a well-defined query model which makes it suitable for transactional applications. Thirdly, its open source code makes it very suitable for adapting it to suit the requirements of the applications. The replication factor, location of the replicas are flexible and can be moulded to the needs of the application.
To build OLTP application based on TPC-C benchmark we thus select MongoDB as it provide flexible consistency model and we can
apply strong consistency to selected data objects to increase the performance.
Building adaptive consistency with
MongoDB replication and synchronization model
In MongoDB, primary or master node is only capable to write the data. All other secondary or slave nodes can be synchronized with the given preferences. User reads data from either master node or secondary node. This is referred as read-write concerns.
Write concern
{ w: <value>, j: <boolean>, wtimeout: <number> }
“w” is request acknowledge which is a number 0 or 1. If ‘0’ no request acknowledge that means master node will not wait to sync the data with all secondaries or replicas. If ‘1’ then it will request or wait until all replicas get sync as most recent data write on primary. ‘j’ is journal value which will return journal on which data is written.
Read concern
{ level: <"majority"|"local"|"linearizable"> }
Choosing different read level concerns helps reading with synchronous and asynchronous format. Asynchronous reading of data leads to incorrect reads or reading stale data. Read preference in MongoDB has following options as “ReadFromPrimary” which will read data explicitly from master node. “ReadFromSecondary” will read data from slave node. “SecondarySafe” is a mode in which only committed operations will read from slaves. Writing of data is default to primary node only. User can synchronize the primary node data to all slave nodes but MongoDB does not allow user to write data on secondary or slave node.
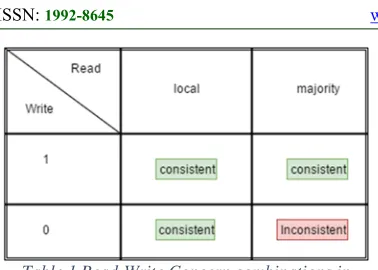
1183 Table 1 Read-Write Concern combinations in
[image:4.612.314.525.175.311.2]MongoDB
[image:4.612.91.298.396.532.2]Figure Table 2 shows the possible consistency levels with read and write concerns. Combinations of writes “0” and “1” with read “local” “majority” is shown in this table. Figure 3 shows the structure of primary and secondary replicas with different read-write concern levels. It also shows that the response of read and write request to write to primary as well as secondary nodes.
Figure 2 - Read-Write Concerns of MongoDB replica set with 2 set replicas
This block diagram shows that it allows user to write data only to primary node and can be read from primary node as well as secondary node. MongoDB has its own auto-balanced replica mechanism, so all data-write to primary can be synchronized to all replicas.
Architecture of selective consistency model on MongoDB
Architecture shown in Figure 6 shows architecture for implementation of TPC-C application on a Big Data store.
The timestamp manager is used to avoid conflicts of transaction accesses on one data store and execute the transactions in the order of their time stamp. This assures distributed consistency across multiple replica sets.
Figure 3 Architecture of selective consistency model on MongoDB
Workload Generator
Neo load generator generates random load and distributor manager create a random load on server with standard transaction and distribute the transactions to respective managers. The application is divided into three layers first is work load generator in which all the TPC-C transactions as new order transaction, payment transaction, delivery transaction, order status and stock level transactions distributed to the respective transaction managers .for the workload generation we uses neo Load Generator which help to create real time workload for multiple users. Neoload also take care for concurrent execution of multiple user. Workload of multiple users distributed among all transaction manager and then transaction manager will execute call transaction by assigning timestamp for each transaction using timestamp manager. All the transaction from transaction manager will trigger that database with the given consistency to particular date object.
Transaction manager
1184 Time Stamp Manager
Time stamp manager work with all transaction manager to execute the transactions in sequential manner. Transaction which are generated by NeoLoad generator were sent to transaction managers and at the same time stamp manager with allocate a unique time id to each transaction so that all transaction get executed in sequence to avoid conflict of concurrent transactions.
Data criticality analyser
It is designed to analyse the criticality of the data in the business. The analyser uses statistical model to generate an index depending on the usage and access pattern of the given data.
Data criticality of a data object is a function f(x,y), where x is number of accesses and y is the number of updates on a data object. A lot of works [20] have been carried out on finding the access patterns of data objects by business transactions. However the recent works [24] on the issue of finding the critical data in business application indicate that it is essential to explore the relations dynamically.
Data criticality analyser is used to find the data objects which are really critical and need higher level of correctness and updations in the application. Data criticality analyser is designed with a mathematical model defined by number updates and number of accesses to the data item.
Deployment of prototype on Mongo cloud In the implementation of TPC-C application using Java we have created multiple packages. The business logic of TPCC with five critical transactions as New-Order Transaction consists of entering a complete order through a single database transaction. It represents a mid-weight, read-write transaction with a high frequency of execution and stringent response time requirements to satisfy online users. This transaction is the backbone of the workload.
Payment transaction updates the customer's
balance and reflects the payment on the district and warehouse sales statistics. It represents a light-weight, read-write transaction with a high frequency of execution and stringent response time requirements to satisfy online users.
Order-Status business transaction queries
the status of a customer's last order. It represents a mid-weight read-only database transaction with a low frequency of execution
and response time requirement to satisfy online users.
Delivery transaction consists of processing a
batch of 10 new (not yet delivered) orders. Each order is processed (delivered) in full within the scope of a read-write database transaction. The business transaction comprised of one or more (up to 10) database transactions, has a low frequency of execution and must complete within a relaxed response time requirement. It is executed in deferred mode through a queuing mechanism.
Stock-Level transaction determines the
number of recently sold items that have a stock level below a specified threshold. It represents a heavy read-only database transaction with a low frequency of execution, a relaxed response time requirement, and relaxed consistency requirements.
The data flow diagram of New Order transaction will fetch all the data objects from all the Mongo collections like warehouse, customer, stock etc.
We deployed MongoDB replica set for better availability and placed it on different server on cloud. We created one primary and five secondary nodes which were deployed on Amazon cloud. This assured 4 (k) fault tolerance and better availability. However as the replicas were distributed over different regions (data centres) all the updates on primary node were synchronised to all replicas. All the write operations are performed on primary node of MongoDB. Read operation or fetching the data can be done either from primary or secondary node. Users can explicitly read data from secondary node and this should hypothetically result in better availability at the cost of stale reads.
The application uses “read_from_secondary" option which will guarantee the better performance but at the same time user may read incorrect data. Thus as per our hypothesis reading from secondary notes will give better performance but it does not guarantee the correct reads while reading from primary notes or waiting to for replica synchronization will wait for all the replicas.
1185 the concept of selective consistency is
applicable to get better performance and correct data. Using data criticality analyser we analyse some data object which actually need high level of consistency by observing number of access and number of updates. In the TPC-C application implementation stock level objects are more critical. Thus at application level we provide high level of consistency all stock level data objects and all other data object with default level of consistency. This selective data consistency technique on TPCC application gives us better performance and guarantee the correct data read.
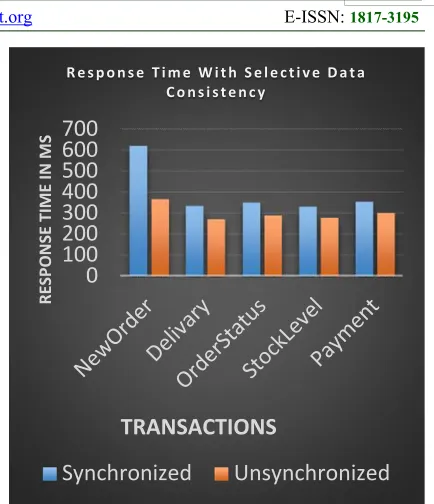
We now show significant implementation results which will show the response time of all TPC-C transaction with multiple users. The observation proves the hypothesis that the response time for synchronised transaction is more than that of unsynchronized transaction. The terminology “synchronised” is used for the transactions which wait for all replicas to get updated while the term unsynchronized means that the replica will not wait to get updated by the primary node.
Response Time for TPC-C Transactions
The Response time for TPCC transactions where the single stock data –object is read in unsynchronized (Unsync) and
Synchronized (Sync) mode. Here the stock data object is a business critical data object for an e-commerce application.
And we choose to observe its effects on the response time. This is depicted in the figure 5.
The gain in the performance with synch and unsynch options can also be shown in the presence of concurrent transactions executed with different users.
When multiple users hit same data (here same stock item) with the business transactions (here placing order), application of higher consistency to selected data objects show the average response time for the two modes as follows.
0
100
200
300
400
500
600
700
RESPONSE
TIME IN MS
TRANSACTIONS
R e s p o n s e T i m e W i t h S e l e c t i v e D a t a C o n s i s t e n c y
[image:6.612.311.528.70.322.2]Synchronized
Unsynchronized
1186 Figure 5 Time Comparison for TPC-C New Order
Transaction with different users
Correctness achieved or bargained
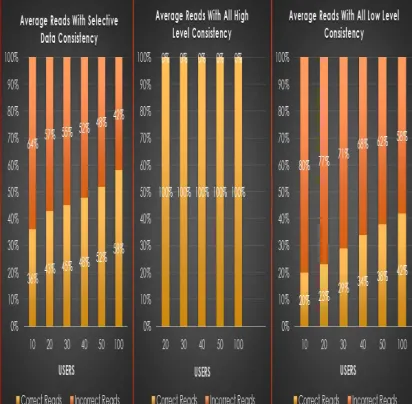
The performance is definitely with rationed consistency guarantees. The observations below quantify the lost consistency in terms of proportion of incorrect reads to the total reads (taken as 1).
Following graphs shows the individual and average correct and incorrect data read when concurrent users read same stock and the read preference is unsynchronized for the single stock data object.
Figure 6 Proportion of correct read and incorrect reads in Percentage
3. STATATICAL MODEL OF DATA CRITICILITY: DATA CRITICALITY ANALYSER
Data criticality can be defined in terms of requirement of consistency, which will otherwise cost heavy loss if it is inconsistent. In TPC-C benchmark stock data objects which are not more consistent and accessed more will cause more loss in terms of cost or profit. Consider stock data object can be over-sold or under-sold.
In entire TPC-C, it is equally challenging to find which stock-object is critical and needs stronger level of consistency against concurrent accesses and which data object can be used by applying weaker level or default levels of consistency. Thus to find data object which has more number of access and number updates, we can use a function which can be defined as
F(X, Y)
Number of accesse Number of updates
The number of access and number of updates are made to the stock collection. However we propose a typical ABC analysis [20] of stock data object. Using this analysis, we consider stock object for adaptive level of consistency to be used in TPC-C.
We consider three indices for determining total criticality of stock data object. We now derive following three indices to calculate data criticality of object.
1. Popularity Index (PI)
It logically implies the stock item which is ordered more in terms of number of orders.It cn be found over T transactions or over a period of time.This can be calculated as
PI
_ __ _
PI is popularity Index defines as ration of stock_orders by total_orders where Stock_Order_Count is total number of orders for stock data object. Total_Order_Count is total number of orders for all data objects.
0
500
1000
1500
2000
2500
10
20
30
40
50
100
200
300
400
Time
in ms
USERS
Average Response Time of New Order Transaction
Low Level
Selective Lev
[image:7.612.90.296.497.699.2]1187 Consider the example of item sale in any
e-commerce application. Items like umbrella are sold more in monsoon seasons, gold jewellery sell is more in festival time like Diwali etc. Items which get popular for selling index because of some trends or fashions are also considered in popularity index for fix duration time.
2. Stock sales index can be formulated as
_
_
∗
Where- Sytd is number of stock sold items sold till date
Wytd is total amount of stock sold in warehouse till date
In business, product which gives more value is popular. Some products are sold in less quantity but give more value while some products are ordered in mass quantity but have less value. Thus, stock sales index can be calculated as ratio of product of number of stock items and price of each item in stock, to the total number of sales amount in warehouse till date.
Sytd is number of items sold from warehouse till date. As one warehouse has multiple items, Sytd is calculated for each individual item present in that warehouse.
Wytd is sum of all item prices which are sold from warehouse till date.
3. Stock Purchase quantity index for warehouse
_
_
,
∀
Stock Purchase quantity actually gives insight that what mass of a stock item is ordered together. This gives an insight about the re-order level of a stock –item. An item with higher index indicates that the item is always ordered in masses and hence the stock needs to be maintained high for higher availability. For example a user buys item ‘Rice’ in mass quantity of kilograms, however an user may but “gold” in grams, which will indicated more
stock purchase quantity index for rice than gold.
4. CASE STUDY
The section discusses a case study of a shopping mart which has varied stock items from food items to jewellery items. It discusses the significance of all the indices discussed above for all the items for an observed period. The section then discusses how consistency index of different stock items can be determined. We hereby make survey of shopping items for varied users (please specify number). These items are known as data-objects and data data-objects which have more values of consistency index are critical objects. The consistency constraints of these data objects are strictly observed.
We collected responses from users to know the buying patterns of the different items with the preferred quantity that they would like to purchase [20]. The data received from user response are quantitatively understood and analysed using statistical methods.
For statistical analysis we use “ABC Analysis Technique” [16]. To categorize received data-objects into A, B and C we used three indices as Popularity index, Stock sales index and Purchase quantity index.
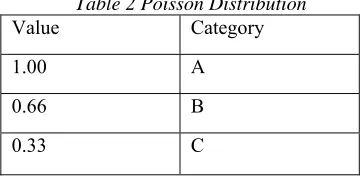
As formulized above we calculated the values for all three indices and distributed them into categorical data as A, B, C using Poisson distribution [28] technique.
[image:8.612.315.495.521.609.2]Using Poisson distribution [28], we divide the values 0 to 1 in three equal categories.
Table 2 Poisson Distribution Value Category
1.00 A
0.66 B
0.33 C
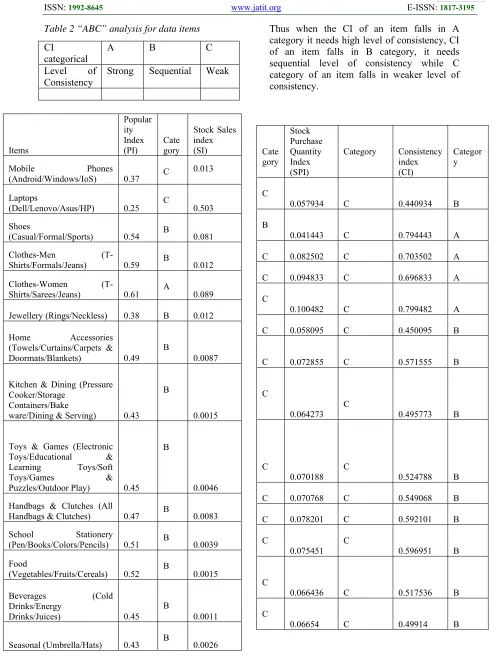
We perform ABC analysis [20] and find three indices including popularity index, Stock sales index and Purchase quantity index for each item.
1188
Table 2 “ABC” analysis for data items Thus when the CI of an item falls in A category it needs high level of consistency, CI of an item falls in B category, it needs sequential level of consistency while C category of an item falls in weaker level of consistency.
CI
categorical A B C Level of
Consistency Strong Sequential Weak
Items
Popular ity Index
(PI) Category
Stock Sales index (SI) Mobile Phones
(Android/Windows/IoS) 0.37 C 0.013 Laptops
(Dell/Lenovo/Asus/HP) 0.25 C 0.503 Shoes
(Casual/Formal/Sports) 0.54 B 0.081 Clothes-Men
(T-Shirts/Formals/Jeans) 0.59 B 0.012 Clothes-Women
(T-Shirts/Sarees/Jeans) 0.61 A 0.089 Jewellery (Rings/Neckless) 0.38 B 0.012 Home Accessories
(Towels/Curtains/Carpets & Doormats/Blankets) 0.49
B
0.0087 Kitchen & Dining (Pressure
Cooker/Storage Containers/Bake
ware/Dining & Serving) 0.43 B
0.0015
Toys & Games (Electronic Toys/Educational & Learning Toys/Soft Toys/Games & Puzzles/Outdoor Play) 0.45
B
0.0046 Handbags & Clutches (All
Handbags & Clutches) 0.47 B 0.0083 School Stationery
(Pen/Books/Colors/Pencils) 0.51 B 0.0039 Food
(Vegetables/Fruits/Cereals) 0.52 B 0.0015 Beverages (Cold
Drinks/Energy
Drinks/Juices) 0.45 B
0.0011
Seasonal (Umbrella/Hats) 0.43 B 0.0026
Cate gory
Stock Purchase Quantity Index (SPI)
Category Consistency index (CI)
Categor y
C
0.057934 C 0.440934 B B
0.041443 C 0.794443 A C 0.082502 C 0.703502 A C 0.094833 C 0.696833 A C
0.100482 C 0.799482 A C 0.058095 C 0.450095 B
C 0.072855 C 0.571555 B
C
0.064273 C 0.495773 B
C
0.070188 C 0.524788 B C 0.070768 C 0.549068 B C 0.078201 C 0.592101 B C
0.075451 C 0.596951 B
C
0.066436 C 0.517536 B C
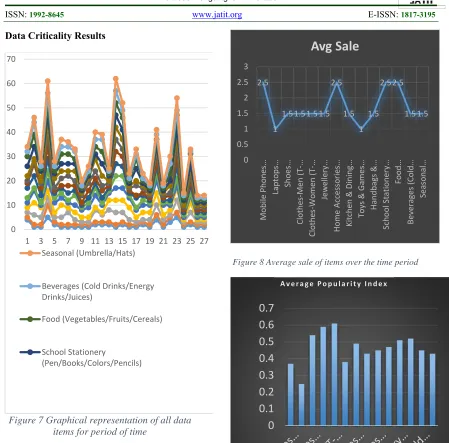
1189 Data Criticality Results
Figure 7 Graphical representation of all data items for period of time
[image:10.612.316.528.89.312.2]This observation shows average sale for the observed items over the period of time
Figure 8 Average sale of items over the time period
Figure 10 Average Popularity Index
0 10 20 30 40 50 60 70
1 3 5 7 9 11 13 15 17 19 21 23 25 27 Seasonal (Umbrella/Hats)
Beverages (Cold Drinks/Energy Drinks/Juices)
Food (Vegetables/Fruits/Cereals)
School Stationery
(Pen/Books/Colors/Pencils)
2.5
1
1.51.51.51.5 2.5
1.5 1
1.5 2.52.5
1.51.5
0 0.5 1 1.5 2 2.5 3
Mobile Phones
…
Laptops… Shoes…
Clothe
s‐Men (T‐…
Clothe
s‐Women (T‐…
Jewe
llery…
H
o
m
e
Ac
ce
ssories…
Kitchen
& Dining…
Toys & Ga
m
es…
Handbag
s &…
School Stationery…
Food…
Be
verag
e
s (
C
old…
Sea
sonal…
Avg Sale
0
0.1
0.2
0.3
0.4
0.5
0.6
0.7
[image:10.612.315.538.340.581.2]1190 Figure 11 Average Stock Sales Index
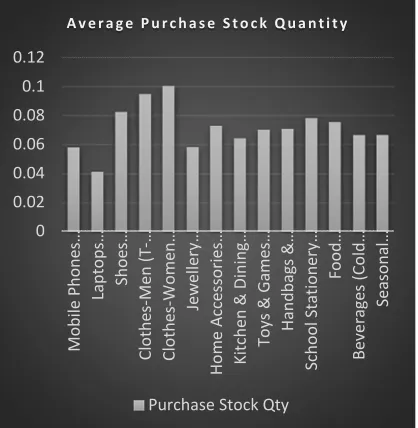
[image:11.612.90.299.433.647.2]. Figure 12 Average Purchase Stock Quantity
Figure 13 Average Consistency Index
5.CONCLUSION
The purpose of this work is to design, formulate and implement selective consistency model in big data stores and validate its performance on commercial No-SQL data stores like MongoDB. Using the background of the well-established CAP theorem, it rations the consistency to only selected critical data items. The items that are found less critical can have lower consistency requirements. This will foster the application performance. The application performance is measured in terms of response time. The stated hypothesis is proved using the experimental results where the selective data consistency model has out-performed the monotonic consistency model. We propose consistency model to leverage guarantees of only few data items and hence this approach is considered as “Selective data consistency”.
The second contribution of the work is the statistical design of a data criticality analyser for a shopping application. The data analyser puts forth the model of a categorical index 0 0.01 0.02 0.03 0.04 0.05 0.06 0.07 0.08 0.09 0.1 Mobile Phones … Laptops… Shoes… Clothe s‐Men (T‐… Clothe s‐Women (T‐… Jewe llery (R in gs/ N ec kl es s) H o m e Acce ssories… Kitchen & Dining (Pres sure… Toys & Ga m es (Electronic… Handbag s & Clutche s (A ll… School Stationery… Food… Be verag e s ( C old… Se as on al (U m b re lla /H at s)
A v e r a g e S t o c k S a l e s I n d e x
Stock sales index 0 0.02 0.04 0.06 0.08 0.1 0.12 Mobile Phones … Laptops… Shoes… Clothe s‐Men (T‐… Clothe s‐Women… Jewe llery… H o m e Ac ce ssories… Kitchen & Dining… Toys & Ga m es… Handbag s &… School Stationery… Food… Be verag e s ( C old… Sea sonal…
A v e r a g e P u r c h a s e S t o c k Q u a n t i t y
Purchase Stock Qty
0
0.1
0.2
0.3
0.4
0.5
0.6
0.7
0.8
0.9
1191 analyser of all the data items based on a triplet
of indices like popularity index, stock purchase quantity and stock sales index. The resultant data criticality index quantifies the criticality of the shopping in three levels as A,B and C. The items which are found critical with buying patterns of the user are critically observed for concurrent usage whereas the items that are less critical are observed with lesser restrictions. The selective data consistency model is observed to out perform the monotonic consistency model.
The selectivity can not only be observed for data items but can also be extended to critical queries. The queries can also be treated biasedly based on user who generates the request. This is left for future work.
REFERENCES:
[1] Lewis Tseng, Indranil Gupta, and Nitin Vaidya “Characterizing and Adapting the Consistency-Latency Tradeoff in Distributed Key-value Stores” ACM Transactions on Autonomous and Adaptive Systems (TAAS) 11.4 (2017): 20.
[2] Shoker, Ali, Houssam Yactine, and Carlos Baquero. "As Secure as Possible Eventual
Consistency: Work in
Progress." Proceedings of the 3rd International Workshop on Principles and Practice of Consistency for Distributed Data. ACM, 2017.
[3] Wei, Hengfeng, Yu Huang, and Jian Lu. "Probabilistically-Atomic 2-Atomicity: Enabling Almost Strong Consistency in Distributed Storage Systems." IEEE Transactions on Computers 66.3 (2017):
502-514.
[4] Wang, Zhiguo, Zhiqiang Wei, and Hao Liu. "Research on high availability architecture of SQL and NoSQL." AIP Conference Proceedings. Vol. 1820. No.
1. AIP Publishing, 2017.
[5] Adewole Ogunyadeka Muhammad Younas Hong Zhu “A Multi-key Transactions Model for NoSQL Cloud Database Systems” 2016 IEEE Second International Conference on Big Data Computing Service and Applications.
Human-centric Computing and Information Sciences 7.1 (2017): 7.
[6] Marcos K. Aguilera Douglas B. Terry “The many faces of consistency” 2016 IEEE.
[7] Shraddha P. Phansalkar and Ajay R. Dani “Tunable consistency guarantees of selective data consistency model” Springer Journal of Cloud Computing 10 June 2015.
[8] Vasanti Kulkarni, Megha Bansode, Gaurav Mirje “A Survey on Improving Cloud Consistency Using Audit Cloud” IJETTCS Volume 4, Issue 1, January-February 2015.
[9] Qin Liu, Guojun Wang, and Jie Wu “Cloud Auditing and Consistency Service” IEEE Transactions on Network and Service Management, Vol. 11, No. 1, March 2014.
[10]Ion Lungu, Bogdan George Tudorica “The Development of a Benchmark Tool for NoSQL Databases” Database Systems Journal vol IV, no. 2/2013.
[11]K.Arun, Dr.L.Jabasheela (Sept 2014) “Big Data: Review, Classification and Analysis Survey” (IJIRIS) Volume 1 Issue 3. [12]Seth Gilbert, Nancy A. Lynch,
"Perspectives on the CAP Theorem", Computer, vol. 45, IEEE, Feb. 2012.
[13]Sherif Sakr, Anna Liu, Daniel M. Batista, and Mohammad Alomari “A Survey of Large Scale Data Management Approaches in Cloud Environments” IEEE Communications Surveys & Tutorials, Accepted For Publication 2011.
[14]Tim Kraska Martin Hentschel Gustavo Alonso Donald Kossmann “Consistency Rationing in the Cloud: Pay only when it matters” ACM Journal Volume 2 Issue 1, August 2009
[15]Yijun Lu Ying Lu Hong Jiang “IDEA: an infrastructure for detection-based adaptive consistency control in replicated services” ACM 2007.
1192 [17]Chi Zhang, Zheng Zhang “Trading
Replication Consistency for Performance and Availability: an Adaptive Approach” IEEE Computer Society Washington, DC, USA ©2003.
[18]Haifeng Yu Amin Vahdat “Design and Evaluation of a Continuous Consistency Model for Replicated Services” ACM Transactions on Computer Systems (TOCS) Volume 20 Issue 3, August 2002. [19] Das S, Agrawal D, El Abbadi A (2013)
ElasTraS: An elastic, scalable, and self-managing transactional database for the cloud. ACM Trans DatabaseSyst (TODS) 38(Article 5):1–45
[20]F. De Felice*. D. Falcone*. A. Forcina*. A. Petrillo*. A. Silvestri Inventory management using both quantitative and qualitative criteria in manufacturing system
[21]Shah, Vivek. "Transactional partitioning: A new abstraction for main-memory
databases." arXiv preprint
arXiv:1701.04339 (2017).
[22]https://docs.mongodb.com/manual/core/re ad-isolation-consistency-recency/ [23]https://www.mongodb.com/faq
[24]http://delab.csd.auth.gr/~dimitris/courses/ mpc_fall05/papers/invalidation/ieee_tkde9 9_data_consistency_pitoura.pdf
[25]http://www.tpc.org/
[26]https://en.wikipedia.org/wiki/Consistency _model
[27]https://goo.gl/forms/Lm2PdTf8YCCg7o8 F2