Full Length Research Article
AN INTERPRETATION OF HONG KONG’S EDUCATION SYSTEM THROUGH PISA REPORTS
*1
Santiago Nieto Martín and
2María Luisa Sevillano García
1
Titular de la Facultad de Educación, Universidad de Salamanca (Spain)
2
Catedrática de la Facultad de Educación, Universidad Nacional de Educación a Distancia (Spain)
ARTICLE INFO ABSTRACT
In this article, I attempt to show the characteristics of the education system in Hong Kong, doing so based on the educational performance revealed in different countries through the PISA 2006 Report. I describe the characteristics obtained by carrying out a comparison with other countries in the world, and I clearly define the benefits through four models that define the educational systems of the world to address their heterogeneity.
Copyright©2016, Santiago Nieto Martín and María Luisa Sevillano García. This is an open access article distributed under the Creative Commons Attribution License, which permits unrestricted use, distribution, and reproduction in any medium, provided the original work is properly cited.
INTRODUCTION
One of the most prominent and relevant educational reports published in the world is generated through the successive application of the so-called PISA tests to OECD member countries and a series of other invited states. A comparative reflection on the academic performance of the countries of the world that account for the largest percentage of the global economy’s wealth is an intellectual pursuit of great educational and social scope. In November 2007, the media widely reported on the PISA 2006 Report following the publication of the results of the Programme for International Student Assessment carried out by the OECD, which aims to provide findings on the key competencies of fifteen-year-old students. Such a program is carried out every three years in countries that are members of the OECD, and also in (as I have already mentioned) a group of associated countries. These nations collectively account for almost 90% of the world economy. The PISA 2006 Report, which was entitled Science Competencies for Tomorrow’s World, focused on science, though it also assessed mathematics and reading competencies.
*Corresponding author: Santiago Nieto Martín
Titular de la Facultad de Educación, Universidad de Salamanca (Spain).
Together with PISA 2000 and PISA 2003, this report completed the first evaluation cycle for the three core subjects. Evaluations that began in 2009 with reading as the main subject continued in 2012 with mathematics and will continue with science in 2015. Given the fact that PISA reports are of great interest, the pedagogical and social ignorance that often exists in relation to other types of international reports that are equally interesting, valid and meaningful is striking. I am not referring here to the TIMSS and PIRLS reports.
International Reports
One of the most stimulating pedagogical works available for consultation in recent years has been French researcher Nathalie Mons’s Les nouvelles politique éducatives. If we add the compelling information and conclusions provided in Mons’s work to the studies carried out by the GIRSEF research group from the Faculty of Psychology and Education Sciences of the Université catholique de Louvain (Belgium), what we have is a highly enticing and uplifting research field, in relation to which there are few precedents elsewhere in developed countries. Although early studies (Dupriez and Dumay, 2005) reached the conclusion that integrated types of school systems are generally more egalitarian than differentiated types of systems, it is worth reflecting on this
ISSN: 2230-9926
International Journal of Development Research
Vol. 06, Issue, 08, pp.9210-9221, August,2016
International Journal of
DEVELOPMENT RESEARCH
Article History:
Received 09th May, 2016 Received in revised form 19th June, 2016 Accepted 26th July, 2016 Published online 31st August, 2016
Key Words:
PISA 2006 report;
duality. An integrated school system is characterized by a common structure for all students. There are no groups that are differentiated, selected, distributed or classified for any reason or in the long term for anyone. There is virtually no element of options, and separating students based on results is avoided for as long as possible. It is considered that, in theory, it is necessary to leave the school enough time to combat differences in cultural resources between families and to provide each student with real possibilities of success before any form of selection. In contrast, the differentiated type of school system involves teaching with groups that are organized at an early stage. This method is supposed to offer division-based orientations and strategies that are useful tools for managing pathways through the school. These two educational options were established under similar criteria of social and political fairness, but doubts about the effectiveness of both systems may begin to arise as a result of the academic results obtained.
As Crahay and Delhaxe (2004) suggest, it seems appropriate to speak of a culture of integration and of a culture of differentiation For these authors, a culture of integration represents an organizing principle that underpins different parameters, rests upon values that comprise a cultural project , and has a clear conception of the role of the school in society. By the same token, a differentiated school culture could be understood as one that attempts to offer an education most suited to the characteristics and needs of each student. Why not investigate both options? The principle of equal opportunities has been introduced in countries based on grounds such as the obligatory and free-of-charge nature of education, equality policies and positive discrimination. In all cases and countries, these have been inspired by the same founding proposition: that in a democratic society, the school journey and success must rely more on the role of the school, which should be oriented to offer everyone the same chance for empowerment, than on the family resources that students inherit. In that sense, whatever the policies implemented may be, I believe that international reports are a vitally important reference for analysing to what extent distances are produced in the achievement of that objective.
I do not wish to fail to mention an interesting reflection made by Crahay (2003) when, on the basis of results from some studies carried out in European countries since 1990 (Reading Literacy), he concludes that schools do not need to select to be effective, and that, conversely, countries that implement a system of selection as late as possible have tended to be more effective. In his understanding, a long-term education does not seem to preclude the formation of elites, and the best way to produce bright students is with the support of an integrated school structure. Between the two extremes of this spectrum of integrated teaching versus differentiated teaching, it is easy to place various groups of countries. Firstly, there are the Scandinavian countries, which have a single structure for all students up to the age of 16 and, usually, automatic advancement of students between the years of study. Secondly, there are countries such as Germany, Austria, Luxembourg, Switzerland and Holland, where there is a system of early differentiation of student pathways. Thirdly, in the middle of the spectrum, there are school systems that feature either the coexistence of several parallel structures (such as
comprehensive and grammar schools in England) or more or less intensive pathways of choices and orientations with some common structures (such as the collège unique in France [Dupriez and Dumany, 2005]).
In my analysis (albeit on an approximate or referential basis), I have not found differences in achievement between the two models, although it must be kept in mind that such analysis should be carried out according to the scores obtained by each decile, as doing so offers a profile that is equally attuned to high- or low-performing students. The general view seems to be that early separation covaries with greater social inequality at the school. Given that this is a stabilized result, it would be appropriate to advance to a better understanding of educational systems (Dupriez, Dumay and Vause, 2008). However, returning to Mons’s work (2004), it is impossible to ignore issues of transcendent importance such as the decentralization of educational policies or a school’s own reforms. It is necessary to emphasize new school models based on efficiency and equality and face up to a period of decisions that will examine and frame the future of the school models of the twenty-first century. All of the above suggests a line of thought of outstanding importance will be one that directs the management of the great heterogeneity that occurs in the classroom in various manifestations, as well as the attendant processes of adaptation and management of such differences. As we all know, school systems have to respond simultaneously to several demands: differentiation of students’ learning based on their abilities and the various demands of work, social integration, promotion of knowledge and values, and so forth (Broadfoot, 1999). All of this undoubtedly supposes a certain tension generated through aiming for and achieving, where appropriate, such objectives. All of the above is of great importance because the nature and scope of such a question is far greater than what can be socially perceived and what we can perceive, given that strategies and methods for managing such heterogeneity will have a significant impact on education, and very first and foremost, on working conditions of teachers and on students’ own learning.
The Particularities of Comparative Research
emerging countries. This phenomenon requires, so as not to create new categories that make any type of analysis impossible, a clustering in already created subsystems, which involves a certain reduction of the established reality. Finally and fourthly, it is to be understand that, given what are sometimes intractable difficulties, any classification with an international dimension requires the creation of ad hoc indicators. Therefore, we must accept a certain classificatory fragility, though not an absence of realism and consistency based on the data used and the need to understand the ways and means of managing certain common problems.
Models for Management of Heterogeneity: A new typology of compulsory schooling
Even with all the problems described here, it seems reasonable for the studies carried out by Mons (2004, 216) to offer an analysis of certain strategies adopted by different countries to overcome the issue of heterogeneity—though these strategies take dichotomous forms that are open to questioning, as we have seen. Differentiated educational systems can be determined by way of pathways that include those of Central European countries. Alternatively, particularly in the countries of Northern Europe, they may involve systems where differentiation, pathways or options arise much later. The student’s own performance as opposed to individual nurturing, for example, is one debatable dichotomy. Here I will offer an overview that highlights four essential strategies in methods for managing schools. One of these is the model of separation on the basis of initial selection, while the other three are systems that provide students with a common nucleus over the long term.
It would be worthwhile to consider each of these in turn:
The separation model is based on pupils having acquired an education in parallel by the end of primary school. This is always based on similar academic results, wherein both guidance and repetition are elements of adjustment over the educational period, with repetition in particular being a special valve to relieve tensions. Representatives of this model are countries such as Germany, Austria, Hungary, Switzerland and Luxembourg, and to some extent, the neighbouring countries of Central Europe, such as Belgium and the Netherlands
Another model, called the individualization of integration, is followed in Denmark, Iceland, Finland, Sweden and Ireland, where classes of students with low performance levels are not frequent. Repetition is an exception, and pedagogical strategies including individualized instruction and personal and small-group tutoring stand out.
The comprehensive school model involves all students following a common programme at same pace throughout their compulsory education. Heterogeneity is managed through a flexible policy of grouping students. It could be based on their performance or the characteristics of a particular discipline. It could be considered to be a kind of à la carte integration model. This model is principally followed in countries such as the United States, Canada, the United Kingdom and New Zealand.
The seamless integration model does not feature any management mechanisms, either between or within groups. All students are subject to the same educational conditions. The only adjustment system is the repetition of the year, the aim here being to regulate the flow of students and to separate the less skilled from those that can keep pace with the performance level that has been set. The systems in France, Spain, Portugal and Chile are representative of this model.
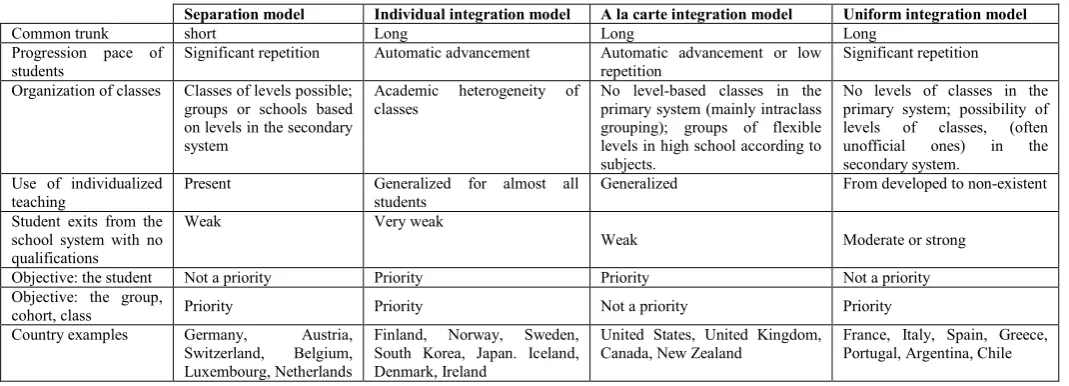
The table below summarizes some of the particularities of the models that have been described so far:
As can be seen, the countries suggested are sufficiently well known as examples. All of them are members of the OECD and are countries for which analysis can be performed with greater clarity. This should allow us to search for variables that coalesce in the achievement of clusters that allow analogies between different educational systems to be found, in line with the intended purpose here, which is to achieve knowledge and an understanding of the educational system of Canada based on the different classifications made.
Preliminary Descriptive Assessment
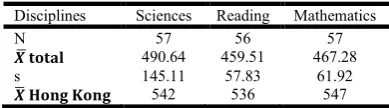
[image:3.595.34.569.599.792.2]I will begin by describing the data obtained on the education system of Hong Kong relative to the mean values of other countries:
Table 1. Models for managing educational heterogeneity
Separation model Individual integration model A la carte integration model Uniform integration model
Common trunk short Long Long Long
Progression pace of students
Significant repetition Automatic advancement Automatic advancement or low repetition
Significant repetition
Organization of classes Classes of levels possible; groups or schools based on levels in the secondary system
Academic heterogeneity of classes
No level-based classes in the primary system (mainly intraclass grouping); groups of flexible levels in high school according to subjects.
No levels of classes in the primary system; possibility of levels of classes, (often unofficial ones) in the secondary system.
Use of individualized teaching
Present Generalized for almost all students
Generalized From developed to non-existent
Student exits from the school system with no qualifications
Weak Very weak
Weak Moderate or strong
Objective: the student Not a priority Priority Priority Not a priority
Objective: the group,
cohort, class Priority Priority Not a priority Priority
Country examples Germany, Austria, Switzerland, Belgium, Luxembourg, Netherlands
Finland, Norway, Sweden, South Korea, Japan. Iceland, Denmark, Ireland
United States, United Kingdom, Canada, New Zealand
Table 1. Descriptive statistical totals
Disciplines Sciences Reading Mathematics
N 57 56 57
490.64 459.51 467.28
s 145.11 57.83 61.92
542 536 547
As can be seen, academic performance in Hong Kong is far above the mean for the other countries. The scores are not completely symmetrical, and they are not distributed in accordance with the normal curve. It would therefore not be appropriate to conduct any assessment based on the premise of interpreting scores in a typified way. However, as relevant explanatory information, it is worth showing the asymmetry values in the three tests:
Table 2. Frequencies, asymmetry and standard error of the data on performance
Reports N Asymmetry Standard error Sciences 57 5.911 0.316 Reading 56 -0.911 0.319 Mathematics 57 -0.883 0.316
In all three cases, the distributions are asymmetric. As a result, the value located in the middle, which is that of the median, exceeds the values in the case of the science scores, and in the case of reading and mathematics the mean is higher. In the three tests, the standard errors practically coincide.
Three Preliminary Issues
Although the present study’s aims are very complex, they are of deep educational relevance, especially with regard to political decision making. First of all, I will attempt a validation of the comprehensive division between
differentiated educational systems and integrated educational systems that I have already described. Second, I will use the multivariate technique of cluster analysis to validate the theoretical formulations that I have assumed. For this purpose, I will search from among the variables analysed and referred to in the PISA 2006 Reports for the variables that best define the theoretical grouping leading to the clusters established by Mons (2007), to then infer from the same variables, separately or in conjunction, the clusters that best define all the systems analysed by PISA, including Hong Kong education system. All of this will culminate in an acceptance or rejection of the formulations, hypotheses and theories that seek to contribute to a better understanding of the educational systems analysed by the OECD, in an attempt to identify and explain the benefits that the different educational systems comprise. To these ends, I have produced a database of the results from PISA 2006.
This report contains many variables. As I will explain later, I have chosen those which best suit my objectives. It is unquestionably worth explaining the large number of variables contained in the CD that accompanies the above-mentioned report. These variables hint at the rigour and quality of the work undertaken, which is not limited to establishing mean performance. More importantly, it is also worth exploring if these values have a use in setting ranges between countries,
which would facilitate and promote subsequent scientific development and lead to new theories about academic performance and its links with the development of research on various educational topics.
Answers to pertinent questions using Anova and cluster analysis
A) The firstquestion that I wish to answer is related to integrated and differentiated school systems. To do this, based on the variable of age of separation or optionality, I performed a principal analysis. I grouped age in four peer categories— that is, 17–16, 15–14, 13–12 and 11-10. The results obtained are extremely surprising and merit consideration and in-depth research. As I will explain later on, no significant differences in academic performance between percentiles according to the age of separation were revealed, although differences did tend to occur (as a trend) in favour of the groups in which the age of separation is greater. That is, higher academic performance occurred in those groups for which separation took place later, though there are some important nuances. The following tables set out the mean values for performance in each of the previously established areas. We should first of all consider the data relating to the lower percentiles, as intuition would suggest that this issue could affect the higher- and lower-performing students differently.
It should be pointed out that the structure of educational systems does not have an equal effect on students according to their level or degree of performance. The accuracy of this observation is confirmed if the type of students analysed are those who are located below the twenty-fifth percentile, as Dupriez, Dumay and Vause (2008)—whose work was awarded the George Bereday Prize by the Comparative and International Education Society(CIES)—have demonstrated. Indeed, I observed a trend of superior performance with an age of separation of 16–17 years, in both the fifth and tenth percentiles in reading and mathematics. The most significant data is revealed through observing that the second group in terms of highest performance is that of students for whom the age of separation or optionality occurs earlier, at 10–11 years. Therefore, discussion on the age of separation or optionality does not appear to be settled, though I would be forced to conclude that the age of separation must be carried out as late as possible or as soon as possible in the case of less well-performing students.
[image:4.595.60.263.275.318.2]Having set out the above description, at this point it would be appropriate to reiterate that the differences are not statistically significant (for = 0.05), as can be seen in the following table, which, nevertheless, reveals some very significant numeric data on the values of p, whose value decreases as the number of the percentile under analysis increases. This does not mean that analysing students according to the degree of academic performance ceases to be significant. It is an issue that must be kept in mind, especially if that analysis is carried out or interpreted in the light of other variables.
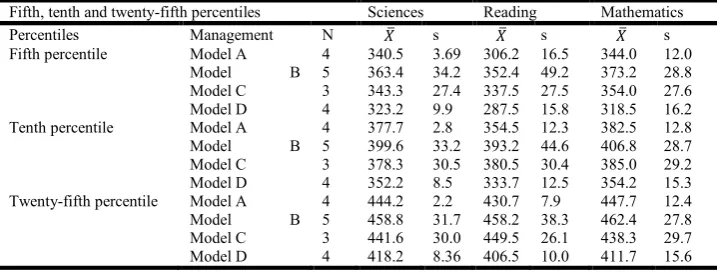
B) The second section of this study focuses on four conceptualized models. To recap: model A is the separation model; model B is the individual integration model; model C is the à la carte integration model; and model D is the uniform integration model. Here are the results:
[image:5.595.110.480.76.211.2]We can see that, constantly and systematically, there is a higher mean performance in the percentiles analysed in model B (individual integration), which has been implemented primarily in countries such as Finland, Norway, Sweden,
Table 3. Fifth, tenth and twenty-fifth percentiles in science, reading and mathematics
Fifth, tenth and twenty-fifth percentiles Sciences Reading Mathematics
Percentiles Age N s s s
Fifth percentile 16-17 14-15 12-13 10-11 17 22 9 8 330.4 336.6 311.8 334.6 41.5 51.2 49.8 33.5 311.2 296.2 277.5 290.5 51.6 95.5 65.9 37.0 332.1 327.1 312.0 324.7 55.6 99.4 61.5 37.1 Tenth percentile 17-16
14-15 12-13 10-11 17 22 9 8 363.7 347.0 345.3 367.6 43.9 53.9 49.5 35.1 350.7 319.6 321.5 334.7 51.4 71.9 62.4 37.9 364.1 344.9 347.1 359.5 56.1 65.6 61.2 37.9 Twenty-fifth percentile 17-16
14-15 12-13 10-11 17 22 9 8 440.0 399.9 403.69 425.6 48.2 60.2 50.5 39.6 414.4 381.2 391.5 404.8 51.8 74.1 57.2 39.1 416.9 397.9 403.3 418.6 47.1 67.4 58.8 42.2
Table 4. Seventy-fifth, ninetieth and ninety-fifth percentiles in sciences, reading and mathematics
Seventy-fifth, ninetieth and ninety-fifth percentiles Sciences Reading Mathematics
Percentiles Age N s s s
seventy-fifth percentile 16-17 14-15 12-13 10-11 17 22 9 8 459.0 520.5 534.0 560.2 55.5 72.0 53.8 43.7 542.0 508.1 530.4 546.2 51.7 71.9 43.8 32.7 536.2 516.8 534.7 548.5 57.8 72.1 64.1 44.5 Ninetieth percentile 17-16
14-15 12-13 10-11 17 22 9 8 603.9 573.1 586.8 617.5 55.1 71.4 50.9 38.8 593.6 560.1 583.7 600.0 51.4 67.4 38.0 27.9 589.0 570.4 587.6 607.7 55.8 69.6 61.8 39.9 Ninety-fifth percentile 17-16
[image:5.595.115.477.243.377.2]14-15 12-13 10-11 17 22 9 8 635.3 604.3 616.8 649.3 54.2 69.0 48.9 37.3 332.1 327.1 312.0 324.7 55.6 99.4 61.5 37.1 619.8 601.8 618.8 642.0 53.2 66.4 59.0 35.5
Table 5. ANOVA by percentiles according to age models
ANOVA Sciences Reading Mathematics
Percentiles F p F p F p
[image:5.595.115.476.512.648.2]Fifth percentile 0.633 0.597 0.374 0.772 0.138 0.937 Tenth percentile 0.697 0.558 0.898 0.449 0.401 0.753 Twenty-fifth percentile 0.747 0.529 0.974 0.412 0.432 0.731 Seventy-fifth percentile 1.142 0.341 1.436 0.243 0.614 0.609 Ninetieth percentile 1.446 0.240 1.677 0.184 0.819 0.499 Ninety-fifth percentile 1.585 0.204 1.839 0.152 1.003 0.399
Table 6. Fifth, tenth and twenty-fifth percentiles according to models for managing heterogeneity
Fifth, tenth and twenty-fifth percentiles Sciences Reading Mathematics
Percentiles Management N s s s
Fifth percentile Model A
Model B
Model C Model D 4 5 3 4 340.5 363.4 343.3 323.2 3.69 34.2 27.4 9.9 306.2 352.4 337.5 287.5 16.5 49.2 27.5 15.8 344.0 373.2 354.0 318.5 12.0 28.8 27.6 16.2 Tenth percentile Model A
Model B
Model C Model D 4 5 3 4 377.7 399.6 378.3 352.2 2.8 33.2 30.5 8.5 354.5 393.2 380.5 333.7 12.3 44.6 30.4 12.5 382.5 406.8 385.0 354.2 12.8 28.7 29.2 15.3 Twenty-fifth percentile Model A
Model B
Korea and Japan. Model D (uniform integration), which is followed principally in France, Italy, Spain Portugal and Spain, also stands out for its lower performance levels. I will now consider what happens upon assessing the performance of students in the higher percentiles, the data for which appears in the following table:
As can be seen, a similar trend to that of lower-performing students has been produced (model B, higher performance;
model D, lower performance). The one exception here relates to mathematics, where model A (separation model), reveals the highest performance. This indicator is not without importance, and it should be analysed together with other curricular considerations. However, contrary to the other previous considerations, in this case almost all of the variance analyses
carried out do show significant performance differences between the models analysed, as is shown in the following table: Once again, differences between high- and low-performing students can be perceived. In all three disciplines, significant differences arise when considering the four models in relation to the highest-performing students, which was not
so for the lower-performing students, except for mathematics (for =0.05, we should recall).
[image:6.595.117.481.161.295.2]C) Finally, I will turn my attention to a third question for my study, which entails attempting to understand the variables through which each one of the models can be better defined in light of the fact that, in principle, I have accepted a certain inequality between them, which therefore means that they may
Table 7. Seventy-fifth, ninetieth and ninety-fifth percentiles according to models for managing heterogeneity
Seventy-fifth, ninetieth and ninety-fifth percentiles Sciences Reading Mathematics
Percentiles Management N s s s
Seventy-fifth percentile
Model A
Model B
Model C Model D
4 5 3 4
584.2 586.6 586.0 550.5
2.0 27.2 17.3 14.3
572.0 584.4 579.5 541.0
6.6 24.6 19.0 18.0
587.2 584.2 560.3 539.0
13.6 25.5 25.1 19.3 Ninetieth percentile Model A
Model B
Model C Model D
4 5 3 4
636.2 638.8 643.6 603.5
4.0 25.1 13.5 14.3
623.0 635.4 632.5 591.2
6.7 20.2 16.2 19.5
641.0 636.0 613.3 592.2
11.6 23.0 21.0 18.0 Ninety-fifth percentile Model A
Model B
Model C Model D
4 5 3 4
665.0 668.4 676.0 633.7
5.0 23.8 12.2 14.1
651.7 663.6 663.5 618.2
7.0 17.8 14.8 19.3
670.2 665.4 644.0 622.7
[image:6.595.160.436.331.411.2]11.7 22.3 19.5 16.6
Table 8. Anova by percentiles according to models for managing heterogeneity
ANOVA Sciences Reading Mathematics
Percentiles F p F p F p
[image:6.595.136.457.446.547.2]Fifth percentile 2.246 0.135 0.304 0.061 4.488 0.025 Tenth percentile 2.352 0.124 3.283 0.062 3.967 0.035 Twenty-fifth percentile 2.434 0.115 3.336 0.060 3.889 0.037 Seventy-fifth percentile 3.548 0.048 4.296 0.031 4.539 0.024 Ninetieth percentile 4.389 0.026 5.573 0.014 5.625 0.012 Ninety-fifth percentile 4.884 0.019 7.012 0.007 5.826 0.011
Table 9. PISA 2006 variables that best explain each model
MODEL A Score in the ninety-fifth percentile in sciences, reading and mathematics From two to four weekly hours of class outside of the school
MODEL B Repetition in the first stage of secondary system Repetition in the second stage of secondary system MODEL C Ratio
High family qualification level
Percentage of students in the highest-level category in science Four or more weekly hours of class outside the school
[image:6.595.66.528.582.661.2]MODEL D Score in the twenty-fifth percentile in science, reading and mathematics Four weekly hours of class outside the school
Table 10. Classification of the educational systems of the countries according to the Heterogeneity Models
“Separation” model Germany, Australia, Austria, Belgium, Netherlands, Liechtenstein, Czech Republic, Switzerland “Individual integration” model South Korea, Denmark, Finland; Hong Kong-China, Ireland, Iceland, Japan, Macau-China, Norway,
Sweden, Taiwan
“A la carte integration” model Canada, United States, Israel, New Zealand, United Kingdom
“Uniform integration” model Argentina; Chile, Croatia, Greece, Slovenia, Spain, France, Italy, Latvia, Lithuania, Luxembourg, Portugal
be better explained with certain variables than with others. Accordingly, I will attempt to infer the models of the fifty-six countries referred to in the report, with the logical limitations posed by this interpretation. I have already mentioned the high number of variables referred to in the PISA-2006 Report. From among them, I have extracted the following: scores for sciences, reading and mathematics for the fifth, tenth, twenty-fifth, ninetieth and ninety-fifth percentiles, as well as the age of separation, the lower and upper qualifications of parents, repetition of the first and the second stages of secondary education, grouping or otherwise of students, ratio of students per group, two hours or fewer of class outside the school per week, and four hours or more of them. In short, there are sixteen variables through which I will attempt to find clusters that will help us to better understand the policies implemented in different countries. In SPSS, the nonhierarchical procedure (k-means) allows ANOVA to be applied to confirm the significance of the variables. This is therefore the first decision to be taken. However, it is also necessary to recall the categorization established by Mons (2004). It is undoubtedly a reasoned and reasonable classification, though the actual data may question such a categorization and effectiveness of each model. In any case, this classification can be considered sufficiently reasoned and reflexive for it to be able to be submitted for testing. Here for each model are the selected variables, or those which best explain the model:
After carrying out many and varied tests with input and output of variables, according to the nonhierarchical model of cluster analysis, I was able to bring out the variables associated with each of the four models. As we can see, the interpretative complexity is very high.
There is only one variable that features across three models (A, C and D): the number of hours per week outside the school. Only in two models (A and D), does performance appear as an element of explanation. In one case (model A), it is high performance (ninety-fifth percentile), while in the other (model D), it is low performance (twenty-fifth percentile). Model C presents a more complex interpretative profile, while model B is simply understood based on the percentages of repetition in the first and second stage of secondary education. Once more, we can see the mean performance by percentiles, including for the rest of the countries that I have considered it relevant to add, at the same time as forming a new category that I have called indefinite models. This category covers 35% of the countries that participated in the study. It is worth making the comment once more that model B (individual integration model) is the one in which countries display a superior academic performance. We should recall that this model has a long common trunk with organized classes, individualized instruction for almost all students, high school
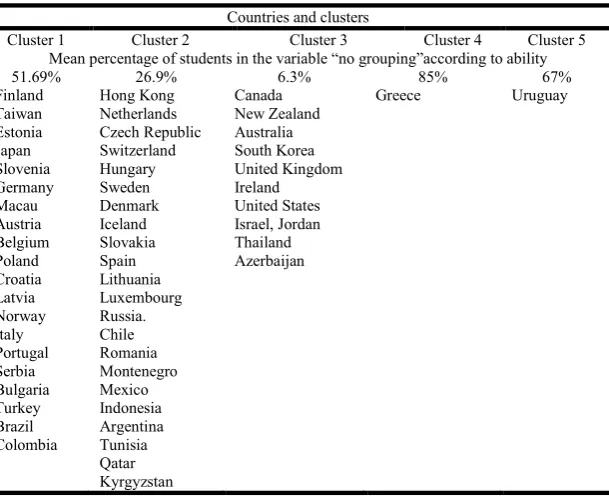
Table 11. Clustering based on the variable “no grouping”
Countries and clusters
Cluster 1 Cluster 2 Cluster 3 Cluster 4 Cluster 5 Mean percentage of students in the variable “no grouping”according to ability
51.69% 26.9% 6.3% 85% 67%
Finland Taiwan Estonia Japan Slovenia Germany Macau Austria Belgium Poland Croatia Latvia Norway Italy Portugal Serbia Bulgaria Turkey Brazil Colombia
Hong Kong Netherlands Czech Republic Switzerland Hungary Sweden Denmark Iceland Slovakia Spain Lithuania Luxembourg Russia. Chile Romania Montenegro Mexico Indonesia Argentina Tunisia Qatar Kyrgyzstan
Canada New Zealand Australia South Korea United Kingdom Ireland United States Israel, Jordan Thailand Azerbaijan
[image:7.595.149.454.382.630.2]Greece Uruguay
Table 12. Mean performance per cluster according to the variable “no grouping”
Mean performance N Sciences Reading Mathematics
s s s
qualification levels and automatic advancement through the school system for students, and no repetition as an adjustment system. All countries grouped in the new, undefined category display a mean performance that is lower in all the percentiles analysed. And the overall logic is determined by this order: Model B (individual integration model), Model A (separation model), Model C (à la carte integration model) and Model D (uniform integration model).
Further cluster analysis according to particular relevant variables
I performed five sets of cluster analysis to assess mean student performance, revealing the influence on performance of each of the variables considered in this study.
No grouping of students based on ability
The data available for the purpose of carrying out an assessment of how educational decisions based on this variable can have an influence on students according to ability is the percentage of “ungrouped” students of each country listed in the report; it is described in the following table:
In the previous table, we can see that the highest percentage of students who are not grouped by their ability occurs in clusters 4 and 5. These clusters cannot be discussed since in both cases they comprise only one country each.
[image:8.595.141.466.395.801.2]If we exclude those two clusters and compare the other three, we observe that the mean performance data outlined in the following table do not offer differences worth highlighting among academic disciplines, though we can confirm that cluster 3 does not match clusters 1 and 2 in terms of its performance, while also being the cluster that contains educational systems with the lowest percentage of ungrouped students. We can see that the cluster to which Hong Kong belongs has the highest performance level in the three disciplines, though the following table shows that there are no significant differences between clusters and academic disciplines. As a conclusion regarding the assessment of “no grouping of students” based on ability, the data do not indicate that such a decision is negative. Rather, it seems to suggest a premise commented on at the beginning of the work, namely the benefits that must be offered to the student by the possibility of freely showing his or her capacity without any selection, regardless of orientation (Crahay, 2003).
Table 13. ANOVA by clusters according to the variable “no grouping”
ANOVA Sciences Reading Mathematics
F p F p F p
MEAN 1.021 0.406 1.105 0.365 0.802 0.530
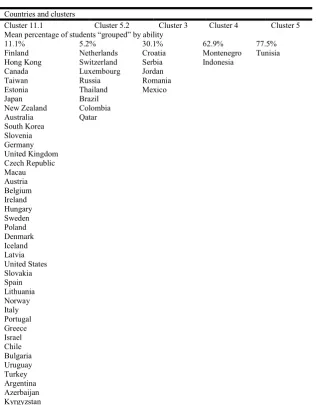
Table 14. Clustering based on the variable “grouping”
Countries and clusters
Cluster 11.1 Cluster 5.2 Cluster 3 Cluster 4 Cluster 5 Mean percentage of students “grouped” by ability
11.1% 5.2% 30.1% 62.9% 77.5%
Finland Hong Kong Canada Taiwan Estonia Japan New Zealand Australia South Korea Slovenia Germany United Kingdom Czech Republic Macau Austria Belgium Ireland Hungary Sweden Poland Denmark Iceland Latvia United States Slovakia Spain Lithuania Norway Italy Portugal Greece Israel Chile Bulgaria Uruguay Turkey Argentina Azerbaijan Kyrgyzstan
Netherlands Switzerland Luxembourg Russia Thailand Brazil Colombia Qatar
Croatia Serbia Jordan Romania Mexico
Montenegro Indonesia
Grouping of students based on ability
In the following table, we first of all see the percentage of students who are grouped as the mean in each country; this is very similar, as a whole, to that of ungrouped students, also with regard to all the analysed countries. What stands out is that the majority of countries do not have a high percentage of students in this variable, and that it corresponds to thirty-nine educational systems, while in the remaining sixteen the mean percentage of students is significantly higher, except in cluster 2.
It seems to be clear, then, that the two clusters with the highest percentage of grouped students contain the smallest number of countries. The following table shows mean performance according to each cluster:
The mean performance in the education systems from the first grouping is significantly higher than the rest of those of the other clusters. The ANOVA carried out could not be more conclusive, with significant values in terms of differences in performance between the clusters in the three disciplines analysed.
Number of students (ratio) per classroom
The number of pupils per classroom, the so-called ratio, is a method of accounting analysis. By definition, it is a ratio or quotient between two quantities: in this case, the number of students enrolled in the school and the number of classrooms in operation. It is possible to accept the relevance of this variable insofar as it can be linked to academic performance.
Table 15. Mean performance by cluster according to the variable “grouping”
Mean performance N Sciences Reading Mathematics
s s s
Cluster 1 (11.1%) 39 488.00 48.52 475.07 53.10 485.87 49.08 Cluster 2 (45.2%) 8 443.75 65.22 429.00 66.19 435.75 80.48 Cluster 3 (30.1%) 5 435.80 33.33 417.00 33.91 421.40 31.38 Cluster 4 (62.9%) 2 402.50 13.43 392.50 0.70 395.00 5.65 Cluster 5 (77.5%) 1 386.00 --- 380.00 --- 365.00
Table 16. ANOVA by clusters according to the variable “grouping”
ANOVA Sciences Reading Mathematics
F P F P F P
[image:9.595.148.441.270.341.2]MEAN 4.033 0.007 3.587 0.012 4.604 0.003
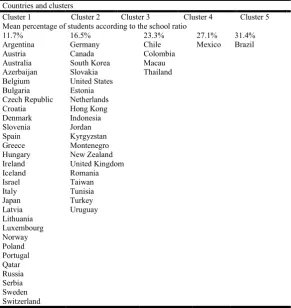
Table 17. Clustering according to the variable school ratio
Countries and clusters
Cluster 1 Cluster 2 Cluster 3 Cluster 4 Cluster 5 Mean percentage of students according to the school ratio
11.7% 16.5% 23.3% 27.1% 31.4%
Argentina Austria Australia Azerbaijan Belgium Bulgaria Czech Republic Croatia Denmark Slovenia Spain Greece Hungary Ireland Iceland Israel Italy Japan Latvia Lithuania Luxembourg Norway Poland Portugal Qatar Russia Serbia Sweden Switzerland
Germany Canada South Korea Slovakia United States Estonia Netherlands Hong Kong Indonesia Jordan Kyrgyzstan Montenegro New Zealand United Kingdom Romania Taiwan Tunisia Turkey Uruguay
Chile Colombia Macau Thailand
[image:9.595.151.443.444.753.2]The above data clearly show that most of the countries do not have classrooms with high numbers of students, given that the ratio in 89% of the education systems is at around 11.7. In terms of performance, the first cluster of countries is where we can observe a mean performance that is higher than others, although as we will see later, the differences are not statistically significant. We can see that statistically significant differences according to school ratio do not occur in any case.
Four hours or more per week of classes outside the school
The data from the PISA Report bring together two variables that, in my understanding, should be taken into account.
One of them is the variable two hours to a maximum of four hours per week of classes outside of the school; and the other is four or more hours per week outside the school—or what is known as a private lesson. I will now analyse and evaluate the influence of the latter. We can see that statistically significant differences according to school ratio do not occur in any case.
Four hours or more per week of classes outside the school
The data from the PISA Report bring together two variables that, in my understanding, should be taken into account. One of them is the variable two hours to a maximum of four hours per week of classes outside of the school; and the other is four
Table 18. Mean performance by clusters according to the variable school ratio
Mean performance “no grouping” N Sciences Reading Mathematics
MEAN s M S s
[image:10.595.116.483.237.308.2]Cluster 1 (11.47%) 39 482.16 45.35 466.30 51.44 479.83 46.51 Cluster 2 (16.5%) 19 469.94 65.88 455.94 71.40 464.15 72.03 Cluster 3 (23.3%) 4 439.50 51.99 434.00 45.15 430.75 66.21 Cluster 4 (27.1%) 1 410.00 --- 310.00 406.00 ---- Cluster 5 (31.4%) 1 390.00 --- 393.00 370.00 ----
Table 19. ANOVA by clusters according to the variable school ratio
ANOVA Sciences Reading Mathematics
F p F p F p
MEAN 1.540 0.205 0.793 0.535 1.733 0.158
Table 20. Clustering according to the variable four hours of class per week outside of the school
Countries and clusters
Cluster 1 Cluster 2 Cluster 3 Cluster 4 Cluster 5 Mean percentage of students according to “weekly class” outside of the school
1.7% 4.9% 13.9% 10.5% 7.7%
Germany Argentina Australia Austria Belgium Brazil Canada Czech Republic Chile South Korea Croatia Denmark Slovakia Slovenia United States Estonia Finland France Netherlands Ireland Iceland Italy Japan Latvia Liechtenstein Lithuania Luxembourg New Zealand Poland Portugal United Kingdom Serbia Sweden Switzerland Taiwan Uruguay
Bulgaria Colombia Spain Hong Kong Hungary Indonesia Israel Macau Mexico Montenegro Romania Russia Thailand
Greece Tunisia
Turkey Jordan
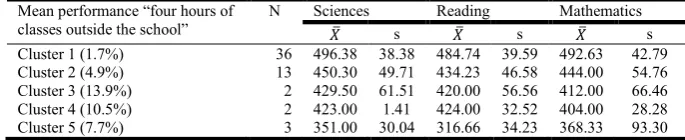
[image:10.595.160.451.410.784.2]or more hours per week outside the school—or what is known as a private lesson. I will now analyse and evaluate the influence of the latter. It is possible to ascertain a detail of great importance: the percentages of students attending classes outside of school for four or more hours a week is very low and in some cases, such as the cluster 1, virtually nonexistent. The mean performance values observed in the previous table lead to the conclusion that the number of hours of weekly class does not affect academic performance, given the low percentage of students who make use of this type of resource. It does not necessarily improve performance. We should note the existence of significant differences in performance in the three academic disciplines.
Advanced family professional qualification
[image:11.595.126.469.236.306.2]In any study on academic performance, the variable of family conditioning—in its economic, social and cultural forms— always seems to be present. In this case, what is globally taken into account is qualification level, which supposedly groups the favourable (economic and cultural) assets that could determine academic performance. The first detail worthy of highlighting in the following table is the high number of educational systems that are grouped into each of the five clusters (ten in the first, nine in the second, thirteen in the third, seven in the fourth and fifteen in the fifth). Cluster 3 brings together countries with the highest percentage of families with the highest qualifications.
Table 21. Mean performance by clusters according to the variable four hours of class per week outside of the school
Mean performance “four hours of classes outside the school”
N Sciences Reading Mathematics
s s s
Cluster 1 (1.7%) 36 496.38 38.38 484.74 39.59 492.63 42.79 Cluster 2 (4.9%) 13 450.30 49.71 434.23 46.58 444.00 54.76 Cluster 3 (13.9%) 2 429.50 61.51 420.00 56.56 412.00 66.46 Cluster 4 (10.5%) 2 423.00 1.41 424.00 32.52 404.00 28.28 Cluster 5 (7.7%) 3 351.00 30.04 316.66 34.23 368.33 93.30
Table 22. ANOVA by clusters according to the variable “four hours of class outside the school”*
ANOVA Sciences Reading Mathematics
F P F P F P
[image:11.595.138.459.424.605.2]MEAN 11.724 0.000 14.173 0.000 7.645 0.000 * = 0.05
Table 23. Clustering based on the variable “family professional qualification”
Countries and clusters
Cluster 1 Cluster 2 Cluster 3 Cluster 4 Cluster 5 Mean percentage of students according to “family professional qualification”
56.3% 31.3% 67.0% 40.8% 48.7%
Azerbaijan Belgium Czech Republic Denmark Estonia Finland Greece Ireland Russia Switzerland Taiwan
Chile. Hong Kong Indonesia Macau Mexico Portugal Romania Thailand Tunisia Turkey
Canada New Zealand Australia Netherlands Liechtenstein South Korea United Kingdom Sweden Iceland United States Norway Israel Jordan
Argentina Brazil Colombia Croatia Spain Japan Uruguay
Germany Austria Bulgaria Slovakia Slovenia France Hungary Italy Kyrgyzstan Latvia Lithuania Luxembourg Montenegro Poland Serbia
Table 24. Mean performance per cluster according to the variable “family professional qualification”
Mean performance “no grouping” N Sciences REAding Mathematics
s S s
Cluster 1 (56.3%) 11 499.60 46.41 481.00 50.67 508.81 29.11 Cluster 2 (31.3%) 10 441.70 51.31 438.50 49.60 436.70 58.38 Cluster 3 (67.0%) 13 501.61 33.10 495.33 40.97 497.30 43.75 Cluster 4 (40.8%) 7 444.14 59.19 428.71 49.33 431.14 60.71 Cluster 5 (48.7%) 15 471.60 51.94 453.33 59.29 464.60 54.18
Table 25. ANOVA by clusters according to the variable “family professional qualification”
ANOVA Sciences Reading Mathematics
F P F P F P
[image:11.595.121.478.636.705.2] [image:11.595.182.420.735.769.2]The cluster with the lowest percentage of families in the same variable is cluster 2. The following table shows the mean performance values for each of the clusters. The higher mean performance values coincide with the countries that have the highest percentage of families with advanced qualifications, though not uniformly across academic disciplines. In this last table, we can see significant differences between clusters according to academic performance. To conclude, and in an attempt to summarize some of the conclusions pertaining to the education system in Hong Kong, once again it can be stated that academic performance is the product of conditioning by multiple factors. This can easily be confirmed through successive analyses of personal, social and cultural variables and their influence on that performance. However, in the long run, not all political, administrative and pedagogical decisions produce the same effect. And it is this aspect which should be explored in more depth through research projects with a greater scope. Hong Kong’s educational model is characterized by individual integration, long stages and the objective being the student and not the group. Moreover, it features a moderate grouping of pupils based on ability, a low school ratio, few class hours outside of the school and a not particularly high level of family qualification. It belongs to group B, which is characterized by its high level of academic performance.
REFERENCES
Broadfoot, P. (Ed.) 1999. Profiles and Records of
Achievement: A Review of Issues and Practice. Oxford: Open University Press.
Demeuse, M, Crahay, M. y Monseur, C. 2001. Efficiency and equity, en Hutmascher, w., Cochrany Bottani, n. (EDI). Dorcrech: Kluwer.
Dupriez, V y Draelants, H. 2004. Clases homogènes versus clases héterogènes: los aports de la recherche a l’analyse de la problermatique. Revue Française de Pèdagogie, 148, 145-166.
Dupriez, V y Dumay, X. 2005. L’égalité dfes chances à l’écoles: analyse d’un efect spécifique de la structure scolaire. Revue Française de Pédagogie, 150, 5-17. Mons, N. 2004. Les nouvelles politiques éducatives. París:
Seuil.
OCDE, 2008. Informe PISA- 2006. Competencias científicas para el mañana. París: OCDE
Craay, M. y Delhaxe, A 2004. L’enseignement secondaire inférieurentre cultura de l’intégration at cultura de la différenciational. París: Ministére de la Recherche.
Dupriez, V. Dumay, X., y Vause, A. 2008. How Do School Syystems manage Pupils’Hetyerogeneity?Comparative Educationm Review, 52 (2), 245-273.