PERFORMANCE EVALUATION OF SHADOW DETECTION
AND REMOVAL FROM HIGH RESOLUTION IMAGES
USING K-MEANS ALGORITHM AND IOOPL MAPPING
ALGORITHM
1
ARULANANTH T S, 2ARUL DALTON G
1
Professor, Department of ECE,
2
Professor, Department of CSE,
1&2
MLR Institute of Technology, Hyderabad, India
E-mail: [email protected], [email protected]
ABSTRACT
Shadow detection and removal is very essential to process the images in the next level. Generally high resolution color remote sensing images are put it forward an object oriented shadow detection and removal technique. In this method shadow features are also taken into consideration during image segmentation and to the statistical features of the images, suspected shadows are extracted. Moreover some dark objects which could be mistaken for shadows are ruled out according to object properties and spatial relationship between objects. So we are introducing the Inner–Outer Outline Profile Line IOOPL matching is used for shadow removal. Inner Outer Outline Profile Line (IOOPL) matching obtained with respect to the boundary lines of shadows. Shadow removal is then performed based on the homogeneous sections attained through IOOPL. Similarity for matching we have to extract the Inner and Outer Outline Lines of the boundary of shadows. Thus grayscale values of the corresponding points of the Inner and Outer Outline Lines are indicated by the Inner–Outer Outline Profile Lines IOOPL.
Keywords: IOOP, K-Means clustering, Shadow detection, Shadow removal, Reconstruction
1. INTRODUCTION
We all know that shadow is caused by the interaction of light with objects. Shadows leads to the failure of images. Shadows are classified into two they are self shadows and cast shadows. Self-shadow is a shadow on a subject on the side that is not directly facing the light source. Cast shadow is defined as the shadow of a subject falling on the surface of another subject because the former subject has blocked the light source. Cast shadows are of two types- umbra and penumbra. Due to multiple lighting, these regions are created. The umbra is created because the direct light has been completely blocked. But penumbra is created by something partially blocking the direct light. Several methods are available for shadow detection based on intensity, pixel values, Region growing, Dual-pass Otsu, and Gradient based, Support Vector Machine (SVM) Method and Pixel Intensity based, etc.
Accuracy of the existing system could not
produce better in image detection and
reconstruction. Using these algorithms shadow can be detected and removed successfully using all methods but some methods only support for image reconstructed. But in this paper presenting only two different methods for shadow detection, removal and reconstruction using IOOPL and K-Means clustering and results are compared.
2. LITERATURE SURVEY
1817-3195
shadow areas. The resulting image will allow performing first a binary classification in order to distinguish between shadow and non-shadow regions. Using HSV color model [7] presents an efficient and simple approach for shadow detection and removal in complex urban color remote sensing images for solving problems caused by shadows. P.Srinivasulu et.al [8] extracting shadows from a single outdoor image is presented. Based on image formation theory relationship between shadow and its non shadow background is derived based on image formation theory. Yan li et.al [9] presents methodology to automatically detect and remove the shadows in high-resolution urban aerial images for urban GIS applications. The system includes cast shadow
computation, image shadow tracing a
detection, and shadow removal. The method based on a region growing process [10] presents a simple and effective procedure to segment shadow regions on high-resolution color satellite images on a specific band. A novel processing chain for shadow detection and reconstruction in VHR images [11] main aim of this chain process is not only detect shadow region form image but also remove shadow region and reconstruct shadow less image. Using an (ICA) algorithm, gray scale
histogram, RGB channels, HIS space
transformation and multi-threshold retinex [12] to achieve the shadow detection and
compensation method. Tapas Kanungo
et.al[13] present a simple and efficient implementation of Lloyd's K-Means clustering algorithm, which call the filtering algorithm. Qiang He1et.al [14] shadow removal method based on intrinsic image decomposition on a single color image using the Fisher Linear Discriminate (FLD).
3. PROPOSED SYSTEM
This paper compares the various
performance results of two methods for shadow detection, removal and reconstruction. The first method is using IOOPL (Inner Outer Outline Profile Line) and another using K-Means clustering. In both methods, the removal is done by same approach but the shadow detection is done by different approach.
3.1Method-I: IOOPL (Inner Outer Outline Profile Line)
By Inner Outer Outline Profile Line method, shadow features are also taken into consideration during image segmentation and then, according to the statistical features of the images, suspected shadows are extracted. Furthermore, some dark objects which could be mistaken for shadows are ruled out according to object properties and spatial relationship between objects. For shadow
removal, inner–outer outline profile line
(IOOPL) matching is used. First, the IOOPLs are obtained with respect to the boundary lines of shadows. Shadow removal is then performed according to the homogeneous sections attained through IOOPL similarity matching. Here the first step is the segmentation where watershed algorithm is used. The watershed transform is used to search for regions of high intensity gradients (watersheds) that divide neighboring local minima (basins Watershed Segmentation). The
key behind watershed transform for
segmentation is to change the image into another image whose catchment basins are the objects which we want to identify. After
segmentation thresholding is done to
1817-3195
3.2 Method-II: K-Means Clustering
Here mask is created by using an adaptation method. One of the drawbacks of this mask is that it cannot identify the accurate edges and shadow areas. So an improved method for shadow detection is used called k-means clustering. Clustering is the process of partitioning a group of data points into a small number of clusters. Here cluster number is decided on the basis of data points and clustering is done. In K-Means clustering the main parameter for classifying data points into cluster is distance measurement. Each point is included in the cluster on the basis of minimum distance. After clustering the cluster which is showing the shadow portion and the mask is compared and perfect shadow area is identified. After that for each and every point in the mask image and in the original image, the pixel values are identified and the difference in the intensity or pixel variation is found. Using this difference value the color in the shadow portion is refilled. Shadow areas are viewed as unwanted information which affects the quality of an image. When the light source is illuminated on any object the shadow is observed on the other side of the object. The detection and compensation of shadow is important hotspot and difficulty of remote sensing image processing. There are different methods for detection and removal of shadows from images. The literature reports mainly two approaches to detect shadows namely model-based and shadow property model-based approaches.
Model-based methods the 3D
geometry and illumination of the scene are assumed to be known. This includes the sensor/camera localization, the light source direction, and the geometry of observed objects, from which a priori knowledge of shadow areas is derived. For example, we can consider polygonal regions to approximate the shadows of buildings or urban elements in some simple urban scenes. However, in complex scenes with a great diversity of geometric structures, as it is usually the case of Quick Bird images, these models are too restrictive to provide a good approximation. In addition, in most applications the geometry of scene and/or the light sources are unknown. Mountainous areas (topographic shadow), cloud shadows and composite shadows. Paper reviews the dominant shadow correction
methods for both steps. Here for the segmentation watershed algorithm is used. The key behind using the watershed transform for segmentation is change your image into another image whose catchment basins are the objects you want to identify.
3.3 Algorithm for K-Means Clustering
Step 1: Obtain an image with shadow.
Step 2: Mark the foreground objects or Mask creation.
According to this concept areas that would be in sunlight are highlighted and areas that would be in shadow are shaded. It is important to note that the relief algorithm identifies shadowed areas, i.e., those that are not in direct sun. However, this algorithm does not calculate the shadow that is cast by topographic features onto the surrounding surface. Apart from these methods, there are other less commonly used algorithms for detecting shadow regions, for example, the automatic cloud/shadow detection method, the Self-Adaptive Feature method the detection of shadow based on pulse coupled neural networks, object-based shadow extraction, and visual interpretation. Thresholding is the most common approach for detecting shadow regions. This method is useful in many shadow detection applications, since it is simple, quick and available in most commercial and non-commercial remote sensing software.
Mathematical morphology is one of the data processing methods that is extremely useful for image processing and has many applications, such as, boundary extraction ,noise elimination, shape description, texture analysis, and so on. The mathematical base of morphological processing is dilation and erosion which are described by set analysis and can be expressed in logical AND, OR notation .The objective of this project is to performing binary dilation and erosion with an arbitrary structuring element of size 3 x 3 and that can be extracted the boundary or edge of an image.
Step3: Computing the opening-by-reconstruction of the image.
1817-3195
the sun elevation angle, and the azimuth of the sun. Before detecting shadowed regions, the accurate height value of a building must be acquired for precise shadow effect correction. The building height could be acquired directly using LIDAR data. The LIDAR data within the building polygon had two homogeneous values. One value represented the height of the bulk of the building, while the other value represented the building height except its bulk.
Step 4: Following the opening with a closing can remove the dark spots and stem marks.
In the next stage, the detected shadowed regions are segmented according to land surface type using the attribute date of the digital maps. Finally, the shadow effects were corrected for each of the segmented shadowed regions. To solve this problem, a polygon representing the bulk of the building was added. The boundary between the bulk and other part was delineated. To detect shadowed regions, in addition to building height, solar positions are required at the time of image acquisition. Here three basic assumptions are there to accomplish shadow treatment in aerial images were considered. These were:
• Complete information loss of region
hindered by shadow does not occur.
• The influence of cast shadow caused
by each object is uniform.
• The DN value of similar surface
cover characteristic is uniform.
After the morphological filtering one need to do the border creation for shadow portion and non-shadow portion. Such classification allows the localization of the available couples of shadow and non-shadow related to the same object and, thus, to define the spectral relationship between them as a means to perform the reconstruction of the shadow areas.
Step 5: Calculate the regional maxima to obtain good foreground markers.
Step 6: Superimpose the foreground marker image on the original image.
Notice that the foreground markers in
some objects go right up to the objects' edge In particular; the reconstruction is based on a linear regression method to compensate shadow regions where the intensities of the shaded pixels are adjusted according to the
statistical characteristics of the corresponding non-shadow regions. Finally, the border between the reconstructed shadow and the
non-shadow areas undergoes a linear
interpolation operation to yield a smooth transition between them.
Step 7: cleaning the edges of the marker blobs and then shrinking them a bit.
Using HSV (Hue, Saturation, Value) color model presents an efficient and simple approach for shadow detection and removal in complex urban color remote sensing images for solving problems caused by shadows. In the proposed method shadows are detected using normalized difference index and subsequent thresholding based on Otsu’s method. Once the shadows are detected they are classified and a non-shadow area around each shadow termed as buffer area is estimated using morphological operators. The mean and variance of these buffer areas are used to compensate the shadow regions.
Step 8: Visualize the Result.
One of the techniques is to
superimpose the foreground markers,
background markers, and segmented object boundaries. To rule out the non-homogeneous sections, the IOOPL is divided into average sections with the same standard. If the correlation coefficient is large, it means that the shade and light fluctuation features of the IOOPL line pair at this section are consistent. If consistent, then this line pair belongs to the
same type of object, with different
illuminations, and thus is considered to be matching.
If the correlation coefficient is small, then some abnormal parts representing some different types of objects exist in this section; therefore, these parts should be ruled out.
Shadows are removed by using the
homogeneous sections obtained by line pair matching. There are two approaches for shadow removal. One approach calculates the
radiation parameter according to the
1817-3195
homo-morphologic filtering. These methods adjust the intensity of each pixel in the image, instead of locally processing the shadow area.
Step 9: Thresholding by otsu’s method. Thresholding is done by otsu’s method. It is to classify the segmented regions in two classes based on the threshold value. Threshold value is calculated using an algorithm called ostu’s algorithm.
The steps involved in thresholding are:
• Compute histogram and probabilities of
each intensity level
• Set up initial and Step through all
possible thresholds maximum intensity
1. Update probability and mean
2. Compute the threshold (variance)
• Desired threshold corresponds to the
maximum
• You can compute two maxima (and two
corresponding thresholds) is the greater max and is the greater or equal maximum
Desired threshold = threshold1 + threshold 2
4. EXPERIMENTAL RESULTS
The experiment is conducted by using
different images. The experiment shows that using both methods the shadows can be detected and removed, but the output is more accurate using K-Means clustering method. Using IOOPL technique sometimes there occurs some color variations in non shadow region which reduces the quality of image and also, the data in the shadow area are not perfectly reconstructed. So Compared to IOOPL method, clustering using K-Means method is better. The result for two images using these two techniques is given below.
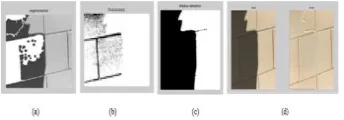
Figure 1: Experimental Result For IOOPL Of Image1 (A)Segmented Image (B) Threshold Image (C) Shadow Detected Image (D) Original And Shadow Removed Image
Figure 2: Experimental Result Of K-Means Clustering Of Image1 (A) Object In Cluster 1 (B) Object In Cluster 2 (C) Object In Cluster 3 (D) Original And Shadow Removed Image
[image:5.612.342.538.341.403.2]Figure 3: Experimental result for IOOPL of image 2 (a) Segmented image (b) Threshold image (c) Shadow detected image (d) Original and Shadow removed image
Figure 4: Experimental result of K-Means clustering of Image2 (a) Object in cluster 1 (b) Object in cluster 2 (c) Object in cluster 3 (d) Original and Shadow removed image
Means and variances:
Consider that we have an image with ‘L’ gray levels and its normalized histogram (i.e., for each gray-level value i, P(i) is the normalized frequency of i). Assuming that we have set the threshold at T, the -normalized- fraction of pixels that will be classified as background and object will be:
The formulas to find the mean and variance which we have implemented in the Matlab according to the statistical are as follows.
)
1
)
(
)
(
)(
(
)
(
)
(
)
(
1 1
=
+
=
=
∑
∑
+ = =
T
q
T
q
i
P
T
q
i
P
T
q
o L
T i
b O
T
i b
(1)
[image:5.612.107.279.600.660.2]1817-3195
∑
∑
∑
= = ==
=
T i b T i T ib
iP
i
T
q
i
P
i
iP
T
1 11
(
)
)
(
1
)
(
)
(
)
(
µ
(2)∑
=
∑
∑
=
+ = + = + = L T i o L T i L T io
q
T
iP
i
i
P
i
iP
T
1 1 1)
(
)
(
1
_
)
(
)
(
)
(
µ
(3)The mean gray-level value over the whole image (grand mean) is:
∑
∑
∑
= = = = = L i L i Li iP i
i P i iP 1 1
1 ( )
) ( ) ( µ (4)
The variance of the background and the object pixels will be
) ( ) ( ) ( 1 ) ( ) ( ) ( ) ( 1 2 1 1 2
2 i Pi
T q i P i P i T T i b b T i T i b b
∑
∑
∑
= = = − = − = µ µ σ (5) ) ( ) ( ) ( 1 ) ( ) ( ) ( ) ( 1 2 1 1 2 2 i P i T q i P i P i T L T i o O L T i L T i o o∑
∑
∑
+ = + = + = = − − = µ µ σ (6)The variance of whole image
)
(
)
(
1 2 2i
P
i
L i∑
=−
=
µ
σ
(7) 5. CONCLUSIONIn this paper we have compared two different methods of shadow detection, removal and reconstruction of images. It is evident from the experimental results that K-Means provide better and accurate shadow detection by precisely detecting the edges of shadow. Also by using pixel comparison precise reconstruction of image becomes possible.
REFRENCES:
[1] Amirreza shahtahmassebi, Yang Ning,
Wang Ke, Nathan Moore, Shen
Zhangquan “Review of Shadow Detection and De-shadowing Methods in Remote
Sensing” springer Science Press
www.springerlink.com/content/1002-00631.
[2] D. Sunil Kumar1, M.Gargi2 “An Approach in Shadow Detection and Reconstruction of Images” International Journal of Application or Innovation in Engineering & Management (IJAIEM) Volume 2, Issue 7, July 2013.
[3] Paul M. Dare “Shadow Analysis in High-Resolution Satellite Imagery of Urban
Areas” American Society for
Photogrammetry and Remote Sensing.
[4] Luca Lorenzi, , Farid Melgani, and
Grégoire Mercier “ A Complete
Processing Chain for Shadow Detection and Reconstruction in VHR Images” IEEE transactions on geo science and remote sensing, vol. 50, no. 9, september 2012
[5] Hong-Gyoo Sohn and Kong-Hyun Yun “Shadow-Effect Correction in Aerial
Color Imagery” Photogrammetric
Engineering & Remote Sensing Vol. 74, No. 5, May 2008, pp. 611–618.
[6] Supriya A. Hadke, Shweta Khare, Hema Singh “A Review “Reconstruction of
Shadow Areas in VHR Images”
International Journal of Innovative
Research in Science, Engineering and Technology Vol. 2, Issue 11, November 2013
[7] Krishna Kant Singh ,Kirat Pal ,M.J.Nigam “Shadow Detection and Removal from Remote Sensing Images Using NDI and Morphological Operators” International Journal of Computer Applications (0975 – 8887) Volume 42– No.10, March 2012
[8] E.Anil kumar, P.Srinivasulu “shadow and non shadow detection using tricolor attenuation model” International Journal of Recent Technology and Engineering (IJRTE) ISSN: 2277-3878, Volume-1, Issue-3, August 2012
[9] Yan li , tadashi sasagawa , peng gong “A system of the shadow detection and shadow removal for high resolution city aerial photo”
1817-3195
Journal of Remote Sensing Vol. 29, No. 7, 10 April 2008, 1945–1963
[11] R. K. Nale. and S. A. Shinde “A novel processing chain for shadow detection and
reconstruction in vhr images”
International Journal of Advances in Engineering & Technology, Jan. 2014.
[12] Chengfan LI, Jingyuan YIN*, Junjuan ZHAO, Feiyue YE “Detection and Compensation of Shadows based on ICA Algorithm in Remote Sensing Image” International Journal of Advancements in
Computing Technology Volume 3,
Number 7, August 2011
[13] Tapas Kanungo,Nathan
S.Netanyahu,Christine D.Piatko,Ruth
Silverman and AngelaY.Wu,“An Efficient K-Means Clustering Algorithm:Analysis And Implementation” Ieee Transactions On Pattern Analysis And Machine Intelligence, Vol. 24, No. 7, July 2002