http://dx.doi.org/10.4236/jtts.2014.41001
Crash Severity Analysis of Single Vehicle
Run-off-Road Crashes
Sunanda Dissanayake, Uttara Roy
Department of Civil Engineering, Kansas State University, Manhattan, USA Email: Sunanda@ksu.edu
Received August 22, 2013; revised September 23; 2013; accepted October 21, 2013
Copyright © 2014 Sunanda Dissanayake, Uttara Roy. This is an open access article distributed under the Creative Commons Attribu-tion License, which permits unrestricted use, distribuAttribu-tion, and reproducAttribu-tion in any medium, provided the original work is properly cited. In accordance of the Creative Commons Attribution License all Copyrights © 2014 are reserved for SCIRP and the owner of the intellectual property Sunanda Dissanayake, Uttara Roy. All Copyright © 2014 are guarded by law and by SCIRP as a guardian.
ABSTRACT
Run-off-road crashes in the United States have become a major cause of serious injuries and fatalities. A signifi-cant portion of run-off-road crashes are single vehicle crashes that occur due to collisions with fixed objects and overturning. These crashes typically tend to be more severe than other types of crashes. Single vehicle run-off- road crashes that occurred between 2004 and 2008 were extracted from Kansas Accident Reporting System (KARS) database to identify the important factors that affected their severity. Different driver, vehicle, road, crash, and environment related factors that influence crash severity are identified by using binary logit models. Three models were developed to take different levels of crash severity as the response variables. The first model taking fatal or incapacitating crashes as the response variable seems to better fit the data than the other two de-veloped models. The variables that were found to increase the probability of run-off-road crash severity are driver related factors such as driver ejection, being an older driver, alcohol involvement, license state, driver being at fault, medical condition of the driver; road related factors such as speed, asphalt road surface, dry road condition; time related factors such as crashes occurring between 6 pm and midnight; environment related fac-tors such as daylight; vehicle related facfac-tors such as being an SUV, motorcycles, vehicle getting destroyed or disabled, vehicle maneuver being straight or passing; and fixed object types such as trees and ditches.
KEYWORDS
Run-off-Road Crashes; Crash Severity; Single-Vehicle Crashes
1. Introduction
Run-off-road (ROR) crashes in the United States have become a major cause of serious injuries and fatalities. Statistics based on Fatality Analysis Reporting System (FARS) data from 2008 illustrated that fatalities due to ROR crashes in the United States were about one-third of total traffic fatalities [1]. Statistics about fatalities in Kansas due to ROR crashes are even worse than the na-tional statistics. For the same year (2008), percentage of ROR fatal crashes was about 66% of total fatal crashes in Kansas [2]. Another statistic from Kansas Strategic Highway Safety Plan (KSHSP) demonstrated that ROR crashes accounted for 55% of all crashes involving fatal and serious injuries [3]. These statistics illustrate the fact that when it comes to crash severity, ROR crashes tend to be more severe. The percentage of different injury crash-
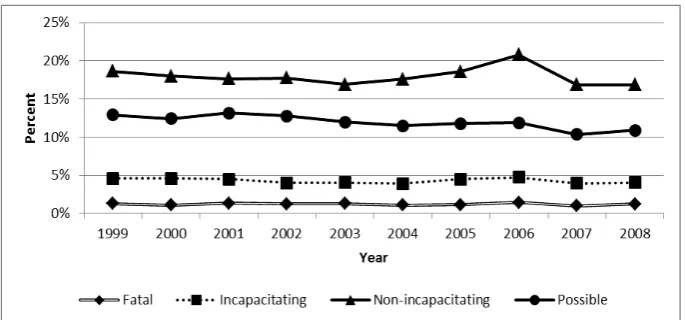
es to that of total single vehicle ROR crashes in Kansas is presented in Figure 1. The figure shows that the percen-tage of fatal and incapacitating crashes remains relatively constant over the years, while the percentage of non- incapacitating crashes fluctuates with the highest percen-tage observed in 2006. The percenpercen-tage of possible injury crashes also shows fluctuations over the years, having the highest percentage in 2001 and the lowest in 2007.
Figure 1. Percentage of injury crashes in total ROR crash occurrences from 1999 to 2008.
factors that may be directly or indirectly related to ROR crashes to occur. But it has been found that ROR crashes occurring due to collision with fixed objects occupy a major portion of the total number of ROR crashes. Fixed objects’ crashes are also responsible for more severe ROR crashes. According to National Traffic Safety Adminis-tration (NHTSA, 2003), collision with fixed objects and non-collision account for 19% of all reported crashes but result in 44% of all fatal crashes [4]. Fixed objects’ crashes and crashes due to overturning are categorized as single vehicle ROR crashes. From the database used in this study, Kansas Accident Reporting System (KARS), it has been found that single vehicle ROR crashes were about 87.7% of total ROR crashes in the year 2008 [2]. Therefore, it is necessary to treat single vehicle ROR crashes separately because of their unique nature.
The economic costs associated with this type of crash-es are significantly high. The importance of the roadside safety problem has been recognized by different organi-zations, and efforts have been made to reduce the types of errors most likely to cause roadside crashes. The societal costs associated with roadside crashes must be recog-nized before cost-effective strategies can be developed to improve roadside safety. Therefore, it is necessary to identify the factors that are associated with single vehicle ROR crashes so that effective remedies can be developed to reduce the severity of ROR crashes. With this aim, the study focuses on single vehicle ROR crashes in Kansas that occurred between 2004 and 2008. Various driver, road, environment, crash, and vehicle related factors that influence crash severity are identified by using logistic regression analysis after initial frequency analysis of dif-ferent crash characteristics has been performed.
2. Objectives
The primary objective of this study was to identify the important driver, vehicle, road, environment, and crash related factors that influence the severity of single
ve-hicle ROR crashes. First, important crash characteristics related to single vehicle ROR crashes have been identi-fied and then how these factors affect the severity of ROR crashes were analyzed by developing binary logit models. Logistic regression analysis is used to investi-gate the association between a number of explanatory variables and a single response variable-crash severity. The factors identified in this study are expected to help developing potential countermeasures which will ulti-mately reduce the severity as well as the number of sin-gle vehicle ROR crashes.
3. Literature Review
Logistic regression or other relevant statistical methods are common in severity modeling. Several studies have adopted this kind of models to examine the association between crash characteristics and crash severity. Liu et al. in a study examining different factors affecting crash severity on gravel roads used binary logit model [5]. The study used 10-year crash database from the state of Kan-sas to identify the important factors that have an effect towards the severity of gravel road crashes. Young et al. developed binary logit model to estimate the relationship between wind speed and overturning truck crashes [6]. In a study to determine the effectiveness of seat belts in reducing injuries, Ratnayake used binary logit model [7].
The whole dataset was split into 5 different data sets based on crash severity, which was based KABCO (K- fatal, A-incapacitating, B-non-incapacitating, C-possible, and O-no-injury) injury severity scale. Another study done by Zhu et al., binary logit model was developed in predicting fatal crashes for two lane rural highways in the Southeastern United States [8].
influence of alcohol or drugs, ejection in the crash, gend-er, impact point of the vehicle, restraint device usage, urban/rural nature and grade/curve existence at the crash location, lighting condition, and speed were the most important factors affecting the severity of young driver single vehicle ROR crashes.
Another study conducted in 1999 by Lee and Manner-ing used nested logit model to analyze ROR crash sever-ity and different observable characteristics [10]. The study used WSDOT crash database to extract crash cha-racteristics such as time of accident, accident location, effects of pavement condition, weather, driver-related, and vehicle-related information to study crash severity. The researchers also used geometric factors such as the width of lane, shoulder and median, presence of intersec-tions, and vertical or horizontal alignment and traffic data such as traffic volume, peak hour volume, legal speed limit, and truck volume as a percentage of AADT to study ROR crash severity. Roadside feature data such as guardrails, catch basins, slopes, tree groups, isolated trees, culverts, sign poles, ditches, fences, utility poles, miscel-laneous fixed objects, luminaires, intersections, and bridges were used. The researchers then integrated the three databases into one on the basis of milepost and three nested logit models were developed using standard maximum likelihood methods for all sections, urban sec-tions, and rural sections. The sequential estimation level was used to estimate the model. The lower conditional level, which is either property damage or possible injury, was estimated as a multinomial logit model (MNL) and to calculate the inclusive value, the estimated coefficients of each crash severity were used. Lastly, the multinomial logit model was used for the upper level i.e. for the over-all ROR crash severity level (fatality/disabling injury, evident injury and no evident injury). The study found that night time, winter month, dry road surface, alcohol, older drivers, horizontal curves, presence of bridges, catch basin, cut side slope, guardrail increase the proba-bility of possible injury relative to PDO and inattention of drivers, broad lane, intersection, increase the probabil-ity of PDO relative to possible injury in the lower nest level. Day time, peak hour, weekend, cloudy weather, dry road surface, exceeding speed limit, intersection, tree, utility pole decrease the probability of crash severity and weekday, good weather condition, wet road surface, high posted speed, median, narrow shoulder, bridge increase the probability of ROR crash severity in the upper nest level.
Spainhour et al. in a study on fatal ROR crashes in-volving overcorrection used binary logistic regression model to examine the association between human, road-way, vehicle, and environmental factors and overcorrec-tion as opposed to tradiovercorrec-tional ROR crashes [11]. The study used the STATA statistical software program to
perform logistic regression. There were 23 explanatory variables used in the study where the data were taken for the year 2000 for fatal ROR crashes in the state of Flori-da. It was identified that presence of rumble strips, in-clement weather, rural locations, incapacitated drivers, running off the road to the left or straight are positively associated with overcorrection. On the other hand, male drivers, speeding, paved or curbed shoulders, wet or slippery roads, and larger vehicles are negatively asso-ciated with ROR crashes. Liu and Subramanian used FARS data from 1999 to 2007 for fatal single vehicle ROR crashes and performed logistic regression using SAS [12]. The results showed that the most influential factors in the occurrence of fatal single vehicle ROR crashes are driver performance-related factors such as being sleepy, followed by alcohol involvement, roadway alignment with curve, speeding, passenger car, rural roadway, number of lanes, high-speed-limit-road, ad-verse weather conditions and avoiding, swerving, or sliding crashes due to severe crosswind, tire blow-out or flat, live animals in road. Another study done by Noyce
et al. determined the frequency and safety impacts of crashes involving guardrail end hits [13]. The crash da-tabase for the state of Wisconsin was queried for the combined attributes of guardrail end and guardrail face crashes for 5-year period from 2001 to 2005. A multi-nomial regression model was carried out to identify the important predictors, which are different types of gua-rdrail ends. The results indicated that turn down guagua-rdrail ends were associated with a higher proportion of fatali-ties and incapacitating injuries.
4. Methodology
4.1. Crash Data
KARS database includes important crash characteris-tics related to environment, time, roadway, vehicle, oc-cupants, etc.; it also has different driver, vehicle, road-way, and environment related contributory causes. Im-portant crash characteristics are extracted and crash se-verity distribution (fatal, incapacitating, non-incapaci- tating, possible, no injury) has been determined for each single vehicle ROR crash. Crash severity was identified as the highest injury severity sustained by an individual involved in the crash. As an example, if there is at least one person fatally injured in a crash, then the crash is identified as a fatal crash and similarly, if there is at least one incapacitating injury but no fatality resulting from a crash then it is identified as an incapacitating crash. For the purpose of analysis, single vehicle ROR crashes for five years from 2004 to 2008 were combined together and one of the five severity levels was assigned to each crash.
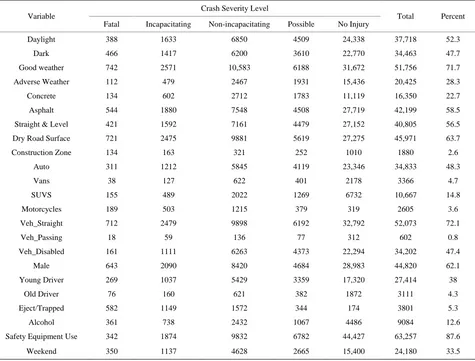
Table 1 presents some of the important single vehicle ROR crash characteristics along with their crash severity distribution. Different environment, roadway, vehicle, occupant, and time related factors are categorized and the
percentage of ROR crashes corresponding to each cate-gory to the total number of ROR crashes is presented in the last column. The total number of single vehicle ROR crashes in the final dataset has is 72,181.
Among different environment related factors consi-dered in this study, it has been found that the highest percentage of ROR crashes occurs during good weather condition. Daylight and dark condition comprise of al-most equal percentages of total ROR crashes. Asphalt road surface consists of more than half of the crashes that occur in different road surface types. Among different road surface character, maximum number of crashes oc-curs in straight and level road surface and in dry road surface condition. Auto takes into account of about 48% of crashes. Among different vehicle maneuvers consi-dered, two-third of the crashes occurs when vehicles fol-low straight road.
When functionality of crash involved vehicles is con-sidered it has been found that about half of the vehicles involved in ROR crashes are disabled. The involvement of male drivers is higher in number in comparison to female drivers. Younger drivers (age group between 16
Table 1. Characteristics of single vehicle ROR crashes for combined crash data from 2004 to 2008.
Variable Crash Severity Level Total Percent
Fatal Incapacitating Non-incapacitating Possible No Injury
Daylight 388 1633 6850 4509 24,338 37,718 52.3
Dark 466 1417 6200 3610 22,770 34,463 47.7
Good weather 742 2571 10,583 6188 31,672 51,756 71.7
Adverse Weather 112 479 2467 1931 15,436 20,425 28.3
Concrete 134 602 2712 1783 11,119 16,350 22.7
Asphalt 544 1880 7548 4508 27,719 42,199 58.5
Straight & Level 421 1592 7161 4479 27,152 40,805 56.5
Dry Road Surface 721 2475 9881 5619 27,275 45,971 63.7
Construction Zone 134 163 321 252 1010 1880 2.6
Auto 311 1212 5845 4119 23,346 34,833 48.3
Vans 38 127 622 401 2178 3366 4.7
SUVS 155 489 2022 1269 6732 10,667 14.8
Motorcycles 189 503 1215 379 319 2605 3.6
Veh_Straight 712 2479 9898 6192 32,792 52,073 72.1
Veh_Passing 18 59 136 77 312 602 0.8
Veh_Disabled 161 1111 6263 4373 22,294 34,202 47.4
Male 643 2090 8420 4684 28,983 44,820 62.1
Young Driver 269 1037 5429 3359 17,320 27,414 38
Old Driver 76 160 621 382 1872 3111 4.3
Eject/Trapped 582 1149 1572 344 174 3801 5.3
Alcohol 361 738 2432 1067 4486 9084 12.6
Safety Equipment Use 342 1874 9832 6782 44,427 63,257 87.6
and 24 years) consist of more than one-third of total crashes. Alcohol involvement is found in 13% of ROR crashes. Usage of safety equipment for drivers is found to be significant, i.e., 87%. Among different time related factors, it has been identified that one-third of crashes occur during weekend. About 25% crashes occur be-tween 6 pm and midnight.
4.2. Variable Selection
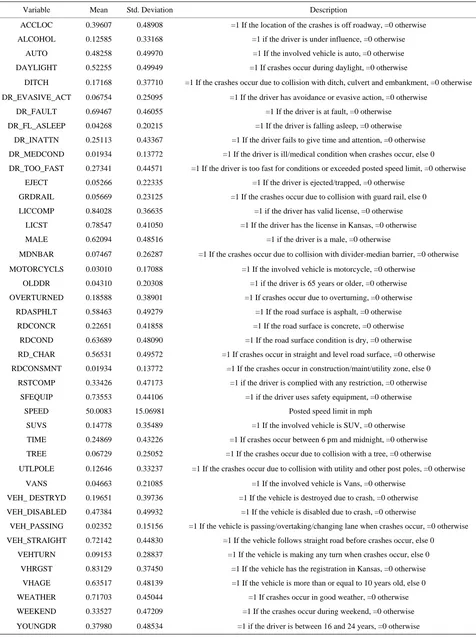
Initially, it was tried to include as many variables (driver, vehicle, environment, roadway, time-related) as possible for the modeling considering the fact that the quality of the modeling could be expected to increase to a certain level once the number of variables increases. Selection of the variables was carried out based on previous studies and on the assumption that a particular variable would affect the severity of ROR crashes. The descriptions of 43 explanatory variables that are considered for the mod-eling are provided along with their statistics in Table2. All the explanatory variables are binary except SPEED, which is considered as a continuous variable. Binary va-riables take the form of either 0 or 1; for example, if a crash occurs during weekend, the variable WEEKEND has been assigned “1” as its value, otherwise “0” is as-signed to this variable. Three binary logistic regression models were developed by considering crash severity as the response variable and the description of the models are as follows:
1) FATAL_INCAP (Binary response = 1 if the obser-vation is a fatal or incapacitating crash, =0 otherwise i.e.
non-incapacitating, possible or no injury)
2) FATAL_INCAP_NON-INCAP (Binary response = 1 if the observation is a fatal or incapacitating or non- incapacitating crash, =0 otherwise i.e. possible or no in-jury)
3) INJURY (Binary response = 1 if the observation is a fatal or incapacitating or non-incapacitating or possible crash, =0 otherwise i.e. no injury)
4.3. Logistic Regression
As the aim of the study was to develop models to predict the severity of ROR crashes, logistic regression was identified as the most suitable approach to identify the important factors. As the response variable, crash severi-ty, is dichotomous, ordinary linear regression will not fit properly as the dichotomous dependent variable violates assumptions of homoscedasticity and normality of the error term [14]. This results in the coefficient estimates that are no longer efficient and the standard error esti-mates that are no longer estiesti-mates of true standard error. Therefore, binary logit model has been identified as the most suitable approach in this study. In case of binary logistic regression model, the response variable, y takes
the form of either of the two binary values (0 or 1). For k explanatory variables and i=1, 2, 3,,n indi-viduals, the model takes the form as follows [14].
1 1 2 2
log 1
i
i i k ik
i
P
x x x
P α β β β
= + + + +
−
where,
(
1)
Prob.
i i i
P = y = y X is the response probability to be modeled, and y1 is the first ordered level of y,
α = Intercept parameter,
β = Vector of slope parameters,
Xi= Vector of explanatory variables.
The statistical analysis software SAS was used to es-timate the maximum likelihood with the help of Proc logistic.
The odds ratio for dichotomous explanatory variable, x, which takes value 1 or 0 (with 1 meaning that the event will certainly occur and 0 meaning that the event will definitely not occur) can be represented as the ratio of the expected number of times that an event will occur (x = 1) to the expected number of times it will not occur (x = 0). This can be illustrated by the formula below [15]:
( )
( )
( )
( )
π 1 1 π 1 OR
π 0 1 π 0
− = − where,
OR = Odds Ratio
( )
( )
π 1 1 π 1 − = Probability that the event will occur when x = 1
( )
( )
π 0 1 π 0 − = Probability that the event will not occur when x = 0
4.4. Modeling Association
Before fitting the model, it was necessary to check if there exists any association between the explanatory riables. Any linear dependency between explanatory va-riables is called multi-collinearity. If there is any multi- collinearity between the explanatory variables, the inde-pendent effects of those variables on the outcome might not be achieved. Although multi-collinearity doesn’t bias the coefficients, it makes the coefficients more unstable [14]. To estimate the correlation coefficients between the explanatory variables, Pearson product moment correla-tion coefficient was used [15]:
(
)(
)
(
)
(
)
2(
)
2n
i i
i
xy n n
i i
i i
x x y y
r
x x y y
− −
=
− −
∑
∑
∑
Table 2. Description of explanatory variables considered for severity modeling.
Variable Mean Std. Deviation Description
ACCLOC 0.39607 0.48908 =1 If the location of the crashes is off roadway, =0 otherwise
ALCOHOL 0.12585 0.33168 =1 if the driver is under influence, =0 otherwise
AUTO 0.48258 0.49970 =1 If the involved vehicle is auto, =0 otherwise
DAYLIGHT 0.52255 0.49949 =1 If crashes occur during daylight, =0 otherwise
DITCH 0.17168 0.37710 =1 If the crashes occur due to collision with ditch, culvert and embankment, =0 otherwise
DR_EVASIVE_ACT 0.06754 0.25095 =1 If the driver has avoidance or evasive action, =0 otherwise
DR_FAULT 0.69467 0.46055 =1 If the driver is at fault, =0 otherwise
DR_FL_ASLEEP 0.04268 0.20215 =1 If the driver is falling asleep, =0 otherwise
DR_INATTN 0.25113 0.43367 =1 If the driver fails to give time and attention, =0 otherwise
DR_MEDCOND 0.01934 0.13772 =1 If the driver is ill/medical condition when crashes occur, else 0
DR_TOO_FAST 0.27341 0.44571 =1 If the driver is too fast for conditions or exceeded posted speed limit, =0 otherwise
EJECT 0.05266 0.22335 =1 If the driver is ejected/trapped, =0 otherwise
GRDRAIL 0.05669 0.23125 =1 If the crashes occur due to collision with guard rail, else 0
LICCOMP 0.84028 0.36635 =1 if the driver has valid license, =0 otherwise
LICST 0.78547 0.41050 =1 If the driver has the license in Kansas, =0 otherwise
MALE 0.62094 0.48516 =1 if the driver is a male, =0 otherwise
MDNBAR 0.07467 0.26287 =1 If the crashes occur due to collision with divider-median barrier, =0 otherwise
MOTORCYCLS 0.03010 0.17088 =1 If the involved vehicle is motorcycle, =0 otherwise
OLDDR 0.04310 0.20308 =1 if the driver is 65 years or older, =0 otherwise
OVERTURNED 0.18588 0.38901 =1 If crashes occur due to overturning, =0 otherwise
RDASPHLT 0.58463 0.49279 =1 If the road surface is asphalt, =0 otherwise
RDCONCR 0.22651 0.41858 =1 If the road surface is concrete, =0 otherwise
RDCOND 0.63689 0.48090 =1 If the road surface condition is dry, =0 otherwise
RD_CHAR 0.56531 0.49572 =1 If crashes occur in straight and level road surface, =0 otherwise
RDCONSMNT 0.01934 0.13772 =1 If the crashes occur in construction/maint/utility zone, else 0
RSTCOMP 0.33426 0.47173 =1 if the driver is complied with any restriction, =0 otherwise
SFEQUIP 0.73553 0.44106 =1 if the driver uses safety equipment, =0 otherwise
SPEED 50.0083 15.06981 Posted speed limit in mph
SUVS 0.14778 0.35489 =1 If the involved vehicle is SUV, =0 otherwise
TIME 0.24869 0.43226 =1 If crashes occur between 6 pm and midnight, =0 otherwise
TREE 0.06729 0.25052 =1 If the crashes occur due to collision with a tree, =0 otherwise
UTLPOLE 0.12646 0.33237 =1 If the crashes occur due to collision with utility and other post poles, =0 otherwise
VANS 0.04663 0.21085 =1 If the involved vehicle is Vans, =0 otherwise
VEH_ DESTRYD 0.19651 0.39736 =1 If the vehicle is destroyed due to crash, =0 otherwise
VEH_DISABLED 0.47384 0.49932 =1 If the vehicle is disabled due to crash, =0 otherwise
VEH_PASSING 0.02352 0.15156 =1 If the vehicle is passing/overtaking/changing lane when crashes occur, =0 otherwise
VEH_STRAIGHT 0.72142 0.44830 =1 If the vehicle follows straight road before crashes occur, else 0
VEHTURN 0.09153 0.28837 =1 If the vehicle is making any turn when crashes occur, else 0
VHRGST 0.83129 0.37450 =1 If the vehicle has the registration in Kansas, =0 otherwise
VHAGE 0.63517 0.48139 =1 If the vehicle is more than or equal to 10 years old, else 0
WEATHER 0.71703 0.45044 =1 If crashes occur in good weather, =0 otherwise
WEEKEND 0.33527 0.47209 =1 If the crashes occur during weekend, =0 otherwise
identified as having multi-collinearity effects between them although there is no hard and fast rule [14]. The correlation matrix produced by proc corr in SAS has been used to examine the correlation. If any variable had been found with correlation coefficient greater than 0.5, they were further examined with linear regression model. Proc Reg in SAS software generates statistics, which are called TOL (Tolerance) and VIF (Variance Inflation Factor) that are applied to check the correlation. The To-lerance of a particular variable is computed by develop-ing regression model with the selected variable as the dependent variable and other variables as explanatory variables and calculating the co-efficient of determina-tion R2, and subtracting R2 from 1. If the estimated coef-ficient of determination is Ri2 for an explanatory varia-ble xi, then Tolerance and VIF will be calculated in the following manner [15].
2
Tolerance= −1 Ri and VIF 1 Tolerance= Low tolerances indicate high multi-collinearity. In this study, variables with tolerances below 0.4 were removed from the model.
5. Analysis Results
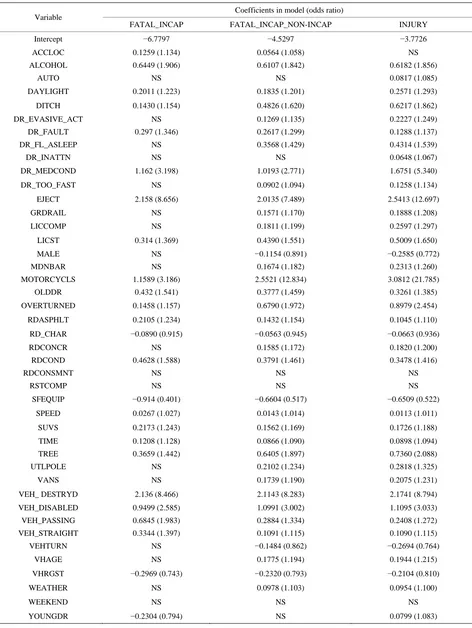
The results of the three crash severity models that are developed are presented in Table 3. Explanatory va-riables that were significant at the 95 confidence level were included in the model, and their corresponding odds ratios had been presented in the parentheses. The model was developed by entering all the variables initially and then by removing one at a time once the variable was found not to be significant.
The model uses 72,181 crash records in total, among them, 3791 crash records are fatal and incapacitating; fatal, incapacitating and non-incapacitating crash severity consist of 16,418 crash records, and all injury level crashes (fatal, incapacitating, non-incapacitating and possible injury) are comprised of 24,232 observations in total.
The first model, where the response variable is FAT-AL_INCAP (crash severity is either fatal or incapacitat-ing), has 25 explanatory variables as significant. The coefficient of an explanatory variable is directly related to the probability of having a more severe crash. The variables with positive coefficients denote the increasing probability of a certain crash severity and vice versa. 21 independent variables are found to have positive coeffi-cients, which mean that the probability of a fatal or inca-pacitating crash is likely to increase when one or more of these 21 factors are involved. 6 of the 21 explanatory variables are driver related (driver ejection, older driver, alcohol involvement, license state, drivers at fault, and
drivers’ medical condition), 3 are road related (speed, asphalt road surface, and dry road condition), 1 is envi-ronment related (daylight), 3 are crash related (accident location, overturning crashes, and time: between 6 PM and midnight), 6 are vehicle related (SUVs, Motorcycles, vehicle destroyed, vehicle disabled, vehicle straight, ve-hicle passing), and 2 are fixed objects’ type (tree, ditch). Usage of safety equipment, road character (straight and level road), young drivers (drivers aged between 16 and 24 years), vehicle registration state (if the involved ve-hicle is registered in Kansas) have negative coefficients, and this suggests that these 4 variables decrease the pro- bability of fatal or incapacitating crashes. The odds ratios presented in the parentheses measure the amount by which the crash severity increases. Taking an example of the explanatory variable EJECT, which has an odds ratio of 8.656 for the first model, it can be stated that the probability of fatal or incapacitating crash tends to be 8.656 times higher when drivers are ejected or trapped than when drivers are not ejected or trapped, assuming that rest of the factors remains the same.
The second model, where the response variable is FATAL_INCAP_NON-INCAP (crash severity is either fatal, or incapacitating or non-incapacitating), has 37 ex- planatory variables that are significant. Among them, 32 variables have positive coefficients. All 21 variables in the first model including license compliance, drivers too fast for conditions, drivers fall asleep, evasive action of drivers, concrete road surface, weather, Vans, vehicle age, fixed objects type of utility pole, median barrier, and guard rail have positive coefficients. This indicates that they increase the probability of the fatal, incapacitating or non-incapacitating crashes. Male, usage of safety equipment, road character (straight and level road), ve-hicle turn, veve-hicle registration state have negative coeffi-cients, thus these 5 variables decrease the probability of fatal, incapacitating or non-incapacitating crashes.
Table 3. Estimation of the crash severity model for single vehicle ROR crashes.
Variable Coefficients in model (odds ratio)
FATAL_INCAP FATAL_INCAP_NON-INCAP INJURY
Intercept −6.7797 −4.5297 −3.7726
ACCLOC 0.1259 (1.134) 0.0564 (1.058) NS
ALCOHOL 0.6449 (1.906) 0.6107 (1.842) 0.6182 (1.856)
AUTO NS NS 0.0817 (1.085)
DAYLIGHT 0.2011 (1.223) 0.1835 (1.201) 0.2571 (1.293)
DITCH 0.1430 (1.154) 0.4826 (1.620) 0.6217 (1.862)
DR_EVASIVE_ACT NS 0.1269 (1.135) 0.2227 (1.249)
DR_FAULT 0.297 (1.346) 0.2617 (1.299) 0.1288 (1.137)
DR_FL_ASLEEP NS 0.3568 (1.429) 0.4314 (1.539)
DR_INATTN NS NS 0.0648 (1.067)
DR_MEDCOND 1.162 (3.198) 1.0193 (2.771) 1.6751 (5.340)
DR_TOO_FAST NS 0.0902 (1.094) 0.1258 (1.134)
EJECT 2.158 (8.656) 2.0135 (7.489) 2.5413 (12.697)
GRDRAIL NS 0.1571 (1.170) 0.1888 (1.208)
LICCOMP NS 0.1811 (1.199) 0.2597 (1.297)
LICST 0.314 (1.369) 0.4390 (1.551) 0.5009 (1.650)
MALE NS −0.1154 (0.891) −0.2585 (0.772)
MDNBAR NS 0.1674 (1.182) 0.2313 (1.260)
MOTORCYCLS 1.1589 (3.186) 2.5521 (12.834) 3.0812 (21.785)
OLDDR 0.432 (1.541) 0.3777 (1.459) 0.3261 (1.385)
OVERTURNED 0.1458 (1.157) 0.6790 (1.972) 0.8979 (2.454)
RDASPHLT 0.2105 (1.234) 0.1432 (1.154) 0.1045 (1.110)
RD_CHAR −0.0890 (0.915) −0.0563 (0.945) −0.0663 (0.936)
RDCONCR NS 0.1585 (1.172) 0.1820 (1.200)
RDCOND 0.4628 (1.588) 0.3791 (1.461) 0.3478 (1.416)
RDCONSMNT NS NS NS
RSTCOMP NS NS NS
SFEQUIP −0.914 (0.401) −0.6604 (0.517) −0.6509 (0.522)
SPEED 0.0267 (1.027) 0.0143 (1.014) 0.0113 (1.011)
SUVS 0.2173 (1.243) 0.1562 (1.169) 0.1726 (1.188)
TIME 0.1208 (1.128) 0.0866 (1.090) 0.0898 (1.094)
TREE 0.3659 (1.442) 0.6405 (1.897) 0.7360 (2.088)
UTLPOLE NS 0.2102 (1.234) 0.2818 (1.325)
VANS NS 0.1739 (1.190) 0.2075 (1.231)
VEH_ DESTRYD 2.136 (8.466) 2.1143 (8.283) 2.1741 (8.794)
VEH_DISABLED 0.9499 (2.585) 1.0991 (3.002) 1.1095 (3.033)
VEH_PASSING 0.6845 (1.983) 0.2884 (1.334) 0.2408 (1.272)
VEH_STRAIGHT 0.3344 (1.397) 0.1091 (1.115) 0.1090 (1.115)
VEHTURN NS −0.1484 (0.862) −0.2694 (0.764)
VHAGE NS 0.1775 (1.194) 0.1944 (1.215)
VHRGST −0.2969 (0.743) −0.2320 (0.793) −0.2104 (0.810)
WEATHER NS 0.0978 (1.103) 0.0954 (1.100)
WEEKEND NS NS NS
YOUNGDR −0.2304 (0.794) NS 0.0799 (1.083)
means that they decrease the crash severity of any type. 20 explanatory variables are found to have positive coef-ficients for all the three models. These are driver ejection, older driver, alcohol involvement, license state, drivers at fault, medical condition for drivers as driver related fac-tors, speed, asphalt road surface, condition of the road as road related factors, crashes due to overturn, time (crashes occurring between 6 pm and midnight) as crash related factors, daylight as environment related factors, SUVs, motorcycles, vehicle destroyed, vehicle disabled, vehicle straight, vehicle passing as vehicle related factors, tree and ditch as fixed objects types. Ejection of drivers, medical condition for drivers, vehicle body type of mo-torcycles, vehicle destroyed, and vehicle disabled have very significant odds ratios for all the three models and represent their tremendous positive effects on crash se-verity.
Different statistical parameters for the model show that the first model is more suitable than the other two models. The first model has the smallest number of significant predictors compared to the other two models. As a result, the prediction equation for the first model is much simp-ler with fewer variables while higher percentage of ex-planatory variables to be well predicted than the other two models. Akaike’s information criterion (AIC), Sch- wartz criterion (SC) and 2 Log likelihood criterions (2LLC) are the lowest for the first model. The lower the three statistics are, the more desirably the model fits the data [14]. Two numbers (measure with intercept on-ly/measure with intercept and covariates) are shown for all the three statistical parameters. The difference be-tween these two numbers indicates good fits of the esti-mated models. The differences for all the models are fairly large indicating that the data fit the models suita-bly. % concordant and % discordant measure the predic-tive power of the model. With the highest value for the % concordant as the first model designates, the first model has the better predictive power than the other two models. The second and the third models having % concordant as 82.1% and 81.6% signify the stronger association be-tween the predicted and observed value. Sommer’s D and Gamma range from 0 to 1 and the higher the values are, the better the model is. These values are higher for the first model than the other two models, which indicate that the first model has the better predictive power in comparison to the other two models. Another measure of the predictive power for the model is the coefficient of determination, or R2. The R2 is the highest (0.2772) for the last model and is the lowest for the first model (0.1227). But the adjusted R2 (Max-rescaled R2) is pretty similar for all three models with 0.35 for the first and the second model and 0.38 for the last model and this desig-nates that all the models fit the data appropriately.
6. Conclusion
The study developed binary logit model in order to de-termine the important factors associated with the severity of single vehicle ROR crashes. Three models had been established by using 72,181 crash records, and 43 expla-natory variables were used in this study to identify how they influenced ROR crash severity. 20 variables ap- peared to be positively associated with ROR crash sever-ity for all the three models; this means that all of them increase the severity of ROR crashes. These variables are driver related factors such as driver ejection, older driver, alcohol involvement, license state, drivers at fault, medi-cal condition of the drivers; road related variables such as speed, asphalt road surface, dry road condition; crashes occurring between 6 pm and midnight, daylight as envi-ronment related factors; vehicle related factors such as SUVs, motorcycles, vehicle destroyed, vehicle disabled, vehicle straight, and vehicle passing; and tree and ditch as fixed objects types. Usage of safety equipment, straight and level road, and vehicle registration are found to have a decreasing tendency towards the crash severity for all three models. There are three variables such as restriction compliance, road construction maintenance, and weekends that appeared not to be significant for any of the three models. Variables that are found to have pos-itive as well as negative association with crash severity in this study are identical with previous studies on ROR crashes. Five variables: ejection of drivers, medical con-dition for drivers, motorcycles as vehicle body type, ve-hicle destroyed, and veve-hicle disabled have incredible effects on crash severity as their odds ratios are found to be distinguishably higher for all the three models. Among the three models, the first one has been found to be better than the other two when different statistical parameters are compared. The use of logistic regression model in predicting the factors and affecting crash sever-ity is a useful tool and could be considered to provide more accurate estimations than other methods. The va-riables that are identified in this study as influential to-wards crash severity can help in developing appropriate countermeasures to reduce the severity of single vehicle ROR crashes.
7. Limitations and Recommendations
limita-tions should be applied; otherwise, it might lead to com-plexities in using the results of the logit model [8]. Al-though the models developed in this study used a sub-stantial number of factors in determining the association between the explanatory variables and crash severity, there might be other factors and contributory causes that could influence crash severity, but could not be included in the model due to unavailability of those factors in the standard crash database. The study developed the models for single vehicle ROR crashes; therefore, the factors identified in this study might not be appropriate for all types of ROR crashes that included single and multi-ve- hicle crashes.
REFERENCES
[1] Fatality Accident Report System, “National Highway Traffic Safety Administration, US Department of Trans- portation, 2011.
http://wwwfars.nhtsa.dot.gov/Main/index.aspx
[2] Kansas Accident Reporting System (KARS) Database. Kansas Department of Transportation, 2010.
[3] U.S. Department of Transportation (USDOT), “Federal Highway Administration. Strategic Highway Safety Plan: A Champion’s Guide to Saving Lives,” Washington DC, 2010. http://safety.fhwa.dot.gov/hsip/
[4] National Highway Traffic Safety Administration (NHTSA), “Traffic Safety Facts 2003: A Compilation of Motor Ve- hicle Crash Data from the Fatality Analysis Reporting System and the General Estimates System,” National Highway Traffic Safety Administration, US Department of Transportation, Washington DC.
[5] L. Liu and S. Dissanayake, “Examination of Factors Af-fecting Crash Severity on Gravel Roads,” Pre-Print CD-ROM of the 88th Annual Meeting of TRB, National Research Council, Washington DC, 2009.
[6] R. K. Young and J. Liesman, “Estimating of the Relation- ship between Measured Wind Speed and Overturning Truck Crashes Using a Binary Logit Model,” Accident Analysis and Prevention, Vol. 39, No. 3, 2007, pp. 574- 580.
[7] I. Ratnayake, “Effectiveness of Seat Belts in Reducing Injuries: A Different Approach Based on KABCO Injury Severity Scale,” Midwest Transportation Consortium, Iowa, 2006.
[8] H. Zhu, K. K. Dixon, S. Washington and D. M. Jared, “Single-Vehicle Fatal Crash Prediction for Two-Lane Rural Highways in the Southeastern United States,” Pre- print CD-ROM of the 89th Annual Meeting of TRB, Na- tional Research Council, Washington DC, 2010.
[9] S. Dissanayake, “Young Drivers and Runoff Road Crashes,” Proceedings of the 2003 Mid-Continent Trans-
portation Research Symposium, Iowa, 18-19 August
2003.
[10] J. Lee and F. Mannering, “Analysis of Roadside Accident Frequency and Severity and Roadside Safety Manage- ment,” Prepared by Washington State Transportation Center for Washington State Transportation Commission, Department of Transportation, 1999.
[11] L. K. Spainhour and A. Mishra, “Analysis of Fatal Run- off-the-Road Crashes Involving Overcorrection,” Journal of Transportation Research Record, Vol. 2069, National Research Council, Washington DC, 2008.
[12] C. Liu and R. Subramanian, “Factors Related to Fatal Single-Vehicle ROR Crashes,” NHTSA Technical Report, DOT HS 811 232, National Highway Traffic Safety Ad- ministration, Washington DC, 2009.
[13] D. Noyce, J. Wahid, A. R. Bill and K. Santiago, “The Operational and Safety Impacts of ROR Crashes in Wis- consin: Object Hits and Ramp Terminals,” Prepared by Traffic Operations and Safety Laboratory, Department of Civil Engineering, University of Wisconsin-Madison, Prepared for Wisconsin Department of Transportation, 2008.
[14] P. D. Allison, “Logistic Regression Using the SAS Sys- tem: Theory and Application,” SAS Institute Inc., SAS Campus Drive, Cary, 1999.