http://dx.doi.org/10.4236/health.2014.63032
A disregard for calories during sampling: Exploring
the “samples don’t count” effect
Chrissy M. Martins1*, Lauren G. Block2, Darren W. Dahl3
1
Department of Marketing and International Business, Iona College, Hagan School of Business, New Rochelle, USA;
*
Corresponding Author: [email protected]
2
Department of Marketing, Baruch College, Zicklin School of Business, New York, USA
3
Department of Marketing, Sauder School of Business, University of British Columbia, Vancouver, Canada
Received 7 November 2013; revised 14 December 2013; accepted 23 December 2013
Copyright © 2014 Chrissy M. Martins et al. This is an open access article distributed under the Creative Commons Attribution Li-cense, which permits unrestricted use, distribution, and reproduction in any medium, provided the original work is properly cited. In accordance of the Creative Commons Attribution License all Copyrights © 2014 are reserved for SCIRP and the owner of the intel-lectual property Chrissy M. Martins et al. All Copyright © 2014 are guarded by law and by SCIRP as a guardian.
ABSTRACT
Product sampling is an important part of food retailing promotion. We explore how food sam- pling affects individuals’ total caloric estimates of a consumption episode. In a field study, at a small self-serve frozen yogurt store, 144 partici- pants were randomly assigned to either a con- trol or samples’ condition. Analysis of variance showed that individuals who had no or one sam- ple overestimated the number of calories they were consuming, while those who had two or more samples underestimated their caloric in- take.
KEYWORDS
Sampling; Calorie Estimation; Food Intake
1. INTRODUCTION
American society has become “obesogenic”, which is characterized by environments promoting increased food intake, lack of exercise and unhealthy eating [1,2]. One of the most important indications of unhealthy eating is overconsumption [3]. Specifically, recent research has suggested that a key factor contributing to overconsump-tion is the erroneous judgment people make when esti-mating calories, and more specifically, their underesti-mation of the calories they consume [4]. Despite the in-creasing trend of the display of caloric information available to consumers, assessment of caloric intake con-tinues to be a problem [5].
Recent work has identified several stimulus-based ef-fects that can influence people’s tendency to erroneously
estimate calories. Findings indicate that factors such as portion size, packaging, nutrition labels [6,7] and the relative pairing of food items [8] can influence consum-ers’ perceptions of their caloric intake. For example, con- sumers believe that a healthy name renders a product healthy [9], that a small amount of a healthy nutrient ren- ders the whole item healthy (e.g., dose insensitivity) [10], and that a healthy quality of one food item can be trans-ferred to nearby items (e.g., group-contagion effect) [11]. Even with the increase in research pointing to the psy-chophysical elements like these contributing to the erro- neous estimations of calories, little is known about the antecedents involved in the process. Furthermore, given recent evidence suggesting individuals’ highly flawed methods of grossly underestimating calories [12], under-standing the process is imperative for both researchers and policymakers alike.
2. METHODS
2.1. Study Population
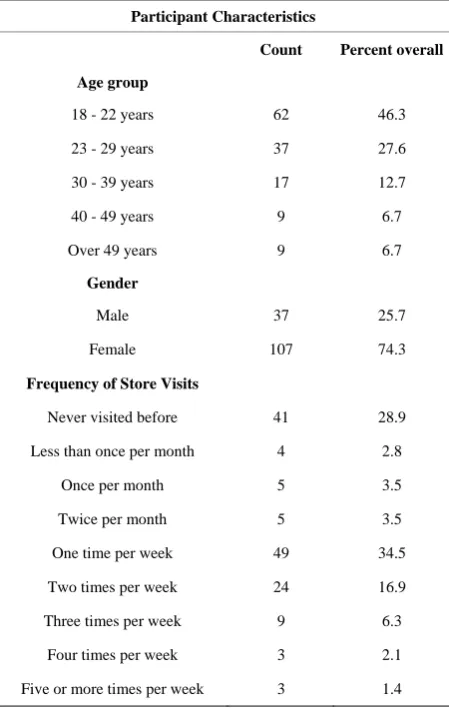
One hundred and forty-four customers were recruited for the present, institutional review board approved study. Participants ranged in age from 18 to over 49 years (mean age group category = 18 - 22 years), and 74% were female. There was a variety of occupations reported, including education, business, music/art, sales, law, ad-ministration, information technology, and no occupation (i.e., unemployed). Participants also varied in their fre-quency of store visits, ranging from the present visit having been participants’ first visit, to over twice per week. Table 1 provides further details of participants’ characteristics.
2.2. Procedure
[image:2.595.60.285.382.737.2]The study took place at a small, self-serve frozen yo-gurt store in New York City. Unlike most typical frozen yogurt venues where the customer orders by size and the server fills the order, in this venue the yogurt is self-
Table 1.Participant characteristics (age group, gender, and fre- quency of store visits).
Participant Characteristics
Count Percent overall
Age group
18 - 22 years 62 46.3
23 - 29 years 37 27.6
30 - 39 years 17 12.7
40 - 49 years 9 6.7
Over 49 years 9 6.7
Gender
Male 37 25.7
Female 107 74.3
Frequency of Store Visits
Never visited before 41 28.9
Less than once per month 4 2.8
Once per month 5 3.5
Twice per month 5 3.5
One time per week 49 34.5
Two times per week 24 16.9
Three times per week 9 6.3
Four times per week 3 2.1
Five or more times per week 3 1.4
served. Customers enter the store, pick up an empty cup, and proceed to filling that cup with yogurt from over 16 possible flavors. After filling their cups to their desired amount of yogurt, customers can then self-serve over 20 toppings of their choice. Payment is made on a standard per ounce charge, according to the total weight of their cups. Since the store normally has a no-sample policy, customers were observed and surveyed during non-peak traffic hours (i.e., between the hours of 12:00 pm and 5:00 pm) on several different days during the week.
Upon walking into the store, individuals were asked if they wished to participate in a short study assessing their frozen yogurt preferences. In exchange for their partici-pation, they were told that they would be receiving a $1 off coupon good for a future visit to the store. Those who agreed were led towards the back of the store by the yo-gurt pouring stations. Another researcher met partici-pants there, and explained to them that the study was interested in the processes involved when individuals select their frozen yogurt. As such, the researcher also explained that he would be observing participants as they went through their normal routine of selecting frozen yogurt, and asking some questions along the way. During the control day, participants simply proceeded to filling their cups with the frozen yogurt. On the samples day, the researcher told participants that to facilitate their de-cision process, they could sample as many flavors of the frozen yogurt as they wished, prior to filling their cups. They were then shown a “Sample Tray” containing empty paper 1 ounce sample cups that participants could take to sample the yogurt, as well as signage indicating that one sample is approximately 25 calories.
Researchers unobtrusively observed the number of samples that participants took (on the samples day), along with how many people were in the participant’s party, and how many other people were in the store at the time. When participants were done pouring frozen yogurt into their serving cup, the researcher approached them and asked them to estimate the total amount of frozen yogurt they will have consumed during that particular visit to the store (with samples included, if applicable). To help them get an accurate estimate of the amount of yogurt in their cups, the researchers weighed participants’ cups for them. Participants were told they could utilize the nutritional information displayed next to each flavor of frozen yogurt, as well as the signage that was included next to the sampling cups during the samples day. All the flavors were approximately 25 calories per ounce. Final-ly, participants were also asked their age and familiarity with the store.
2.3. Measures
would have consumed during that particular store visit. To obtain this estimate, the number of samples and oun- ces of yogurt in participants’ cups was used to calculate the total calories of yogurt. Since all yogurt flavors were approximately 25 calories per ounce, this was multiplied by the weight of the yogurt in the cups, as well as the number of samples participants took, and summed toge- ther. Next, participants’ estimates were subtracted from this amount in order to assess their accuracy. Positive amounts indicated an overestimation of actual calories, while negative amounts meant underestimation.
2.4. Statistical Analyses
The data were analyzed using SPSS Version 20 for Microsoft Windows. The main dependent variable was based on the calculated measure of participants’ caloric estimation accuracy. In addition, participants were clas-sified based on the number of samples they took, which served as the factor in the analysis. An ANOVA was used to determine if differences in accuracy were influ-enced by the number of samples taken. Results are re-ported as means. Additionally, a t-test was used to assess whether the accuracy of estimates were statistically sig-nificant.
3. RESULTS
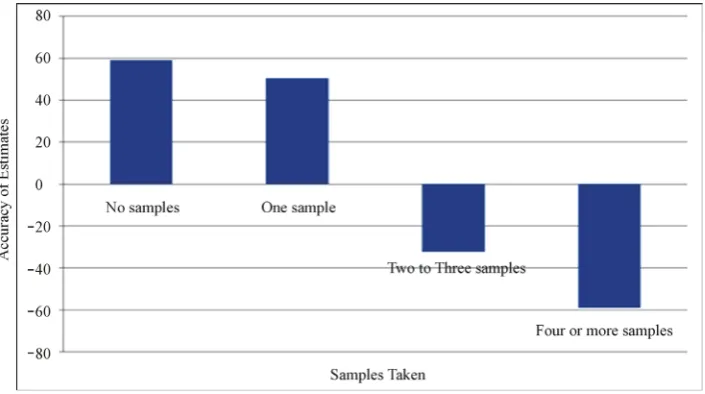
Results supported the hypothesis that individuals dis-regard the calories in samples. Positive values signify that participants overestimated the total amount of calo-ries they would consume, while negative values signify that participants underestimated the total amount of calo-ries they would consume. The more samples participants
took, the more they underestimated their total caloric intake (F (3, 138) = 10.4, P < 0.001). Those who did not take any samples on the control day (N = 49) overesti-mated the amount of calories of yogurt they were consum- ing (MNo Samples = 59.1). Interestingly, those who took
only one sample (N = 57) also overestimated the calories they were consuming (MOne Sample = 50.1), though the over-
estimation was less pronounced than the control group. However, those who took two to three samples (N = 26) and those who took four or more samples (N = 12) signi- ficantly underestimated the amount of calories they were consuming (MTwoOrThreeSamples = −32.5, MFourOrMoreSamples =
−58.9).
In addition to the main analysis, several ANCOVAs were run to determine the effect of additional factors that may have influenced participants’ caloric estimates. More specifically, age, gender, and other individuals in participants’ party and the store were used as covariates in the main model testing the effect of amount of sam-ples taken on the accuracy of caloric estimates. Results from this analysis indicate that these factors did not serve as an influence in participants’ accuracy (all covariates’ P’s > 0.06).
To further assess the extent of participants’ estimation errors due to sampling, t-test analyses were conducted to test whether these errors were statistically significant. All comparison yielded significant results. Specifically, es- timates above zero indicated overestimation (MNo Samples =
59.1, t (47) = 4.0, P < 0.05; MOne Sample = 50.1, t (56) = 3.6,
P < 0.05). Estimates below zero indicated underestima- tion (MTwoOrThreeSamples = −32.5, t (25) = −2.7, P < 0.05;
MFourOrMoreSamples = −58.9, t (39) = −2.4, P < 0.05). Figure
[image:3.595.122.475.494.691.2]1 demonstrates these results.
Figure 1. Accuracy of estimates of caloric consumption by categories of samples taken. Note: Esti- mates above zero indicate overestimation (MNo Samples= 59.05, t (47) = 4.03, P < 0.05; MOne Sample
= 50.50, t (56) = 3.64, P < 0.05). Estimates below zero indicate underestimation (MTwoOrThreeSamples
4. DISCUSSION
The present study examined the effects of food sam-ples on individuals’ estimates of their caloric intake. Spe- cifically, it was hypothesized that samples would be dis-regarded in such estimates, as individuals would perceive samples as not counting towards their consumption. Find- ings indicate that individuals generally disregard the cal- ories in samples, and that this effect is more prominent when individuals consume more samples. Interestingly, a disregard for samples was not found to be the case when participants had no samples or only a single sample. It may be that those who had several samples disregarded those calories because they considered the small sample units as trivial, thus causing them to fly under the radar [14] and not counting as much as they should towards the total calorie estimates. On the other hand, those who did not have samples did not experience this bias. While those who took a single sample also overestimated the amount of calories consumed like those who did not have a sample, they did so to a lesser extent. It may be possi-ble that a single sample was not large enough to produce the bias found in the case of multiple samples.
Despite the finding that samples’ calories don’t count, it is not clear why individuals disregard the calories in samples. In the present study, the caloric information of both the samples and yogurt based on weight was clearly provided for participants. However, it may be that the higher number of samples taken and consumed presented greater cognitive complexity for participants, and they may have simply been unable to accurately calculate the samples’ calories. Similarly, it is possible that partici-pants felt guiltier for consuming a greater number of samples. Though frozen yogurt is positioned on claims of health, it is nevertheless a hedonic product and one that participants may have felt guilty for consuming in larger quantities. As a result, their error in calculation may have been defensive in nature.
The present findings lend support to the existing re-search on factors that influence the way in which indi-viduals perceive the amount of calories in food they consume. Specifically, there is much recent work de-monstrating the important role of external cues on such perceptions. Consistent with this body of work, the cur-rent findings demonstrate how another factor found in individuals’ environments can have an influence on the accuracy of their calorie estimates [15]. Given that sam-pling continues to be a prevalent form of promotion, it is important to understand its role in individuals’ percep-tions and consumption.
Though the use of samples continues to be a proven method of increasing sales in the retailing industry, there is little known about some of the unintended, albeit po-tentially negative consequences of the practice. The cur-rent research highlights one potential result of sampling,
namely a disregard for the calories included in those samples. Although prior work has demonstrated a host of biases that affect judgments about consumption, little research has explored the influence of samples in this judgment. Given the problems that result from a disre-gard for calories, it is important to consider the role that samples can have in these issues.
While this research provides evidence to suggest that samples don’t count in individuals’ calorie estimates, it is only a first step. More research is needed to examine the process that underlies the effect, as well as some of the boundary conditions that exist. It may be interesting to examine whether this effect limited to samples of rela-tively hedonic food (i.e., dessert-type of food), or to all food. Furthermore, another question that may arise is whether individuals disregard the calories in samples because they are free. Finally, a major limitation of this research that is worth noting is the lack of specific health information, such as BMI, collected from participants, which may have influenced their calorie estimates [16]. These questions raise important issues for individuals’ health, making them particularly important for research-ers and policymakresearch-ers to address.
ACKNOWLEDGEMENTS
The authors would like to thank Solomon Choi and 16 Handles for allowing them to conduct this research.
REFERENCES
[1] CDC (2010)http://www.cdc.gov/obesity/index.html
[2] Grieve, F.G. and Vander Weq, M.W. (2003) Desire to eat high- and low-fat foods following a low-fat dietary inter- vention. Journal of Nutrition Education and Behavior, 35, 98-104.
http://dx.doi.org/10.1016/S1499-4046(06)60046-8
[3] Chernev, A. and Gal, D. (2010) Categorization effects in value judgments: Averaging bias in evaluating combina- tions of vices and virtues. Journal of Marketing Research,
47, 738-747. http://dx.doi.org/10.1509/jmkr.47.4.738
[4] Chandon, P. and Wansink, B. (2007) Is obesity caused by calorie underestimation? A psychophysical model of meal size estimation. Journal of Marketing Research, 44, 84- 99.
[5] Chernev, A. and Chandon, P. (2010) Calorie estimation biases in consumer choice. In: Batra, R., Keller P. and Strecher, V., Eds., Leveraging Consumer Psychology for Effective Health Communications: The Obesity Challenge, M.E.Sharpe, Inc., Armonk.
[6] Geier, A.B., Rozin, P. and Doros, G. (2006) Unit bias: A new heuristic that helps explain the effect of portion size on food intake. Psychological Science, 17, 523-525.
http://dx.doi.org/10.1111/j.1467-9280.2006.01738.x
trition labels lead to obesity? Journal of Marketing Re- search, 43, 605-617.
[8] Chernev, A. (2011). The dieter’s paradox. Journal of Con- sumer Psychology, 21, 178-183.
http://dx.doi.org/10.1016/j.jcps.2010.08.002
[9] Irmak, C., Vallen, B. and Robinson, S.R. (2011) The im- pact of product name on dieters’ and nondieters’ food eva- luations and consumption. Journal of Consumer Research,
38, 390-405. http://dx.doi.org/10.1086/660044
[10] Rozin, P., Ashmore, M.B. and Markwith, M. (1996) Lay American conceptions of nutrition: Dose insensitivity, categorical thinking, contagion, and the monotonic mind.
Health Psychology, 15, 438-447.
http://dx.doi.org/10.1037/0278-6133.15.6.438
[11] Mishra, A., Mishra, H. and Nayakankuppam, D. (2009) The group contagion effect: The influence of spatial groupings on perceived contagion and preferences. Psy- chological Science, 20, 867-870.
http://dx.doi.org/10.1111/j.1467-9280.2009.02371.x
[12] Archer E., Hand, G.A. and Blair, S.N. (2013) Validity of
U.S. nutritional surveillance: National Health and Nutri- tion Examination survey caloric energy intake data, 1971-2010. PLoS ONE, 8, Article ID: e76632.
http://dx.doi.org/10.1371/journal.pone.0076632
[13] York, E.B. (2008) Sampling: The new mass medium.
Advertising Age, 79, 3-56.
[14] Scott, M.L., Nowlis, S.M., Mandel, N. and Morales, A.C. (2008) The effects of reduced food size and package size on the consumption behavior of restrained and unrestrain- ed eaters. Journal of Consumer Research, 35, 391-405.
http://dx.doi.org/10.1086/591103
[15] Holmstrup, M.E., Stearns-Bruening, K. and Rozelle, J. (2012) Quantifying accurate calorie estimation using the “think aloud” method. Journal of Nutrition Education and Behavior, 45, 77-81.
http://dx.doi.org/10.1016/j.jneb.2012.04.007
[16] Van Kleef, E., Shimizu, M. and Wansink, B. (2011) Serv- ing bowl selection biases the amount of food served. Jour- nal of Nutrition Education and Behavior, 44, 66-70.