Munich Personal RePEc Archive
Syphilis Cycles
Aadland, David and Finnoff, David and Huang, Kevin X.D.
University of Wyoming
1 October 2007
Online at
https://mpra.ub.uni-muenchen.de/29297/
Syphilis Cycles
David Aadland, David Finno¤ and Kevin X.D. Huang
October 2010
Abstract
Syphilis has re-emerged as a global public health issue. In lesser developed countries, millions of people are contracting the disease, which can be fatal without access to proper treatment. In developed countries, prevalence is on the rise and has cycled around endemic levels for decades. We investigate syphilis dynamics by extending the classic SIRS epidemiological model to incorporate forward-looking, rational individuals and the AIDS epidemic. The integrated economic-epidemiological model shows that human preferences over health and sexual activity are central to the nature of syphilis cycles. We …nd that low-activity individuals will behave in a manner that signi…cantly dampen the cycles, while high-activity individuals will tend to exacerbate the cycles, a phenomenon we refer to asrational dynamic resonance. The model also provides insights into two failed attempts by the U.S. government to eradicate syphilis from the U.S. population.
JEL Codes: D1, I1.
Keywords: syphilis, AIDS, disease, eradication, cycles, fatalism, dynamic resonance, SIRS
1
Introduction
Syphilis is back on center stage as a global health issue. In the 1930s and 1940s, syphilis was
perhaps the most prominent public health issue in the U.S., with more federal dollars spent on
syphilis than any other infectious disease (Brown (1971)).1 In 1937, Surgeon General Thomas
Parran estimated that 10 percent of all adults in the U.S. would be infected with syphilis during
their lifetimes (Parran (1937)). However, with the introduction of antibiotics and the beginning
of the AIDS epidemic, syphilis largely disappeared from the public’s eye. U.S. infection rates for
primary and secondary syphilis fell dramatically during the 1940s and began to oscillate around
a much lower rate of incidence (see Figure 1). Despite the successful reduction in syphilis in the
U.S. and other developed countries over the last half century, the trend appears to have reversed.
Infection rates for syphilis are rising in North America, Western Europe and Australia (Fenton
et al. (2008)). The sharpest rise has occurred in men who have sex with men (MSM), accounting
for over 60% of primary and secondary U.S. syphilis cases in 2004 as compared to only 4% of U.S.
cases in 2000. This is an alarming demographic shift given the high-risk sexual behavior and
elevated chance for HIV infection among MSM (Chen et al. (2002); He¤el…nger et al. (2007)).
Syphilis also remains a persistent health threat in lesser developed countries. The World Health
Organization (WHO) estimates that approximately 12 million new worldwide syphilis infections
occur each year, many of which go untreated (WHO (2004)). Congenital syphilis, in particular,
is estimated to in‡ict over 1.5 million pregnant women in Sub-Saharan Africa with approximately
60% of the acute cases leading to fetal death. This amounts to nearly 500,000 infant deaths
from syphilis in sub-Saharan Africa alone, rivaling those due to HIV and AIDS (Schmid (2004)).
Rapidly developing countries have also seen increases in the incidence of syphilis. Syphilis rates in
China, for instance, have skyrocketed 25 fold since the early 1990s (Chen et al. (2007)).
In the face of these concerns, the WHO and the U.S. Center for Disease Control and Prevention
(CDC) have been actively publicizing plans to eliminate syphilis. The WHO recently introduced
1Syphilis is remembered by many for the infamous Tuskagee experiments where poor, Southern black men were
its global initiative to eliminate congenital syphilis (WHO (2007)). Their plan advocates improved
antenatal care, universal testing for pregnant women and partners, rapid treatment, promotion of
condom use, and enhanced synergies with HIV prevention programs. The CDC’s National Plan
to Eradicate Syphilis, …rst introduced in 1999, is an attempt to capitalize on historically low levels
of prevalence and …nally rid the U.S. of the disease (CDC (1999)). The plan emphasizes improved
reporting and data gathering, rapid diagnosis and treatment of outbreaks, and a concerted e¤ort
to increase awareness of the health consequences of sexual activity.
But the U.S. plan has not worked. The incidence of syphilis in the U.S. has nearly doubled
since 2000, with similar increases occurring in parts of Europe and Asia (Nicoll and Hamers (2002);
Fenton and Lowndes (2004); Renton et al. (2006); Reynolds et al. (2006)). These increases are
alarming because all sexually transmitted diseases (STDs) are driven by the same risky behavior.
If the increases in the prevalence of syphilis indicate greater sexual promiscuity and reduced use
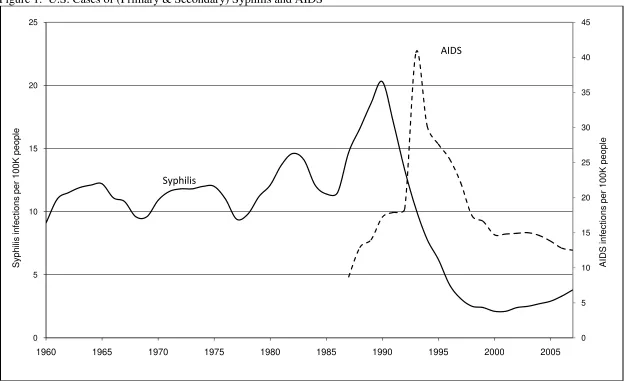
of safe-sex practices, they could warn of a future rise in other STDs including HIV. Figure 1
demonstrates the similarity between the pattern of AIDS incidence and that of syphilis.
It is precisely these reasons – epidemic cycling, eradication, and interaction with HIV/AIDS
– that make syphilis a pertinent and interesting research topic. There has also been a recent
high pro…le debate over the determinants of the oscillations. At its core, the debate has revolved
around whether the origins lie with the biology of the disease (Grassly, Fraser and Garnett (2005))
or with changes in societal behavior and treatment intensities (Breban et al. (2008)). Both sides
of the debate use mathematical epidemiological (ME) models that …x human responses to disease
risk. This runs counter to the …ndings of economists who have demonstrated the importance
of individuals’ ability to respond to changes in disease risk (e.g., Geo¤ard and Philipson (1996);
Kremer (1996); Auld (2003); Gersovitz and Hammer (2004)) and various economic risks (e.g.,
Ehrlich and Becker (1972); Peltzman (1975); Rosen (1981); Viscusi (1990); Shogren and Crocker
(1991)). We o¤er new insights to the debate by specifying an integrated economic-epidemiological
syphilis and AIDS dynamics. 2 To the best of our knowledge, we are the …rst to model more than
one infectious disease within an optimization framework.
We highlight two …ndings from our research: (1) the existence and nature of syphilis cycles
depend critically on human preferences over sexual activity and health and (2) policies designed to
eradicate syphilis are likely to fall short of their objective. First, depending on individual partner
elasticities with respect to prevalence, syphilis cycles can be signi…cantly dampened or accentuated
by the collective actions of rational individuals. For individuals who take a modest number of
sexual partners, the incentives are to choose fewer partners when infection rates rise and more
partners when infection rates fall as noted by Geo¤ard and Philipson (1996). As a consequence,
peaks in aggregate infections are lower, troughs are shallower, and cycles die out more rapidly.
The response of low-activity individuals serves to dampen the cyclical ‡uctuations of the disease.
For individuals who take a high number of partners, the probability of infection is su¢ciently high
that additional partners have a negligible impact on the probability of infection. Under these
circumstances an increase in prevalence causes a decrease in the marginal probability of infection,
leading a rational individual to choose more partners. This type of rational fatalism was …rst
demonstrated by Kremer (1996). Here, we examine the conditions under which fatalism extends
to a dynamic setting and to more than one disease. The potential of fatalism in a dynamic context
is shown to contribute to syphilis cycles by causing them to be exacerbated in their amplitude and
persistence, a phenomenon we refer to asrational dynamic resonance.3
In our second …nding, we o¤er new insights into two failed campaigns by the U.S. government to
eradicate syphilis: the 1964 campaign headed by William Brown, past director of the VD division of
2This integrated model is derived directly from the behavior of rational individuals. The resulting dynamic system
closely resembles classic epidemiological models (Murray (2002)) with one major di¤erence. In the integrated model, the traditional infection parameters are not …xed but vary over time and depend on the optimally chosen number of sexual partners, the number of sex acts with each partner, the overall infection rate in the population, and the natural rates of infection. Consequently, predictions of individuals’ collective responses to changes in the risk of disease transmission (e.g., through education campaigns emphasizing prevention and treatment) will be more robust than predictions from traditional models with …xed parameters and no behavioral responses. For instance, policies designed to reduce the transmission of the disease may fail if individuals choose to o¤set reductions in the risk of infection by engaging in increased amounts of sexual activity.
3This e¤ect is in contrast to the e¤ect of coherence resonance (see for example, Dusho¤ et al. (2004)). Coherence
the CDC (Brown (1971)), and the more recent 1999 National Plan to Eradicate Syphilis. Assuming
reasonable rates of transmission and rational, self-interested individuals, our model predicts that
programs aimed at eradication are likely to fall short of the desired objective. The intuition is
straightforward: when prevalence of the disease is low and nearing eradication, this is precisely
when sexually-active, rational individuals will choose to increase their number of partners and
perpetuate the disease. Successful eradication is theoretically possible but it requires implausibly
high degrees of altruism for those infected with syphilis and AIDS.
Of course, eradication policies can still have a positive impact. Our model predicts that policies
aimed at reducing the risk of infection for high-activity individuals, either through reductions in
the number of partners or through increased protection, can lower long-run endemic equilibria and
stabilize cycles. To some degree, the 1999 syphilis eradication plan had a greater chance of success
due to the prominence of AIDS risk among sexually active individuals. However, the window of
opportunity to eradicate syphilis may be closing due to the discovery of new drug therapies that
lower the health risks of AIDS and encourage more risky sexual behavior. This likely explains the
recent rise in the prevalence of syphilis.
2
Syphilis Epidemiology
Syphilis is an STD caused by the spiral microorganismTreponema pallidum. The disease is unique
in its slow tempo of progression through infected individuals, but if left untreated may eventually
cripple or kill one in four of those infected. The point of infection eventually becomes characterized
by an ulceratic chancre signalling the beginning of what is known as the primary stage of the
disease. Without treatment the disease progresses to a secondary stage observed by a skin rash and
mucous membrane lesions. Following secondary symptoms the disease moves to the latent stage,
and although inapparent, the infection remains within the body and can reappear or eventually
damage internal organs with crippling e¤ects and possible mortality (CDC (2006)). Individuals are
infectious whenever surface lesions are present, in both primary and secondary stages of the disease.
stage there are three potential outcomes for the infection. In the …rst, the infection is biologically
eradicated within the body over a number of years. The second outcome …nds the infection
remaining within the individual over the course of their lifetime, but the internal damage is slight
enough to be imperceptible. The …nal outcome is where the infection progresses slowly to cause
organ damage and can be fatal (Cecil (1948)). While there is no vaccine for syphilis, treatment in its
early stages (through an intramuscular injection of penicillin) will cure the individual, and repeated
treatments will eliminate the infection in late stages. Following treatment and recovery from
the infection, individuals may develop transitory immunity to reinfection before again becoming
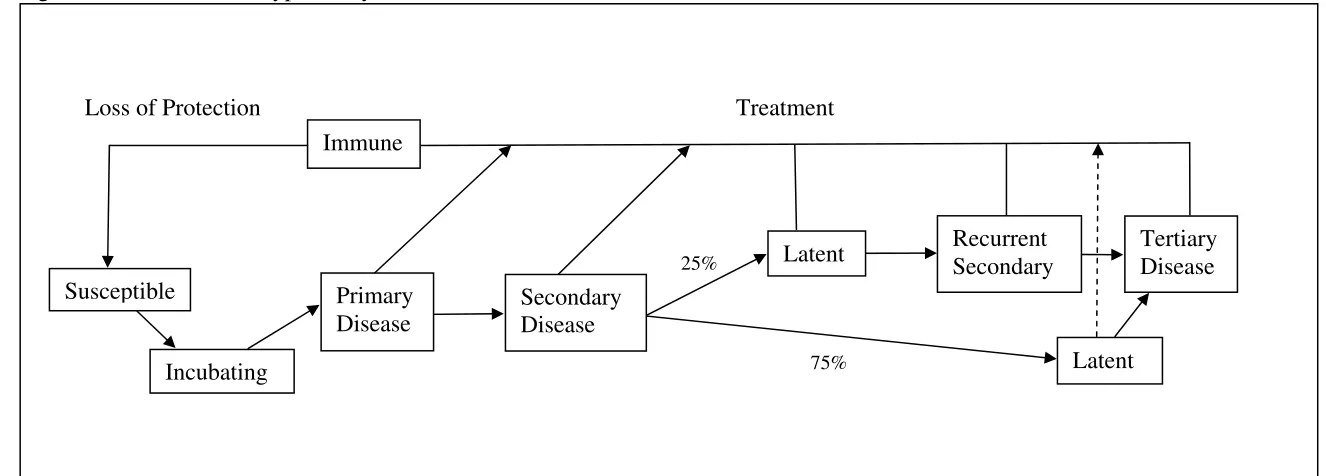
susceptible. This progression from susceptible to infected to recovered (and immune) to susceptible
…ts the general form of the classic SIRS model and is outlined in Figure 2.
The de…ning feature of aggregate syphilis dynamics is the regular cycle in disease prevalence
(see Figure 1). As argued by Grassly et al. (2005), cycles occur as synchronized waves of recovered
individuals lose their temporary host immunity and re-enter the susceptible population. The ebb
and ‡ow of susceptible (S), infected (I) and immune/recovered (R) populations also cause cycles
to persist well past any initial driving impulse. AIDS and gonorrhea, for example, share the same
method of contraction as syphilis but lack transitory host immunity and do not oscillate. Using
gonorrhea as a comparison, Grassly et al. (2005) draw the conclusion that syphilis cycles during the
three-decade period following 1960 must be due to disease biology rather than popular explanations
involving the sexual liberation of the 1960s and the crack cocaine epidemic of the mid-to-late 1980s.
To the casual observer, syphilis is a benign social problem in developed countries. Syphilis
can be rapidly and e¤ectively treated with penicillin. Furthermore, the reported cases of syphilis
have fallen dramatically in the developed world during the past century (Green, Talbot and Morton
(2001)). For example, there were only 7,980 cases of primary and secondary syphilis reported in
the U.S. in 2004, representing 2.7 cases per 100,000 population (CDC (2006)). By contrast, there
were nearly …ve times as many newly reported cases of AIDS in the U.S. in 2004. Yet, these
numbers mask serious policy issues.
prevalence in urban areas, blacks and gay men. The CDC estimates that over 50% of all recent
infections occurred in just 16 counties and 1 city, African Americans are …ve times more likely to
contract syphilis than Caucasians, and nearly 65% of all primary and secondary syphilis cases arise
with MSM (CDC (2006)). Second, statistics in the underdeveloped world are grim. As mentioned
in the Introduction, there are approximately 12 million new worldwide syphilis infections per year
and over 1.5 million cases of congenital syphilis in Sub-Saharan Africa alone. Although our model
is ultimately calibrated to U.S. data and therefore directly applicable to developed countries, we
expect the same general behavioral responses to risk should apply to individuals from the developing
world. Finally, lesions caused by syphilis act as a conduit for other STDs and has been shown to
signi…cantly increase the chance of acquiring HIV (Chesson and Pinkerton (2000)).4
Syphilis remains a threat to public health in the U.S. and societies across the globe. In order
to provide policy makers with better insight into its control, we undertake a careful mathematical
characterization of the disease’s dynamics and the associated behavioral implications.
3
Integrated General Equilibrium Model
Following work by Philipson and Posner (1993), we specify an integrated epidemiological and
economic model to describe syphilis dynamics. Sexual activity brings multiple risks that the
individual cannot choose between, with AIDS being the most serious. Therefore to understand
syphilis dynamics over the past three decades, we specify a joint SIRS/SI epidemiological model of
syphilis and AIDS dynamics. The model is set in discrete time with t indexing annual decision
intervals.5 There is a constant population ofN individuals, which are all identical except for their
state of the disease.
4Chesson, Dee and Aral (2003) argue that the causality may also run in the other direction. They show that
high rates of AIDS mortality in high-risk men were responsible, at least in part, for the decline in the prevalence of syphilis in the U.S. during the 1990s.
5The SIRS and SI models are traditionally modeled in continuous time, but the discrete time version is more
3.1 Epidemiology
The epidemiological portion of the model describes the evolution of six mutually exclusive disease
categories: susceptible to both diseases (s), infected with syphilis only (inS), infected with AIDS
only (inA), infected with syphilis and AIDS (inSA), immune to syphilis (r), and immune to syphilis
while infected with AIDS (rA). Each disease category is measured as a proportion of the overall
population with the sum of the categories equal to one. The model collapses to a traditional SIRS
model wheninA
t =inSAt =rAt = 0 and to a traditional SI model whenintS=inSAt =rt=rAt = 0.
Individual behavior and the population disease dynamics depend on the transition probabilities.
Assuming that individuals independently choosextpartners and engage in a …xed number of sexual
acts (a) with each partner, the probability that susceptible individuals become infected with syphilis
or AIDS is
pSt = Pr(contract syphilis) = 1 [1 Sp(inSt +inSAt )]xt (1)
pAt = Pr(contract AIDS) = 1 [1 Ap(inAt +inSAt +rtA)]xt, (2)
where jp= 1 (1 ja)a is the probability of contracting disease j2 fS; Ag from a single infected
partner, and jais the probability of contracting the disease from a single sexual act (Kaplan (1990);
Oster (2005)). The conditional probabilities for those infected with one disease are:
ptSjA = Pr(contract syphilis jinfected with AIDS) = 1 [1 pSjA(inSt +inSAt )]x A
t (3)
pAtjS = Pr(contract AIDSjinfected with syphilis) = 1 [1 pAjS(inAt +inSAt +rtA)]x S t; (4)
wherexS
t (xAt) is the number of partners chosen by those infected with syphilis (AIDS). Individuals
infected with syphilis or AIDS are allowed to have a di¤erent natural probability of infection, SpjA
and ApjS, than those without a disease. As mentioned above, those with primary or secondary
syphilis have an elevated probability of acquiring HIV (i.e., ApjS > Ap). The dependence on the
chosen number of partners distinguishes the analysis from standard mathematical epidemiology.
st+1 = + [(1 pSt)(1 pAt) ]st+ (1 pAtjS)rt (5)
inSt+1 = inSt +pSt(1 pAt)st (6)
inAt+1 = (1 p
SjA
t )inAt +pAt(1 pSt)st+ pAtjSrt+ rtA (7)
inSAt+1 = inSAt +p SjA
t inAt +pStpAtst (8)
rt+1 = [(1 pAtjS)(1 ) ]rt+ (1 pAtjS)inSt (9)
rtA+1 = (1 )rAt + (1 )p AjS
t rt+pAtjSinSt +inSAt ; (10)
where is the common birth/death rate, 1= is the average duration of syphilis immunity, and
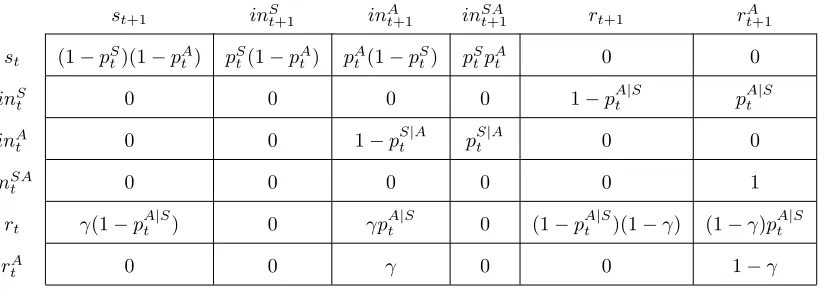
the treatment rate for syphilis is 100%. The transition matrix between disease categories used to
derive the epidemiological model is shown in the Appendix.
We now turn our attention to the economic analysis and the optimal choice of partners.
3.2 Economics
Representative individual i maximizes expected lifetime utility by choosing the number of sexual
partners,xi;t. The objective function is
EX1
j=0
t+j[ln(x
i;t+j) +hi;t+j] (11)
where0 1is the discount factor,E represents an individual’s expectation of future outcomes
and x is the maximum number of partners in a single period. The parameter hi;t captures the
individual’s health status with infected individuals experiencing lower values ofh. The core tradeo¤
in the model is that additional sexual partners bring immediate satisfaction but also the risk of
future infection. Infection in turn causes a deterioration of health.6
6The risk of contracting an STD can be manipulated by varying the level of protection or the number of partners.
In any period t, individual i must be in one of the six epidemiological states: susceptible
(si;t), infected with syphilis (inSi;t), infected with AIDS (inAi;t), infected with syphilis and AIDS
(inSA
i;t ), recovered and immune from syphilis (ri;t) or recovered and immune from syphilis with
AIDS (rA
i;t). For example, if an individual is susceptible to both diseases then si;t = 1 and inS
i;t =inAi;t =inSAi;t =ri;t =ri;tA = 0. Because an individual can only be in one state at any time, si;t+inSi;t +inAi;t+ini;tSA+ri;t +rAi;t = 1for all i and t. The proportions of susceptible, infected
and recovered individuals in the entire population are given by averaging over all i. Because all
individuals are identical other than disease state, we drop the i subscript and consider a single
representative individual in each disease category.
The biology of syphilis immunity in humans is complicated and di¢cult for individuals to
detect (Garnett et al. (1997); LaFond and Lukehart (2006)). Therefore, although there are six
epidemiological categories, the two recovered states are not relevant for decision making because
individuals are unable to identify whether they are immune to syphilis. The value functions
evaluated at the optimal number of partners for each of the four remaining categories – susceptible
(Vt), infected with syphilis (VtS), infected with AIDS (VtA), and infected with syphilis and AIDS
(VtSA) – are given by
Vt = ln(xt) +h+
[pSt(1 pAt )VtS+1+pAt (1 pSt)VtA+1+pStpAtVtSA+1+ (1 pSt)(1 pAt)Vt+1] (12)
VtS = ln(xSt) +hS+ [pAtjSVtA+1+ (1 p
AjS
t )VtS+1] (13)
VtA = ln(xAt) +hA+ [pStjAVtSA+1 + (1 p
SjA
t )VtA+1] (14)
VtSA = ln(x) + VtA+1; (15)
where the health parameters for susceptible (h), infected with syphilis (hS) and infected with AIDS
(hA) individuals satisfy h hS hA 0. The health parameter for individuals infected with
both syphilis and AIDS is normalized to zero.
max-imize (11) without concern for the welfare of the general population. Rational, self-interested
individuals infected with syphilis and AIDS will therefore choose the maximum number of partner,
x, because they face no risk of immediate infection (Geo¤ard and Philipson (1996)). The choice
to engage in the maximum amount of risky behavior while infected imposes a negative externality
on the rest of the population because it propagates the disease through the population and causes
susceptible individuals to choose a suboptimal number of sexual partners.7 Conversely, an
altruis-tic population of infected individuals (or a benevolent social planner guiding the actions of infected
individuals) would sharply decrease the number of sexual encounters so the disease could quickly
be eradicated. We allow for possible altruism by infected individuals (Philipson and Posner (1993);
Gersovitz (2004)) by considering a range of values forx.
Individuals are forward looking and concerned about future bene…ts and risks. We consider
two types of expectation mechanisms in assessing these future bene…ts and risks. First, we assume
individuals form naïve expectations where all future risks and bene…ts are expected to remain at
their current values. This simpli…cation seems reasonable given the many layers of incomplete
information individuals face when attempting to forecast future disease risk. Survey and
exper-imental evidence also shows that individuals often use simpler heuristics or "rules of thumb" to
forecast uncertain future variables (Conlisk (1996)). Second, we consider a rational expectations
forecast of future variables, whereby individuals have complete knowledge of the laws of motion for
disease states and understand the risk-bene…t tradeo¤s faced by other individuals. Under rational
expectations individuals make forecast errors, but they are unrelated to any available current
in-formation. Below, we focus on the results for naïve individuals because the role of economic choice
on disease dynamics is more transparent. However, we solve for the equilibrium paths under both
types of expectations and present the rational expectations results in the Appendix. The main
qualitative …ndings of the paper hold under either expectations mechanism.
Assuming an interior solution, the Euler equations for the number of partners (xt,xSt and xAt )
7The consequences and policies associated with the externalities imposed by infected individuals have been studied
are
x 1
t = p
S
x;t[(1 pAt )Vt+1 (1 pAt)VtS+1+p
A
tVtA+1 p
A
tVtSA+1] +
pAx;t[(1 pSt)Vt+1 (1 pSt)VtA+1+pStVtS+1 pStVtSA+1] (16)
(xSt)
1
= pAx;tjS[Vt+1 VtA+1] (17)
(xAt)
1
= pSx;tjA[VtA+1 VtSA+1]: (18)
where the partial derivative for the probability of infection with respect to the number of partners
is of the form px;t = ln(1 pt)(1 pt)=xt.8
To better understand the Euler equations, consider an individual who is infected with syphilis
but is susceptible to AIDS. The basic problem facing the individual is how many partners to
choose under the risk of future AIDS infection. Equation (17) represents a standard solution
for dynamic expected-utility maximization problems of this type: continue to add partners (xS)
until the marginal bene…ts from an additional partner just o¤set the discounted expected disutility
of contracting the disease in the future (hereafter, marginal cost). However, unlike standard
expected utility maximization problems (von Neumann and Morgenstern (1944)), here the future
risk is endogenous (Ehrlich and Becker (1972)). The more partners are chosen, the greater the
probability of infection. Yet, the probability of infection is also bounded above by one. This implies
that although additional partners will increase the risk of infection, they do so at a decreasing rate
and cause the incremental costs of sexual activity to fall as more partners are added.
These characteristics create an interesting optimization problem. Because individuals exhibit
diminishing marginal utility in x, marginal bene…ts decline over all x. For a given disease
preva-lence, marginal costs also decline withxas the marginal probability of infection falls with additional
partners. If individuals’ relative concern for their health is low, marginal bene…ts will exceed
mar-ginal costs for all choices ofx and individuals will choose the maximum number of sexual partners,
8The second-order su¢cient conditions are presented in the Appendix. The su¢ciency conditions shows that
x. If individuals’ concern for their health is high, marginal costs will exceed marginal bene…ts for
all choices of x and the individual will instead abstain from sexual activity. But, if individuals
have an intermediate concern for their health and su¢cient curvature in utility, the marginal bene…t
and cost curves intersect twice (once for a low number of partners and once for a high number of
partners). While both intersections satisfy the necessary condition for an optimal choice, only the
low-partner intersection satis…es the su¢cient condition and is the optimal choice (see the Appendix
for more details on the second-order conditions).
3.3 Equilibria
An equilibrium for the economic epidemiological system is characterized by a sequence of values
fxt; xAt ; xSt; st; inAt; inAt; inSAt ; rt; rAt g1t=0 that solve the individual’s optimization problem and satisfy
(5 - 10) for all t, subject to the initial values s0; inA0; in0A; inSA0 ; r0 and r0A. Given the complexity
of the system, an analytical solution for the optimal path is not possible. Instead, we solve the
steady-state conditions numerically and use standard linearization methods to evaluate the stability
and transition dynamics around each steady state.9 We …rst examine the long-run equilibrium
and then turn our attention to the transition path and short-run equilibrium. For clarity, we only
present the equilibrium prior to the AIDS epidemic (the analysis of the system after the AIDS
epidemic is presented in the Appendix and discussed below). Since syphilis is the sole disease of
interest, we omit the disease superscripts.
3.3.1 Long-run Equilibria
The long-run equilibrium is obtained when there are no disturbances and the system is allowed
to gravitate to its steady state. In general, there are two possible steady states: an endemic
equilibrium characterized by low prevalence of syphilis and an eradication equilibrium where syphilis
has been eliminated from the population. The steady-state endemic equilibrium is represented by
9Simulations were also performed on the non-linear system using GAMS. Comparisons of the results to those
the following four equations:
s = R 1
0 (19)
in = (1 s)( + )
1 + + (20)
r = (1 s)
1 + + (21)
x 1
= px(V VS) (22)
whereR0 =p[in(1 + )] 1 is the basic reproductive number. R0 measures the number of
suscep-tible individuals who contract the disease from a single infected person in an otherwise uninfected
population (Anderson and May (1991)). In the classic SIRS model (i.e., h = 0;x = 1), R0 is
an exogenous constant and the key parameter for determining stability of the eradication steady
state. R0 is also key to the stability of the EE steady state but is endogenous and depends on
individual choices. As a result, the dynamics around the EE steady states are linked to individuals’
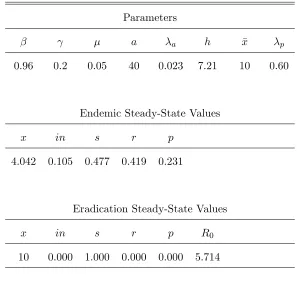
The baseline values for the parameters and the implied steady states are shown in Table 110:
Table 1. Baseline Parameters and Steady-State Values
Parameters
a a h x p
0:96 0:2 0:05 40 0:023 7:21 10 0:60
Endemic Steady-State Values
x in s r p
4:042 0:105 0:477 0:419 0:231
Eradication Steady-State Values
x in s r p R0
10 0:000 1:000 0:000 0:000 5:714
In the endemic steady state, approximately 10% of the sexually active population are infected with
syphilis and 42% are recovered and immune. The probability of infection with a single partner is
23%. In the eradication steady state, individuals take the maximum number of partners,x = 10,
because there is no risk of infection (p = 0). The basic reproductive number, R0, is greater than
one indicating that eradication is locally unstable.
3.3.2 Short-Run Equilibrium and Transition Dynamics
An analytical solution for the transition path of the economic epidemiological system is not
avail-able. Therefore, we investigate the stability of the system by taking a …rst-order Taylor series
approximation of the system around each steady state. The pre-AIDS EE system collapses to
st+1 = + (1 pt )st+ rt (23)
int+1 = int+ptst (24)
rt+1 = (1 )rt+int (25)
1 px;txt
= E ln(xt+1=x) + (h hS)
pt+1
xt+1px;t+1
; (26)
whereE is the expectations operator and the value functions have been substituted out of the Euler
equation. After linearizing the EE system and imposing naïve expectations, the system reduces to
^
xt = [ x=in]inbt (27)
b
int+1 = (spin )inbt+spxx^t+p^st (28)
^
rt+1 = (1 )^rt+inbt; (29)
where carets (^) over variables indicate deviations from their steady-state values, is the elasticity
of partner change (x) with respect to syphilis prevalence (in), andpin = x p(1 pin)x 1 is the
partial derivative ofp with respect toin. After substituting out the control variable x^t and using
the restriction ^st+inbt+ ^rt = 0, the system can be reduced to the following bivariate dynamic
system: 2
6 4inbt+1
^ rt+1
3 7 5=
2 6
4 ( +p) p
1 1
3 7 5
2 6 4inbt
^ rt
3 7
5; (30)
where = s(pin +px x=in) is the sum of two e¤ects on syphilis prevalence. The …rst e¤ect
is standard in mathematical epidemiology and measures how a change in prevalence impacts the
probability of infection, holding the number of partners …xed. The second, an economic e¤ect,
measures how a change in prevalence impacts the probability of infection through a change in
the optimal number of partners. These two e¤ects can work together or in opposite directions
depending on individuals’ preferences for sexual activity and health.
stability of the system. Local stability is determined by the magnitude of the following two
eigenvalues:
+ 0:5h1 + ( p) p1 + (p )2 2(p+ + )i: (31)
If both eigenvalues are inside the unit circle then the system is locally stable, returning to the steady
state for small perturbations. If the eigenvalues also have an imaginary part, then the system will
exhibit stable cycles. Using equation (31), we see that the system displays stable cycles if the
eigenvalues have modulus less than one and2(p+ + )>1 + (p )2
.11 Using the parameter
values in Table 1, the eigenvalues are0:337 0:245i, showing that the baseline EE system exhibits
stable cycles with a ten-year period.
Figure 3 presents a numerically derived phase diagram for the EE system. The "Epidemiology"
locus represents combinations of xt and int that produce time-invariant values for int from the
pre-AIDS SIRS equations. The "Economics" locus represents combination of xt and int that
produce time-invariant values forxtfrom the Euler equation (26). The intersection of the two loci
determines the long-run equilibrium of the EE system, one that exhibits stable cycles for the given
parameter values.
3.3.3 Contrasting Economic and Mathematical Epidemiological Models
The primary distinction between the mathematical and economic epidemiological models is the
ability to react to changes in the risk of infection. If individuals ignore the health consequences of
risky behavior (i.e., h = 0), thus choosing the maximum number of partners each period, the EE
model collapses to the ME model with infection probability
pt= 1 (1 pint)x: (32)
1 1If the eigenvalues have an imaginary part, then they come in complex conjugates a ci with period equal to
(Hamilton (1994))
2
cos 1 a=pa2+c2
and persistence equal to
R=M od[ 1;2] = p
The only di¤erence between the traditional ME model and the EE model with h = 0 is that the
former has a constant infection parameter while the latter has the parameter varying with int. If
the additional restrictionx= 1is imposed,the model collapses to the traditional SIRS model with
a time-invariant infection parameter, p.
The linearized dynamic SIRS system is
2 6 4 b
int+1
^ rt+1
3 7 5=
2 6
4spin ( +p) p
1 1
3 7 5
2 6 4 b
int
^ rt
3 7
5: (33)
SIRS individuals will not alter the number of partners they choose, even in response to signi…cant
variation in disease prevalence. In the EE model, however, individuals vary the number of partners
whenever the risk of infection deviates from normal levels.
The di¤erence in dynamics between the two models can be seen by contrasting the transition
matrices in (30) and (33). The two matrices di¤er by the spx x=in term in the (1,1) position.
This term captures the e¤ect of changes in current infection rates on the probability of infection
through the choice of partners. The key parameter is , the elasticity of partner change (x) with
respect to aggregate infections (in), which is the dynamic counterpart to the behavioral elasticity
discussed by Kremer (1996) and the behavioral response demonstrated in Geo¤ard and Philipson
(1996). In the ME model, = 0because susceptible individuals do not respond to changes in the
risk of infection, resulting in transition dynamics given by (33). In the EE model, can take on
a range of values depending on the biological parameters and individual preferences overx and h.
Following the linearization of (26), this elasticity can be expressed as
= @x @in
in
x =
pin px
in
x +
pinin
1 + ln(1 p) 1 + p : (34)
The partner elasticity is the sum of two parts. The …rst part relates to the probability of
infection, while the second part relates to expected changes in lifetime utility. Together, they
capture the in‡uence of human responses on the dynamics of the system and may cause cycles to
3.3.4 Rational Dynamic Dampening
Consider an exogenous increase in prevalence. When <0, the increased risk of infection causes
susceptible individuals to choose fewer partners. The reduction in partners in turn lowers the
prevalence of the disease and the risk of infection.12 As a result, the original increase in the
infection rate is tempered, a phenomenon we refer to as rational dynamic dampening.
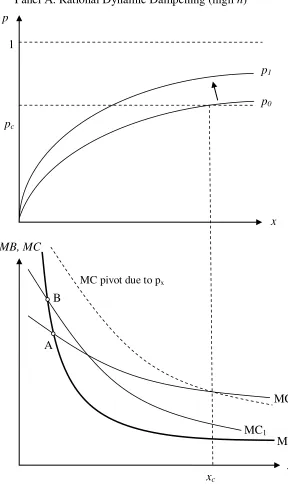
Panel A of Figure 4 illustrates how an individual with dynamic dampening will respond to
an exogenous increase in disease prevalence. The upper graph shows the probability of infection
facing an individual while the lower graph shows the marginal bene…ts and costs of sexual activity.
Marginal costs are drawn for a high value of h such that there is a relatively high concern for
health. The optimal choice of partners corresponds to point A where the marginal bene…t curve
M B …rst crosses the marginal cost curveM C0. In response to an exogenous increase in prevalence
the probability curve shifts up from p0 top1. The marginal cost curve both pivots clockwise due
topx;t and shifts down due to (Vt+1 VtS+1).
The marginal cost curve pivots clockwise at the point xc, the critical or threshold number of
partners at which an increase in prevalence leaves the slope of the probability curve unchanged.
The associated critical probability is pc = 1 (1=e) 0:63.13 This pivot is represented by the
dashed line. The increase in prevalence also shifts the marginal cost curve. Together, the pivot
and shift lead to a movement from M C0 to M C1. The individual then chooses to take fewer
partners, moving to pointB where theM B curve intersects theM C1 curve.
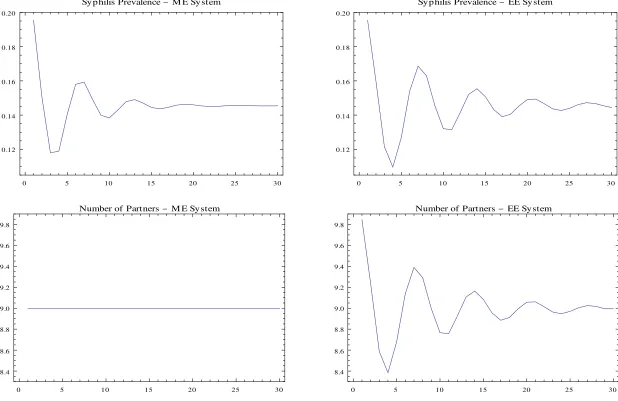
To compare the dynamics of the ME and EE models under dynamic dampening, each model
is subjected to a one-time, …ve percentage point increase in prevalence. The top panels of Figure
5 show the dynamic responses of prevalence to the unanticipated perturbation. The di¤erence
in the persistence is clear when comparing the models. In the ME model, the system produces
1 2This is similar to the behavioral response cited in Geo¤ard and Philipson (1996) where the hazard rate (probability
of infection) decreases as prevalence increases. The implication of <0is not that the probability of infection must fall with an increase in prevalence, rather that the change in probability of infection is smaller than if individuals did not alter their choice of partners.
1 3The critical probability,p
c, is found by taking the cross partial derivative ofpwith respect toxand in, setting
the expression equal to zero, and solving forp(Kremer (1996)). The relevant equation is@pin=@x=pin=x+pinln(1
cyclical responses with period equal to10:5years and persistence equal to0:85; the cyclical response
continues well past the forcing shock. The EE cycles have a ten-year periodicity but are signi…cantly
dampened with persistence of 0:42. Cycles are nearly imperceptible ten years after the driving
shock.
The di¤erences in ME and EE cycles re‡ect the number of chosen partners, shown in the
bottom panels of Figure 5. In the ME model, the number of sexual partners is …xed implying
that syphilis cycles are exclusively due to biological dynamics.14 However, when individuals are
free to choose their number of partners and <0, cycles are signi…cantly dampened.15 With the
initial increase in prevalence, the risk to each susceptible individual rises causing them to rationally
scale back their number of partners. This in turn places downward pressure on rising prevalence.
As the newly infected individuals get treated and transition to recovery, prevalence falls and the
risk of infection wanes. Susceptible individuals then rationally increase their number of partners,
preventing infections from falling as sharply. The result of this interplay between human responses
and biological dynamics causes cycles to be smaller and less persistent than if they were driven
solely by biology.
3.3.5 Rational Dynamic Resonance
The opposite occurs when > 0 and the responses of humans and disease biology are in sync.
Individuals become fatalistic and increase the number of partners in response to an increase in the
prevalence of the disease. This behavior is not driven by emotions, but rather by rational decision
making. For these individuals, the increased prevalence causes a decrease in the marginal cost of
infection, leading a rational individual to choose more partners. In the context of a dynamic SIRS
model, this behavior ampli…es cycles – a phenomenon we refer to as rational dynamic resonance.
This is a formalization of Kremer’s (1996) rational fatalism applied to a dynamic setting and an
1 4For purposes of comparison, we setxin the ME model equal to the endogenous solution forxfrom the EE model.
This also implies thatpandinwill be equal across the two models.
1 5For the baseline parameter values, the elasticity of partner change with respect to prevalence is = 0:81.
SIRS disease.
Panel B of Figure 4 illustrates the problem facing an individual with rational fatalism. The
parameter values in Panels A and B are precisely the same, except for the lower value ofhin Panel
B. The increase in prevalence leads to a reduction in the expected marginal cost of infection and
an increase in the number of partners from point A to point B.
Figure 6 contrasts the dynamic responses of the ME and EE models to a one-time, …ve
percent-age point increase in prevalence. The parameter values in Figures 5 and 6 are identical except for
the health parameter h, which is decreased about 37% from 7:21 to 4:54. The new steady-state
implies an increase in partners from 4:0 to 9:0, causing fatalism to set in. When prevalence is
rising, individuals choose more partners forcing prevalence even higher; when prevalence is falling,
individuals choose fewer partners forcing prevalence even lower. This resonance between the
ini-tial change in infection rates and optimal partner choice causes cycles to be ampli…ed and drawn
out.16
Are fatalism and rational dynamic resonance simply a theoretical curiosity? The answer appears
to be no. There is some evidence that fatalism and rational dynamic resonance may exist. Kremer
(1996) cites anecdotal evidence that individuals have displayed fatalism with respect to AIDS in
high prevalence regions of Uganda. In the developed world, syphilis prevalence is likely too low
to induce fatalism. However, that has not always been the case. In the late 15th century, a
syphilis epidemic spread throughout Europe leading to millions of deaths (Hayden (2003)). Into
the 20th century syphilis continued to be one of society’s primary health concerns, accounting for
“10% of public health expenditures in the U.S., 1 in 14 of all mental hospital admissions and 20,000
annual deaths” in 1936 (Green et al. (2001)). Brown (1971) also estimated that because many
cases of syphilis escape detection, the actual number of cases may be more than …ve times higher
than reported numbers. Furthermore, when you factor in the probability of contracting the suite
of other STDs such as gonorrhea, chlamydia and HIV, high-risk individuals may become resigned
1 6For the baseline parameter values, the elasticity of partner change with respect to prevalence is = 0:28.
to the idea of contracting an STD and take additional partners in response to increases in disease
prevalence.
The …nal piece of evidence for rational dynamic resonance comes from the EE model and surveys
of the sexual behavior for high-risk individuals. Using the baseline parameter values, the EE model
predicts that the threshold number of partners required to induce rational fatalism and dynamic
resonance is approximately …ve partners per year. Several studies indicate that the rate of partner
change among high-risk individuals exceeds this number. For example, McKusick et al. (1985)
report that from a sample of 454 high-risk homosexual men, over 50% have had more than 24
partners in a year, with an average exceeding 40. Koblin et al. (2003), based on a non-HIV sample
of approximately 4,300 homosexual men across 6 major U.S. cities, …nd that over half the sample
report having more than 15 partners per year; nearly half report more than 20 partners per year.17
The rational response for these individuals is to resign themselves to the likelihood of contracting
the disease and behave in a fatalistic manner. That is, individuals will take on additional partners
when prevalence rises and take on fewer partners when prevalence falls, amplifying syphilis cycles.
3.3.6 Dampening, Resonance and Syphilis Cycles in the Post-AIDS Era
The beginning of the AIDS epidemic in the early 1980s drastically changed the risks of sexual
activity. Sexually active individuals are now primarily concerned with AIDS, rather than syphilis
or other STDs. Annual deaths due to AIDS in the U.S. jumped from 135 individuals in 1981 to a
peak of over 48,000 in 1995 (CDC (2007)). The annual mortality rate for AIDS has since declined to
under 15,000 due to the introduction and widespread availability of e¤ective antiretroviral therapies
(Boily et al. (2005)). The e¤ect of AIDS on the dynamics of syphilis prevalence in the U.S. can
be seen in Figure 1. Starting in 1990, the overall number of primary and secondary syphilis
infections in the U.S. gradually fell over the decade and has been gradually rising since 2000. The
nearly two decade U-shaped pattern in syphilis prevalence is signi…cantly di¤erent than the
ten-1 7In their ME model, Grassly et al. (2005) implicitly chose the number of partners per year to be 14.5. (Breban
year oscillations marking the period between the introduction of penicillin and the beginning of the
AIDS epidemic. To better understand the changing dynamics in syphilis prevalence, we explore
the predictions of the EE model after the introduction of AIDS.
For brevity, we outline our main …ndings here, leaving the details of the steady state and
transition dynamics for the post-AIDS EE model in the Appendix. In a setting with a relatively
high health parameter so that individuals choose fewer sexual partners, a one-time increase in
syphilis prevalence has little impact on the optimal number of partners or the dynamics of syphilis
prevalence because AIDS, not syphilis, is the primary health concern. The primary impact of
higher syphilis prevalence is to increase the risk of AIDS through the higher natural probability of
infection ( ApjS > Ap). A one-time increase in AIDS prevalence leads to a greater initial reduction
in the number of partners but monotonically returns to the steady state. The dynamics of syphilis
infections are similar to those from the ME model. This similarity occurs because individuals are
responding to a portfolio of risks, which is dominated by the lifetime consequences of contracting
AIDS.
Repeating the exercise for a low health parameter causes individuals to choose a higher number
of partners and fatalism sets in. With an increase in either syphilis or AIDS prevalence, individuals
choose a higher number of partners, as the marginal probability of AIDS infection declines. The
higher number of partners exacerbates the initial increase in syphilis or AIDS prevalence. This
interplay between the marginal probability of contracting AIDS and the chosen number of partners
continues over time, amplifying and stretching out syphilis cycles. The cycles in syphilis prevalence
spillover into AIDS dynamics through the higher natural probability of AIDS infection. This is
rational dynamic resonance in the post-AIDS era and it occurs in both SIRS and SI diseases.
We now turn our attention to the eradication of syphilis.
4
Syphilis Eradication
Encouraged by historically low prevalence in the late 1950s and in the late 1990s, the CDC has
Health and Welfare (1963); CDC (1999)). Both plans emphasized improved reporting and data
gathering, rapid diagnosis and treatment of outbreaks, and a concerted e¤ort to increase individuals
awareness of the health consequences of sexual activity. It is easy to understand the motivation for
the eradication plans. For example, in 1956 the reported number of primary and secondary syphilis
cases had fallen to 6,392 or approximately one infection for every 26,000 persons. Similarly, in 1999
the reported number of cases was 5,797 or approximately one infection for every 45,000 persons.
With proper education regarding prevention and treatment, it seems plausible that policy makers
at the CDC could continue the downward trend and eventually eliminate the disease altogether.
Yet syphilis rates did not fall. In fact, after the 1999 Eradication Plan, rates of primary and
secondary syphilis incidence rose and are 81%higher in 2007 than in 2000. Why did these plans
fall short of their desired objectives? To answer this question, we investigate the dynamics of the
EE system near eradication.
4.1 Pre-AIDS
Begin with the pre-AIDS eradication plan. To analyze the plan, we investigate the stability
properties of the eradication equilibrium. The transition matrix around the eradication steady
state simpli…es to 2
6
4x p 0
1 1
3 7
5 (35)
with eigenvalues(x p ) and(1 ).18 These two roots are always real so when the system
is stable, it converges monotonically to the eradication steady state. The stability frontier is found
by setting the …rst eigenvalue, x p , equal to one.19 Any value greater than one will cause
eradication to be unstable. The critical number of partners that makes eradication stable is
x = 1 +
p
: (36)
1 8To derive the transition matrix around the eradication steady state, evaluate (33) at the eradication steady state.
The Euler equation forxis not relevant because when the system is near the eradication boundary, individuals will optimally choosext=xfor allt.
Using the baseline parameters from Table 1 ( = 0:05 and p = 0:60), the stability threshold
implies that individuals must average less than1:75 partners per year for eradication to be locally
stable. Even two partners per person will cause eradication to become unstable and the EE system
to gravitate toward an endemic equilibrium.20
Alternatively, the stability threshold (36) for eradication can be interpreted in terms of the basic
reproduction numberR0=p[(1+ )in] 1, which using L’Hôpital’s rule reduces toR0= px=(1+ ).
The standard result in the epidemiological literature is that eradication is locally stable if R0 is
less than one (Anderson and May (1991)). The intuition is straightforward – for eradication to be
stable, the rate at which people are entering the infection pool ( px) must be less than the rate at
which people are leaving the infected pool (1 + ).
4.2 Post-AIDS
Now consider the stability of eradication after the onset of AIDS. Here, the chance of syphilis
eradication is improved because susceptible individuals will take fewer partners due to the fear of
AIDS. To examine the stability of syphilis eradication, we calculate the basic reproductive number
for syphilis around the eradication steady state. The basic reproductive number is given by
R0 =
s Spx+inA SjA p xA
1 + : (37)
Note the similarities of R0 to the pre-AIDS period. The …rst term in the numerator measures the
rate at which individuals from the susceptible pool are becoming infected. This term is weighted by
s, the proportion of the susceptible syphilis population without AIDS, and involves x rather than
xbecause susceptible individuals will not take the maximum number of partners due to the risk of
AIDS. The second term involves the proportion of individuals that are susceptible to syphilis but
have AIDS, inA. These individuals will choose more partners because they are already infected
2 0The eradication stability frontier is independent of h implying that changes in the relative concern for health
with AIDS and the health risks of syphilis are relatively low. As in the pre-AIDS period, the
denominator (1 + ) captures the rate at which individuals are leaving the infected pool, either
through treatment (100%) or death ( ).
One way to contrast syphilis eradication pre- and post-AIDS is to calculate the necessary degree
of altruism (maximum number of allowable partners) for successful eradication. Table 2 shows the
[image:27.612.94.539.269.394.2]degree of altruism needed for syphilis eradication to be locally stable.
Table 2. Altruism and Stability of Syphilis Eradication
Number of Partners
Period Type Fraction of Population Self-Interested Choice Required Altruism
Before AIDS s 100% x= 10 1:75
After AIDS s 85% 1:87 1:87
After AIDS inA 15% x= 10 0:95
Before the AIDS epidemic, the EE model shows that a high degree of altruism is necessary
for eradication to be stable and keep the system from gravitating toward an endemic equilibrium:
the susceptible population must reduce their number of partners by 83% (from x = 10 to less
than two partners per year). For the sexually active population under consideration, this is an
extreme degree of altruism (Andrus et al. (1990)). After the AIDS epidemic, individuals are
primarily concerned with the risk of contracting AIDS, not syphilis. Those susceptible to AIDS
will voluntarily take fewer partners,x= 1:87for our calibration, not out of concern for the general
population but rather out of self-interest. The remaining portion of the population (those with
AIDS) will need to reduce their number of partners to less than one partner per year (xA 0:95)
for syphilis eradication to be successful. Overall, this is a much smaller degree of required altruism
of AIDS. Yet, those with AIDS are still required to take no more than one partner per year and
display a high level of altruism for syphilis to be eradicated.
4.3 Eradication Policy Evaluation
Why have the eradication plans failed to reach their objectives? The answer lies not with the
biology of the disease but rather with economic principles. In the late 1950s, when U.S. syphilis
rates were very low, susceptible individuals realized that they faced a relatively low risk of matching
with an infected partner and contracting the disease. Economic theory predicts that self-interested,
rational individuals will react to this reduced risk by increasing the number of sexual partners until
the bene…ts of additional partners are balanced by the additional risks of infection. The surprising
result from the stability analysis is that for reasonable values of the transmission and population
growth parameters, anything more than two partners per year will make eradication infeasible.
This number is well below commonly accepted estimates of partner frequency per year for those
who have an elevated risk of syphilis (Andrus et al. (1990)). The goal of eradicating syphilis in
the late 1950s predictably failed.
After the introduction of AIDS, syphilis was no longer a primary concern of sexually active
indi-viduals. Prior to 1999, syphilis rates in the U.S. were dropping because sexually active individuals
were reacting to the risk of AIDS by using protection or taking fewer partners. However, as drug
therapies were discovered that lengthened and improved the quality of life for those infected with
AIDS, the incentive to protect or take fewer partners diminished. Individuals began to take more
risk and o¤set the e¤orts of the 1999 syphilis eradication campaign (Boily et al. (2005)).
The primary lesson here is that when infection rates are near eradication and the health risks of
other sexually transmitted diseases are limited – as was the case in the U.S. in 1956 and 2000 – is
precisely the time when individuals will choose the highest number of partners and take the most
risks. As a result, the disease remains within the general population and continues to ‡uctuate
5
Conclusion
Our research has both methodological and policy signi…cance. Methodologically, we develop an
integrated economic-ecological model of infectious disease dynamics in the spirit of Philipson (1995),
Gersovitz and Hammer (2004), Geo¤ard and Philipson (1996) and Kremer (1996). The model is
unique in focusing on an SIRS disease – syphilis – and developing a joint model with AIDS. To the
best of our knowledge, this is the …rst attempt to model two sexually transmitted diseases within
a single optimization framework. In the process, we extend Kremer’s (1996) fatalism result to
a dynamic setting and demonstrate how human responses may either dampen or exacerbate the
magnitude and duration of infectious disease cycles.
The implications from the model can also inform policy. A key part of designing and
imple-menting e¤ective public health policy for infectious diseases is understanding the role of human
behavior. For syphilis, Grassly et al. (2005) argue convincingly that social and behavioral
re-sponses play a secondary role in the evolution of the disease. This implies that strategies directed
towards changing sexual practices may be of limited use in controlling the disease. In contrast,
our analysis shows that behavioral responses are central to the nature of syphilis dynamics. For
example, our model predicts that the recent demographic shift in syphilis infections toward men
that have sex with men (MSM) may amplify syphilis cycles, to the extent that the MSM group
is practicing riskier sexual behavior. The MSM demographic shift also implies a higher rate of
HIV incidence among the MSM group because syphilis infections sharply increase the likelihood of
contracting HIV.
Perhaps the most striking implication of the integrated economic-epidemiological framework
is that eradication is nearly impossible. When the disease is near eradication, this is precisely
the time when a rational susceptible individual will choose to take more partners because the
chance of matching up with an infected individual is very low. Prior to the AIDS epidemic, our
model predicts that the sexually active population under consideration would need to scale back
their number of partners to less than two per year – an extreme degree of altruism for the relevant
more plausible as susceptible individuals will rationally reduce their number of partners in response
to AIDS risk. However, this window of opportunity to eradicate syphilis may have closed. The
discovery of new drug therapies have drastically improved the quality of life for those infected with
AIDS but has the unintended consequence of making syphilis eradication much more di¢cult. As
a result, public health o¢cials may be better served by directing their e¤orts away from eradication
and toward …nding the best mix of education, prevention and treatment policies to reach a more
desirable endemic equilibrium.
References
Anderson, R. and May, R.: 1991, Infectious Diseases of Humans, Dynamics and Control, Oxford
University Press.
Andrus, J. et al.: 1990, Partner noti…cation: can it control epidemic syphilis?, Annals of Internal
Medicine112(7), 539–43.
Auld, M.: 2003, Choices, beliefs, and infections disease dynamics, Journal of Health Economics
22, 361–377.
Boily, M. et al.: 2005, The impact of the transmission dynamics of the hiv/aids epidemic on sexual
behaviour: a new hypothesis to explain recent increases in risk taking-behaviour among men
who have sex with men,Medical hypotheses 65(2), 215–226.
Breban, R. et al.: 2008, Is there any evidence that syphilis epidemics cycle?,The Lancet Infectious
Diseases8(9), 577–581.
Brown, W.: 1971, Status and control of syphilis in the united states, The Journal of Infectious
Diseases124, 428–433.
CDC: 1999, The national plan to eliminate syphilis from the united states. Division of STD
CDC: 2006, Sexually transmitted diseases: Syphilis, www.cdc.gov/std/syphilis/. Division of STD
Prevention: U.S. Centers for Disease Control and Prevention.
CDC: 2007, Hiv surveillance reports, www.cdc.gov/hiv/topics/surveillance/index.htm. Division of
STD Prevention: U.S. Centers for Disease Control and Prevention.
Cecil, R.: 1948, A Textbook of Medicine, 7th Ed., W.B. Saunders Company.
Chen, S. et al.: 2002, Continuing increases in sexual risk behavior and sexually transmitted diseases
among men who have sex with men: San Francisco, Calif, 1999–2001, American Journal of
Public Health92(9), 1387.
Chen, Z. et al.: 2007, Syphilis in china: results of a national surveillance programme, The Lancet
369(9556), 132–138.
Chesson, H., Dee, T. and Aral, S.: 2003, Aids mortality may have contributed to the decline in
syphilis rates in the united states in the 1990s,Sexually Transmitted Diseases30(5), 419–424.
Chesson, H. and Pinkerton, S.: 2000, Sexually transmitted diseases and the increased risk for
hiv transmission: Implications for cost-e¤ectiveness analyses of sexually transmitted disease
prevention interventions,JAIDS Journal of Acquired Immune De…ciency Syndromes24(1), 48–
56.
Conlisk, J.: 1996, Why bounded rationality?,Journal of Economic Literature pp. 669–700.
Dusho¤, J. et al.: 2004, Dynamical resonance can account for seasonality of in‡uenza
epi-demics, Proceedings of the National Academy of Sciences of the United States of America
101(48), 16915–16916.
Ehrlich, I. and Becker, G.: 1972, Market insurance, self-insurance, and self-protection, Journal of
Political Economy80(4), 623–648.
Fenton, K. and Lowndes, C.: 2004, Recent trends in the epidemiology of sexually transmitted
Fenton, K. et al.: 2008, Infectious syphilis in high-income settings in the 21st century, The Lancet
Infectious Diseases8(4), 244–253.
Garnett, G. et al.: 1997, The natural history of syphilis: Implications for the transition dynamics
and control of infection,Sexually Transmitted Diseases 24(4), 185–200.
Geo¤ard, P. and Philipson, T.: 1996, Rational epidemics and their public control, International
Economic Review37(3), 603–624.
Gersovitz, M.: 2004, A preface to the economic analysis of disease transmission, Australian
Eco-nomic Papers39, 68–83.
Gersovitz, M. and Hammer, J.: 2004, The economical control of infectious diseases,The Economic
Journal114, 1–27.
Gersovitz, M. and Hammer, J.: 2005, Tax/subsidy policies toward vector-borne infectious diseases,
Journal of Public Economics89, 647–674.
Goldman, S. and Lightwood, J.: 2002, Cost optimization in the sis model of infectious disease with
treatment,Topics in Economic Analysis and Policy 2(1), 1–22.
Grassly, N., Fraser, C. and Garnett, G.: 2005, Host immunity and synchronized epidemics of
syphilis across the united states,Nature 433, 417–421.
Green, T., Talbot, M. and Morton, R.: 2001, The control of syphilis, a contemporary problem: a
historical perspective,Sexually Transmitted Infections77(3), 214–217.
Hamilton, J.: 1994,Time Series Analysis, Princeton University Press.
Hayden, D.: 2003, Pox: genius, madness, and the mysteries of syphilis, Basic Books.
He¤el…nger, J. et al.: 2007, Trends in primary and secondary syphilis among men who have sex
with men in the United States,American journal of public health 97(6), 1076.
Kaplan, E.: 1990, Modeling HIV infectivity: must sex acts be counted?,JAIDS Journal of Acquired
Koblin, B. et al.: 2003, High-risk behaviors among men who have sex with men in 6 us cities:
Baseline data from the explore study,American Journal of Public Health 93(6), 926–932.
Kremer, M.: 1996, Integrating behavioral choice into epidemiological models of aids,The Quarterly
Journal of Economics111(2), 549–573.
LaFond, R. and Lukehart, S.: 2006, Biological basis for syphilis, Clinical microbiology reviews
19(1), 29–49.
McKusick, L. et al.: 1985, Reported changes in the sexual behavior of men at risk for aids, san
francisco, 1982-84°Uthe aids behavioral research project, Public Health Reports 100(6), 622–
629.
Murray, J.: 2002,Mathematical Biology I: An Introduction, Springer.
Nakashima, A. et al.: 1996, Epidemiology of syphilis in the united states: 1941½U1993, Sexually
Transmitted Diseases23, 16–23.
Nicoll, A. and Hamers, F.: 2002, Are trends in hiv, gonorrhoea, and syphilis worsening in western
europe?,British Medical Journal324(7349), 1324–1327.
Oster, E.: 2005, Sexually Transmitted Infections, Sexual Behavior, and The HIV/AIDS Epidemic*,
Quarterly Journal of Economics120(2), 467–515.
Parran, T.: 1937, Shadow on the land: syphilis, Reynal and Hitchcock.
Peltzman, S.: 1975, The e¤ects of automobile safety regulation,The Journal of Political Economy
83(4), 677–726.
Philipson, T.: 1995, The welfare loss of disease and the theory of taxation, Journal of Health
Economics14, 387–395.
Philipson, T. and Posner, R.: 1993,Private Choices and Public Health: The AIDS Epidemic in an
Renton, A. et al.: 2006, Epidemics of hiv and sexually transmitted infections in central asia trends,
drivers and priorities for control,International Journal of Drug Policy 17(6), 494–503.
Reynolds, S. et al.: 2006, High rates of syphilis among sti patients are contributing to the spread
of hiv-1 in india,Sexually Transmitted Infections82(2), 121–126.
Rosen, S.: 1981, Valuing health risks,American Economic Review Papers and Proceedings71, 241–
245.
Schmid, G.: 2004, Economic and programmatic aspects of congenital syphilis provention,Bulletin
of the World Health Organization82.
Shogren, J. and Crocker, T.: 1991, Risk, self-protection and ex ante economic value, Journal of
Environmental Economics and Management20(1), 1–15.
Toxvaerd, F.: 2010, Recurrent infection and externalities in prevention. unpublished manuscript.
U.S. Department of Health, E. and Welfare: 1963, Public health service publication 918. the
erad-ication of syphilis. world forum on syphilis,Public Health Reports78, 295–304.
Viscusi, W.: 1990, Do smokers underestimate risks?,The Journal of Political Economy98(6), 1253–
1269.
von Neumann, J. and Morgenstern, O.: 1944,Theory of Games and Economic Behavior, Princeton
University Press.
WHO: 2004, Sexually transmitted infections: World health organization fact sheet.
www.who.int/reproductive-health/stis/docs/.
Figure 1. U.S. Cases of (Primary & Secondary) Syphilis and AIDS
Source: Sexually Transmitted Disease Surveillance Report 2008, Division of STD Prevention, U.S. Department of Health and Human Services, Centers for Disease Control and Prevention.
0 5 10 15 20 25 30 35 40 45
0 5 10 15 20 25
1960 1965 1970 1975 1980 1985 1990 1995 2000 2005
AIDS
in
fe
c
ti
o
n
s
p
e
r
1
0
0
K
p
e
o
p
le
Sy
p
h
ili
s
in
fe
c
ti
o
n
s
p
e
r
1
0
0
K
p
e
o
p
le
Syphilis
Figure 2. Flow Chart for Syphilis Dynamics
Reproduced from Garnett et al. (1997).
Susceptible
Incubating
Primary
Disease
Secondary
Disease
Latent
Latent
Recurrent
Secondary
Tertiary
Disease
Immune
25%
75%
Figure 3. Phase Diagram for the EE System
Notes. The parameter values are set at = 0.96, = 0.2, a = 0.023, a = 40, = 0.05, h = 7.21 and𝑥 = 10. The steady state of the EE model, (in*, x*), is found at the intersection of the time invariant loci for in and x.
0 0.1 0.2 0.3
0 1 2 3 4 5 6 7 8 9 10 11 12 13 14 15
in
(I
n
fe
ct
io
n
R
a
te
)
x(Number of Partners) x*
in*
"Economics" Locus: x(t+1) - x(t) = 0