File Popularity Characterisation.
Chris Roadknight, Ian Marshall and Deborah Vearer
BT Research Laboratories, Martlesham Heath, Ipswich, Suffolk, UK. IP5 7RE {roadknic,marshall}@drake.bt.co.uk
Abstract
A key determinant of the effectiveness of a web cache is the locality of the files requested. In the past this has been difficult to model, as locality appears to be cache specific. We show that locality can be characterised with a single parameter, which primarily varies with the topological position of the cache, and is largely independent of the culture of the cache users. The accurate determination of the parameter requires large samples. This is due to a large timescale, long range dependency in the user requests.
1. Introduction.
imagination, and propose tests of the explanations. We have performed some of the tests by analysing a wide variety of caches, and have thereby eliminated some of the theories. We argue (along with another recent, submitted study [BRE98]) that popularity curves are more accurately modelled by a power law curve with a fitted, negative exponent that is not usually -1. We show in this paper, and elsewhere [ROA98], that even for this model to be meaningful, the definitions of what is to be plotted, the sample size, and the fit must be made carefully and precisely. We demonstrate for the first time in this paper that, with appropriate care in the analysis, it can be shown that whilst the power law curves are not strictly Zipf curves they are still culture independent.
0 20 40 60 80 100 120
1 2 3 4 5 6 7 8 9 10 11 12 13 14 15 16 17 18 19 20
Popularity ranking (1=Most Popular)
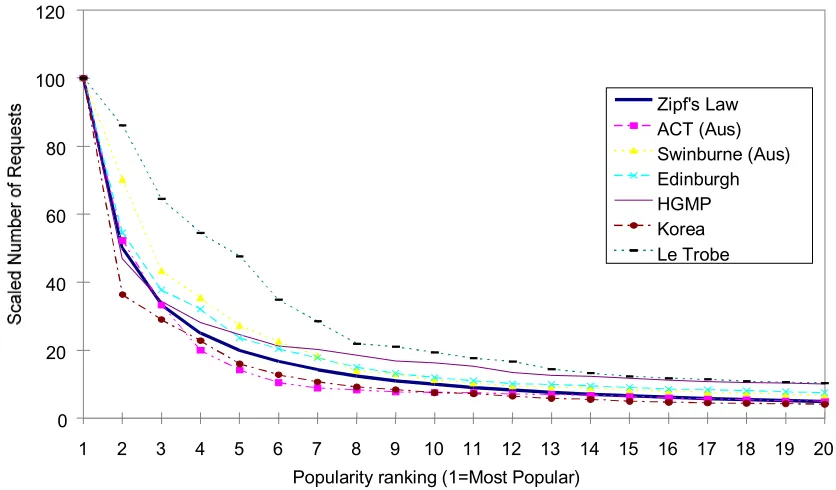
[image:2.612.93.511.207.452.2]Zipf's Law ACT (Aus) Swinburne (Aus) Edinburgh HGMP Korea Le Trobe
Figure 1. Scaled popularity curves at 6 caches.
2. Theories.
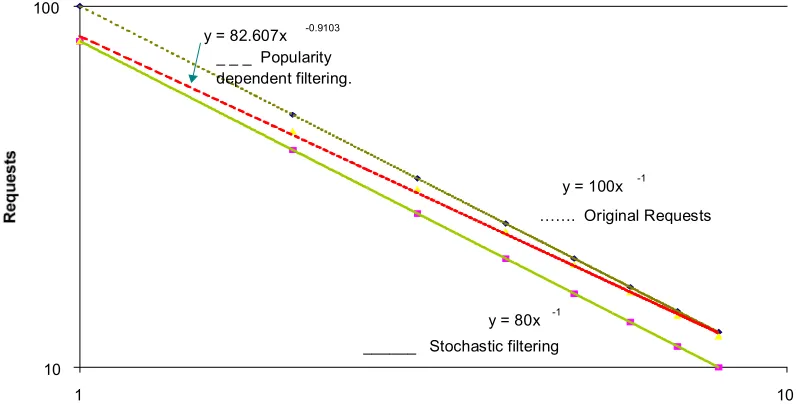
y = 100x -1
y = 80x -1 y = 82.607x -0.9103
10 100
1 10
Ranking
……. Original Requests
______ Stochastic filtering _ _ _ Popularity
[image:3.612.100.500.83.292.2]dependent filtering.
Figure 2. The possible effects of cache filtering
While filtering is one possible factor affecting the exponent of the locality curve, other factors possibly influence the exponent. Possible reasons for differences in power law exponent include:
a. Size of the cache. It has been proposed [BRE98b] that larger caches (i.e. Caches with more requests per day) should have smaller exponents. This can be tested by accurately determining the exponent for a range of caches, at the same position in the hierarchy, and finding a correlation between exponent and size. Taking progressively larger samples from a single cache is not a good test since, as we show below, popularity data is highly bursty and small samples of less than 500000 requests provide unreliable results
b. The nature of client. Clients that have large caches will filter requests more than clients with small caches. As the size of the client cache depends on the available disk space, and the disk space is roughly inversely proportional to the age of the computer, areas tending to have newer computers may have lower exponents. So a cache serving an industrial lab should have a lower exponent than a cache serving publicly funded schools.
d. Cultural differences between user communities. Popularity curves are a reflection in user behavior, so differences in this behavior should be reflected in the data [ALM98]. From consideration of the work of Zipf on word use in different cultures, it seems likely that cultural differences will often be expressed through differences in the K factor in the power curve rather than the exponent. If the exponent is significantly affected by cultural factors then the variation should not be explicable by any obvious cache metrics. This can be tested by using caches which are similar in size and topological position, and demonstrating inexplicable variation in the exponent of the popularity curve
3.
Techniques.
To analyse file popularity, cache logs are usually needed, the only alternative being the correctly processed output from such a cache log. We are indebted to several sources for making their logs available, and hope this is fully shown in the acknowledgements. We have analysed cache logs from several sources including:
NLANR-lj, a high-level cache serving other caches worldwide
RMPLC, a cache serving schools in the UK
FIN, a cache serving Finnish Universities and academic institutions
SPAIN, a cache serving most of the universities and polytechnics of Spain
PISA, a cache serving the computer science department of Pisa University, Italy
Processed statistics are also available via web pages. We have used published logs from:
HGMP (Human Genome Mapping Project) used by scientists working on the HGMP project in the U.K.
ACT, Swinburne, Letrobe, Caches serving academic communities in Australia
The range of logs we have looked contain different proportions of academic and home usage. This is of importance because one possible reason for the variation between caches could be the various usage styles at the caches.
otherwise. The popularity curves in this paper were generated using all the logged requests for files in the analysis period.
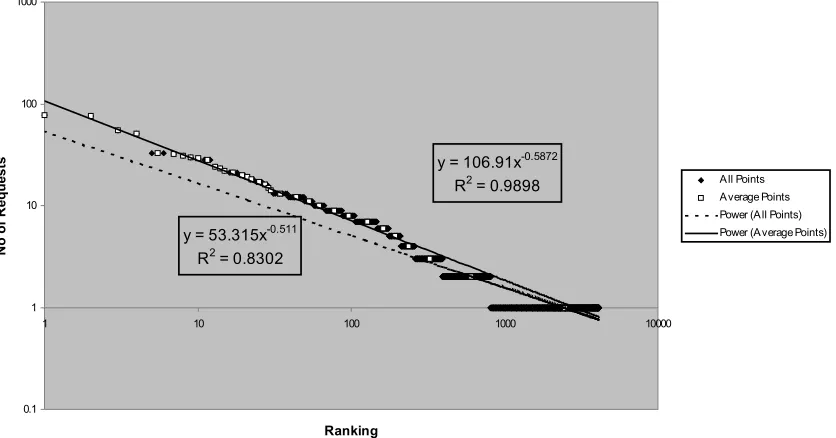
A simple, least squares method [TOP72] was used to fit power law curves to the data. The quality of the fit was checked using the standard R2 test. The least squares algorithm did not initially fit the upper (most popular) part of the curve very well. The R2 was between 0.7 and 0.9 and the visual fit was poor (figure 3). In an effort to rectify this, a fit on modified data was used [ZIP49]. This involved taking all the files that were requested an identical number of times and averaging their ranking, in effect giving them all the same ranking (which seems fairer). For example, if three files are requested 10 times each and are ranked 100, 101 and 102, then one point would appear on the graph at ranking = 101, popularity = 10. As can be seen in figure 3 this makes for a much tighter visual fit. The improvement is confirmed by much higher R2 values (table 1). The least squares calculation could use a weighting for these averaged points, in proportion to the number of files they represent, but with good R2 values this seemed unnecessary.
y = 53.315x-0.511
R2 = 0.8302
y = 106.91x-0.5872
R2 = 0.9898
0.1 1 10 100 1000
1 10 100 1000 10000
Ranking
No
o
f Re
q
u
es
ts
[image:5.612.102.520.289.508.2]All Points Average Points Power (All Points) Power (Average Points)
Figure 3. Illustration of fit calculated by least squares algorithms
4. Variability of Locality.
January 1998 to July 1998, inclusive. Over these six months the fitted exponent ranged from -0.23 to -1.34 with a mean of -0.5958 and a variance of 0.03 (figure 4), using the 'averaged' ranking method mentioned above.
-1.4 -1.2 -1 -0.8 -0.6 -0.4 -0.2
[image:6.612.101.522.120.299.2]0 D ate
[image:6.612.97.526.414.607.2]Figure 4. Variation of best-fit exponent over time
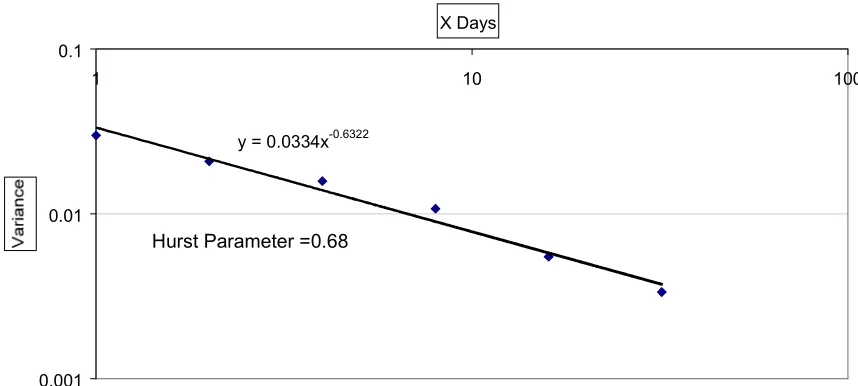
Figure 4 shows the large amount of variation from the mean. If the data shows long-range dependence the sample size required to get a reliable estimate of the slope of the popularity curve will be considerably larger than might be expected for normal Poisson statistics. A simple aggregated variance graph [TAQ95] was plotted using the data in figure 4, to test for long range dependency (fig 5).
y = 0.0334x-0.6322
0.001 0.01 0.1
1 10 100
X Days
Hurst Parameter =0.68
Figure 5. Aggregate variance of fitted exponents over time.
The Hurst parameter was calculated using the formula Slope = 2H - 2
self-similarity revealed in figure 5 is over 3 orders of magnitude of timescale from hours to weeks. It is thus quite different from the long-range dependency reported elsewhere [PIT98] at timescales of up to a few minutes which is attributable to memory effects in network buffers. It is clear evidence for a second long-range dependency at the timescale of human memory, which system designers will also need to take into account.
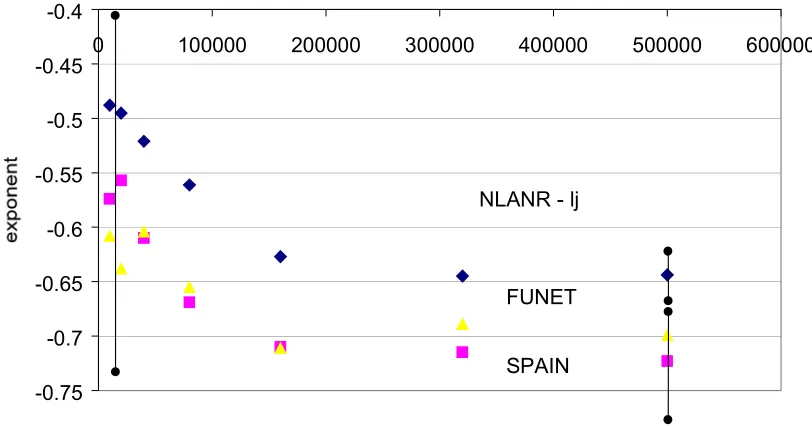
In figure 6 we show the effect of increasing the number of requests used to calculate the exponent, at three of the caches we have used. The exponent converges to a stable value for samples of 300 000 or more requests, for all the caches we have analysed. Error estimates are shown at two request ranges, pointing to a need for over 300 000 requests. We have accordingly used samples of 500 000 requests in the analysis reported in the next section. Interestingly the convergence of the exponent does not appear to depend on time – the time taken to collect 500 000 requests varied from 1 day to 1 week. This means that the number of days taken to collect the sample does not significantly affect the slope of the popularity curve. It is worth noting that the apparent dependence of the value of the exponent at small sample size is not real. The trend is simply due to the fact that the exponent has a heavy tailed distribution with most periods giving low exponents and some periods giving very high exponents (as shown in figure 4), thus the most likely result of picking a random sample is to underestimate the exponent. This effect simply diminishes as the sample size increases.
-0.75 -0.7 -0.65 -0.6 -0.55 -0.5 -0.45 -0.4
0 100000 200000 300000 400000 500000 600000
Number of requests used to calculate exponent
NLANR - lj
[image:7.612.102.508.386.599.2]SPAIN FUNET
Figure 6. Effects on exponent of increasing number of requests sampled.
5. Analysis.
the curves fitted to the data using the techniques outlined in section 3. In table 1 we show the estimated value of the exponent in the power law, together with the error interval and the confidence limit established by the R2 test.
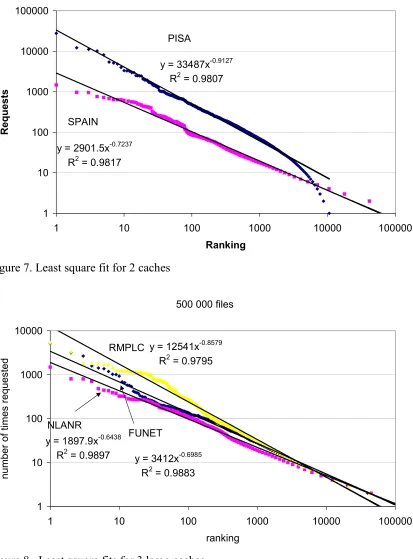
y = 33487x-0.9127 R2 = 0.9807
y = 2901.5x-0.7237 R2 = 0.9817
1 10 100 1000 10000 100000
1 10 100 1000 10000 100000
Ranking
Requests
PISA
[image:8.612.101.514.118.677.2]SPAIN
Figure 7. Least square fit for 2 caches
500 000 files
y = 3412x-0.6985 R2 = 0.9883 y = 1897.9x-0.6438
R2 = 0.9897
y = 12541x-0.8579 R2 = 0.9795
1 10 100 1000 10000
1 10 100 1000 10000 100000
ranking
num
ber of
t
im
es request
ed
FUNET NLANR
RMPLC
[image:8.612.100.512.122.391.2]Figures 7 & 8 clearly show that even when a suitably large number of requests is used very different best-fit curves are generated for each cache. The NLANR cache is used as a parent by some national caches. FUNET and Spain are national caches, RMPLC and PISA are local caches serving very different communities. The best-fit exponents in table 1 follow this order, so our results are a strong indication that the variation is at least partly due to hierarchy filtering as proposed in section 2.
Error estimates were calculated using several methods, the ones shown were the largest calculated. These were derived by sampling the points on the curve, fitting least squares curves and then looking at the variances of the exponents fitted to the subsets of points to derive standard errors.
Cache Position Exponent R squared Error estimate
NLANR - lj Highest -0.644 0.9897 ±0.024
PISA Local -0.913 0.9807 ±0.038
FUNET National -0.699 0.9883 ±0.046
SPAIN National -0.724 0.9817 ±0.045
[image:9.612.84.510.237.332.2]RMPLC Local -0.858 0.9795 ±0.109
Table 1. Cache factors of interest.
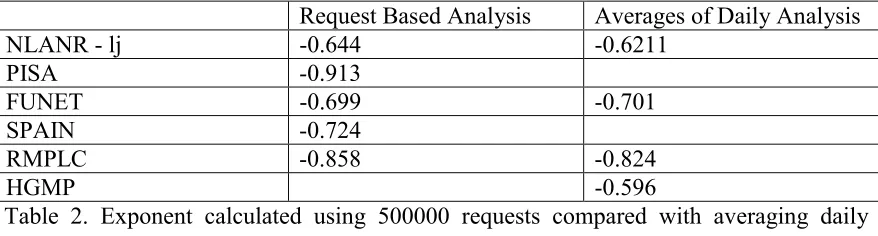
As a second approach, it is possible to look at daily locality curves and their fitted exponents if these exponents are averaged over a long enough period (see section 4). This approach was carried out on 4 caches, with results following those of the previous section (table 2). This result is useful since some caches do not publish individual file requests, but do publish daily popularity curves. An example is the HGMP cache, which is shown in the table although the result shown is for too small a sample to be meaningful.
Request Based Analysis Averages of Daily Analysis
NLANR - lj -0.644 -0.6211
PISA -0.913
FUNET -0.699 -0.701
SPAIN -0.724
RMPLC -0.858 -0.824
[image:9.612.88.527.466.584.2]HGMP -0.596
Table 2. Exponent calculated using 500000 requests compared with averaging daily exponent
6. Discussion.
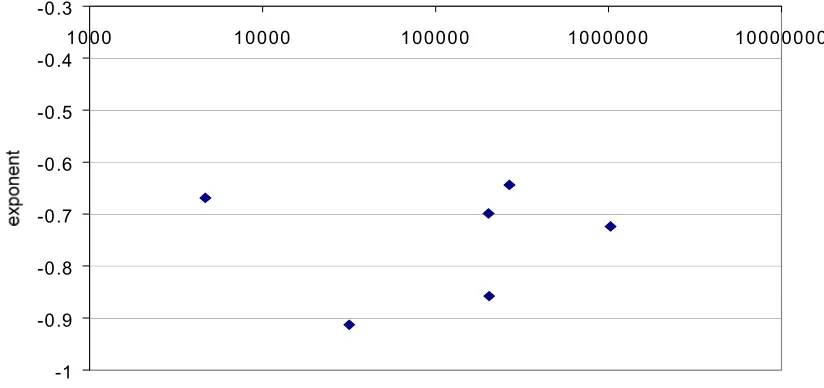
significant. As it is commonly supposed that size is a major factor it is worth presenting futher support for our contention that it is not here. Figure 9 shows cache size plotted against exponent. We cannot fit a line to this data with a meaningful degree of confidence, but any line would show no relationship between size (requests/day) and exponent.
-1 -0.9 -0.8 -0.7 -0.6 -0.5 -0.4 -0.3
1000 10000 100000 1000000 10000000
[image:10.612.99.511.153.347.2]Size (requests/day)
Figure 9. Relationship between requests/day and exponent.
As for culture dependence, consider the low level caches RMPLC and PISA. RMPLC serves UK secondary schools and has a user community which is very different from a ‘normal’ web user community. The users are severely constrained, strongly guided by teachers and syllabi and very young. It is hard to imagine a user community more different from the undergraduates, lecturers and researchers at Pisa university. Yet both sites show similar exponents. There is thus no evidence in our data for cultural dependency in the value of the exponent. Of course this does not mean that other cache metrics will not show culture dependencies.
The lack of significant differences between caches at similar apparent levels in the hierarchy means that client effect are not significant either. However, we believe that increased cache capability at clients may be one reason why old cache logs tend to have higher exponents than current logs. This supposition deserves further analysis.
7. Conclusion.
The analysis of cache popularity curves requires careful definition of what is to be analysed and, since the data displays significant long range dependency, very large sample sizes. With appropriate care it is possible to fit an inverse power law curve to cache popularity curves, with an exponent of between -0.9 and -0.5, and with a high degree of confidence. The exponent does not appear to depend on cache size, on time, or on the culture of the cache users, but only depends on the topological position of the cache in the network. It is thus a useful metric for modelling purposes. Further data should be analysed to fully confirm the relative independence of the metric.
Acknowledgements.
We would like to thank Pekka Järveläinen for supplying us with anonymised logs for the Funet proxy cache, Simon Rainey (RMPLC), Javier Puche (Centro Superior de Investigaciones Cientificas) and Luigi Rizzo (Pisa). We would also like to thank Luis Alberto Velasco for his assistance with writing the log analysis scripts.
References.
[ALM98] V Almeida, M Cesario, R Fonseca, W Meira Jr., C Murta. Analyzing the Behavior of a Proxy Server in Light of Regional and Cultural Issues. 3rd International WWW Caching Workshop. http://wwwcache.ja.net/events/workshop/21/
[ABR95] M Abrams, C Standridge, G Abdulla, S Williams and E Fox. Caching Proxies: Limitations and Potentials. Proc. 4th Inter. World-Wide Web Conference, Boston, MA, Dec. 1995.
[BAE97] M Baentsch, L Baum, G Molter, S Rothkugel and P Sturm. Enhancing the web's infrastructure: From caching to replication. IEEE Internet Computing. March 1997. P. 18-27.
[BAR98] P Barford and M Crovella. 'Generating representative Web workloads for network and server performance evaluation.' In Proceedings of the 1998 ACM SIGMETRICS International Conference on Measurement and Modeling of Computer Systems.
[BRE98] L Breslau, P Cao, L Fan, G Phillips and S Shenker. 'Web Caching and Zipf-like Distributions: Evidence and Implications.' http://www.cs.wisc.edu/~cao/papers/zipf-implications.html
[CUN95] C Cunha, A Bestavros, and M Crovella. Characteristics of WWW client-based traces. Technical report TR-95-010, Boston University Department of Computer Science, April 1995.
[HUB98] B Huberman, P Pirollo, J Pitkow, R Lukose, "Strong regularities in world wide web surfing", Science, 280:95-97 (April 3, 1998).
[MAR98a] I Marshall, C Roadknight, 'Linking cache performance to user behaviour', in 3W3Cache Workshop, Manchester, June 1998.
[MAR98b] M Marsili, Y Zhang, "Interacting individuals leading to Zipf's law", Physical Review Letters, 80(12), 2741-2744 (March 23, 1998)
[PIT98] J Pitcow, 'Summary of WWW characteristics', Computer Networks and ISDN Systems 30 (1998) 551-558
[ROA98] C Roadknight, I Marshall, 'Variations in cache behaviour', in 'Computer Networks and ISDN systems' 30 (1998), pp.733-735.
[TAQ95] M Taqqu, V Teverovsky and W Willinger. 'Estimators for long-range dependance: an empirical study.' Fractals. Vol 3, No. 4 (1995) 785-788.
[TOP72] J Topping. Errors of observation and their treatment. Harper and Row Publishers, INC. 1972