Munich Personal RePEc Archive
A disaggregated analysis of the export
performance of some industrial and
emerging countries
Finicelli, Andrea and Sbracia, Massimo and Zaghini, Andrea
2008
INDUSTRIAL AND EMERGING COUNTRIES
Andrea Finicelli
Bank of Italy
Massimo Sbracia Bank of Italy
Andrea Zaghini Bank of Italy
Abstract
The paper describes the evolution of export shares and quantifies the contribution of the geographical and sectoral specialization for some industrial and emerging market economies between 1985 and 2003. While the strong growth of emerging countries as world competitors has lowered the market shares of all industrial countries, the results of a constant-market-share analysis indicate that the latter have benefited from positive structural effects. Specifically, industrial countries gained from being specialized in either fast-growing sectors (high-tech) or destinations (Asia). The magnitude of these effects, however, has been quite diversified across countries.
Contents
1. Introduction ... 1
2. Preliminary analysis ... 2
3. The CMS methodology ... 8
4. An empirical investigation... 10
5. Conclusions ... 19
1.Introduction
The rapid growth of world trade in the last two decades has been characterized by an increasing importance of emerging countries, as both exporters and importers. These countries have exerted competitive pressures on mature economies, but also provided them with the opportunity to export their own products in fast growing markets. Among developing regions, the growth of Asian markets has been most striking. At the same time, world trade has experienced dramatic structural changes in terms of its composition by product category, with a significant increase in the share of high-tech goods, and a corresponding decrease in that of low-tech products. While industrial countries have inevitably lost market shares to emerging countries, some of them have benefited from the structural changes, thanks to their geographical and sectoral specialization being tilted towards faster-growing destinations and/or products.
In general, an increase in the world share of a country’s exports may reflect an increased ability of that country to sell products abroad, relative to its competitors. Alternatively, it may stem from the fact that world demand, a variable it cannot control, has grown at a relatively faster pace for products and/or markets in which that country is specialized. In the latter case, one would not conclude that the reference country has become more competitive, but rather that it has benefited of a more advantageous initial position.
How has the differential structure of individual countries’ exports affected their relative performance? In order to answer this question, this paper presents the results of a constant market share analysis (CMS) of the changes in the export market shares of some industrial and emerging countries from 1985 to 2003. The CMS is a simple statistical decomposition of market share changes that has a long tradition and several formulations in the literature on international trade. In the variant of the original formulation (see Richardson, 1971a) used in this paper, we decompose market share changes into two factors. The first, labelled as “competitiveness”, measures the change in a country’s share that would have resulted if the sectoral and geographical composition of world demand (imports) had remained the same.1 The second factor, denoted as “specialization”, measures the variation in that country’s share resulted from the changed composition of world demand, taking as given the beginning-of-period structure of its exports; the more world demand is tilted towards products and destinations in which the reference country is specialized, the larger the gain in its market share (or the lower its loss).
1
The analysis is conducted on annual data from Statistics Canada’s World Trade Analyzer on the value of bilateral exports of manufactured goods for 62 industrial and emerging countries and 13 industrial sectors between 1985 and 2003.2 While trade flows data are detailed at the 3-digit SITC Rev. 2 classification level, sectors are grouped into industries according to the ISIC classification. The match between the SITC and ISIC schemes is based on Maskus (1991). For the sake of exposition, the subsequent preliminary analysis groups countries into 5 geographical regions, and industries into 3 broad categories according to the technological intensity of production.
The paper is organized as follows. Section 2 provides a preliminary analysis of the structural and geographical composition of world trade and of some individual countries’ exports, highlighting the major changes occurred between the 1985 and 2003. Section 3 describes the CMS methodology. Section 4 presents the results. Section 5 concludes.
2. Preliminary analysis
With the above questions in mind, this section provides some preliminary facts about the dynamics of world trade by sectors and destinations; correspondingly, it highlights the different composition of individual countries’ exports.
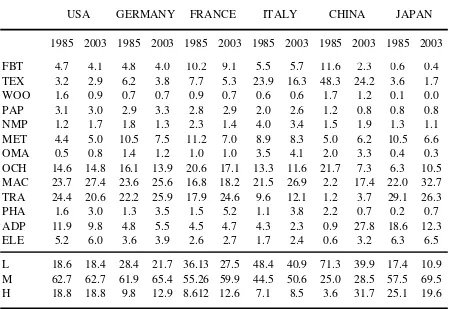
Between 1985 and 2003 world trade has grown, on average, by 9 per cent annually. Growth has been uneven across sectors: while medium-tech exports have grown as the overall average, exports of high-tech goods have grown by 11.3 per cent, and those of low-tech goods by a much smaller 7.8 per cent (Table 1). This has resulted in a significant change of the sectoral composition of world trade, with the share of high-tech exports increasing from 12.6 to 18.5 per cent, that of low-tech falling from 34.9 to 28.6 per cent, and that of medium-tech remaining stable at about 53 per cent.
These dynamics have benefited the countries whose exports had a relatively higher concentration in high-tech sectors. Table 2 shows the sectoral composition of the exports of some industrial countries and China in 1985 and 2003. The following features emerge from the cross-country comparison in 1985: (i) the sectoral composition of the United States and Japan’s exports was tilted towards high-tech goods, while the share of low-techs was much lower than the world average; (ii) European countries’ exports, instead, were much more concentrated in
2
low- and medium-tech sectors; (iii) the share of high-techs in Chinese exports was negligible, as its exports were concentrated mainly in low-tech goods.3
Table 1: Sector classification, sector shares of total world exports in 1985 and 2003, and growth rates
Name Share 1985
Share 2003
Growth rate
ISIC - Description
FBT 6.7 5.1 7.4 Food products, Beverages, Tobacco (L)
TEX 9.5 8.0 7.9 Textiles, Textiles products, Leather and Footware (L) WOO 1.6 1.3 7.5 Wood and products of wood and cork (L)
PAP 3.4 2.9 8.0 Pulp, Paper, Paper products, Printing and Publishing (L) NMP 2.4 2.2 8.4 Other Non-metallic Mineral Products (L)
MET 10.0 7.6 7.3 Basic Metals and Fabricated Metal Products (L) OMA 1.2 1.6 10.8 Other Manufactured Articles (L)
OCH 16.6 14.0 7.9 Other chemicals (M)
MAC 17.8 22.1 10.3 Machinery and Equipment (M) TRA 18.1 16.8 8.5 Transport Equipment (M) PHA 1.2 3.3 15.4 Pharmaceutical (H)
ADP 7.9 11.4 11.2 Office machines, aut. data processing, telecommunications (H) ELE 3.6 3.8 9.3 Electrical and Optical Equipment (H)
L 34.9 28.6 7.8 Low Tech M 52.5 52.9 9.0 Medium Tech
H 12.6 18.5 11.3 High Tech
Note: Growth is the annual average growth rate of dollar exports in the reference sectors between 1985 and 2003; L, M, and H
respectively stand for low-tech, medium-tech and high-tech.
Over time, starting from very different levels (ranging from 17 to 48 per cent in 1985) the share of low-tech exports has significantly declined in Germany, France, Italy and Japan, while that of the United States has remained stable. The most impressive change in sectoral decomposition has been recorded by Chinese exports, for which the share of low-techs has declined from 71 per cent to below 40 percent. With the exception of the United States, the weight of medium-tech goods has increased for all the economies.4 As far as the high-tech industries are concerned, their shares in the exports of Germany and France have consolidated from below 10 per cent to 12,9 and 12,6 per cent, respectively; for Italy the share of high-techs has increased by only 1.5 percentage points, to 8.5 per cent; for the United States it has remained
3
For a traditional approach to the study of the dynamics of international trade specialization see Proudman and Redding (2000) and Redding (2002), who study the evolution over time of an index of comparative advantage in the major industrial economies.
4
stable at 18.8 per cent. Again, China has recorded the most significant change, with the weight of high-tech goods increased from 3.6 to 31.6. Only for Japan has the share of high-techs decreased, from 25 to less than 20 per cent.
Table 2: Sector shares of total exports of manufactures for some countries
1985 2003 1985 2003 1985 2003 1985 2003 1985 2003 1985 2003
FBT 4.7 4.1 4.8 4.0 10.2 9.1 5.5 5.7 11.6 2.3 0.6 0.4
TEX 3.2 2.9 6.2 3.8 7.7 5.3 23.9 16.3 48.3 24.2 3.6 1.7
WOO 1.6 0.9 0.7 0.7 0.9 0.7 0.6 0.6 1.7 1.2 0.1 0.0
PAP 3.1 3.0 2.9 3.3 2.8 2.9 2.0 2.6 1.2 0.8 0.8 0.8
NMP 1.2 1.7 1.8 1.3 2.3 1.4 4.0 3.4 1.5 1.9 1.3 1.1
MET 4.4 5.0 10.5 7.5 11.2 7.0 8.9 8.3 5.0 6.2 10.5 6.6
OMA 0.5 0.8 1.4 1.2 1.0 1.0 3.5 4.1 2.0 3.3 0.4 0.3
OCH 14.6 14.8 16.1 13.9 20.6 17.1 13.3 11.6 21.7 7.3 6.3 10.5
MAC 23.7 27.4 23.6 25.6 16.8 18.2 21.5 26.9 2.2 17.4 22.0 32.7
TRA 24.4 20.6 22.2 25.9 17.9 24.6 9.6 12.1 1.2 3.7 29.1 26.3
PHA 1.6 3.0 1.3 3.5 1.5 5.2 1.1 3.8 2.2 0.7 0.2 0.7
ADP 11.9 9.8 4.8 5.5 4.5 4.7 4.3 2.3 0.9 27.8 18.6 12.3
ELE 5.2 6.0 3.6 3.9 2.6 2.7 1.7 2.4 0.6 3.2 6.3 6.5
L 18.6 18.4 28.4 21.7 36.13 27.5 48.4 40.9 71.3 39.9 17.4 10.9
M 62.7 62.7 61.9 65.4 55.26 59.9 44.5 50.6 25.0 28.5 57.5 69.5
H 18.8 18.8 9.8 12.9 8.612 12.6 7.1 8.5 3.6 31.7 25.1 19.6
CHINA JAPAN
USA GERMANY FRANCE ITALY
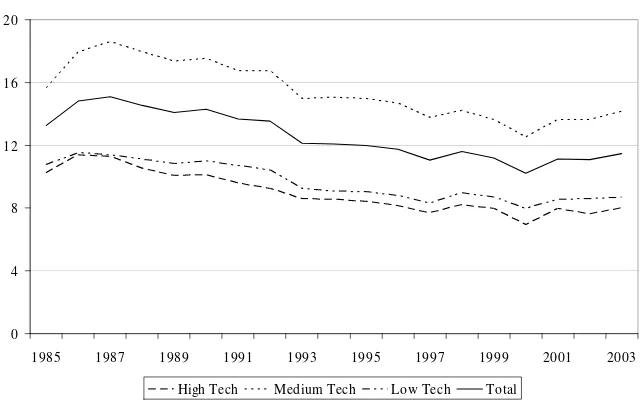
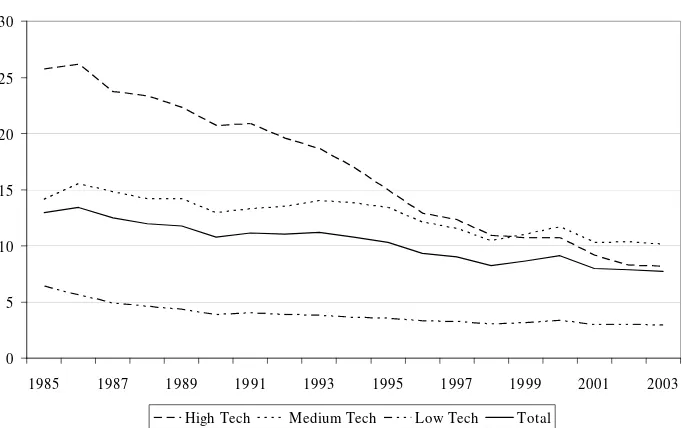
It is interesting to have a closer look at the dynamics of the export market share of each country, overall and in any technological category (figures 1-6). The world share of China has grown continuously: slightly in medium-tech products, strongly in low-tech and exponentially in high-tech ones. The weight of Germany, France and Italy on world trade has declined similarly in each technology category, but while France and Italy have been just able to stabilize their shares since 2000, Germany has inverted the dynamics and started to increase its relative weight.
Figure 1: World shares by technological category – Unites States
0 5 10 15 20 25
[image:7.595.127.449.316.517.2]1985 1987 1989 1991 1993 1995 1997 1999 2001 2003 High Tech Medium Tech Low Tech Total
Figure 2: World shares by technological category – Germany
0 4 8 12 16 20
1985 1987 1989 1991 1993 1995 1997 1999 2001 2003 High Tech Medium Tech Low Tech Total
Figure 3: World shares by technological category – France
0 3 6 9
1985 1987 1989 1991 1993 1995 1997 1999 2001 2003
[image:7.595.119.458.557.761.2]Figure 4: World shares by technological category – Italy
0 2 4 6 8
1985 1987 1989 1991 1993 1995 1997 1999 2001 2003
High Tech Medium Tech Low Tech Total
Figure 5: World shares by technological category – China
0 3 6 9 12
1985 1987 1989 1991 1993 1995 1997 1999 2001 2003
[image:8.595.122.452.77.284.2]High Tech Medium Tech Low Tech Total
Figure 6: World shares by technological category – Japan
0 5 10 15 20 25 30
1985 1987 1989 1991 1993 1995 1997 1999 2001 2003
[image:8.595.119.460.542.756.2]Turning to the geographical composition of world import demand, a major feature that emerges is the strong growth of the weight of Asian countries. Between 1985 and 2003, the share of world import demand originating in Asia has increased from 16.1 to 23.1 per cent (Figure 7). Although the region includes Japan, this has resulted mainly from the rapid growth of emerging economies, especially China. The weight of Europe has increased only slightly (about 1 percentage point), supported by the contribution of Central and Eastern European countries. The share of North America has fallen by 5 percentage points, to 23.6 per cent.
Figure 7: Geographical composition of world import demand
6.1
28.6
16.1
47.2
2.0
Europe Asia Latin America North America ROW 1985
3.6
23.6
23.1
48.0 1.7
Europe Asia Latin America North America ROW 2003
[image:9.595.65.526.606.732.2]The fast growth of demand of Asian emerging countries may have provided, ceteris paribus, a boost to exports of countries having closer trade relationships with them. In this perspective, it is important to note that the geographical orientation of exports towards this region differs substantially across individual countries (Table 3). In particular: (i) European countries’ trade, both in 1985 and 2003, is highly concentrated in Europe with the export towards the fast-growing Asian region, though increasing, ranking only third; (ii) US exports are well diversified and strongly present in Asian markets; (iii) Chinese exports are also tilted towards Asian countries, but, over time, they have adjusted away from this region, towards North America and Europe.
Table 3: Geographical composition of individual countries’ exports (percentages)
1985 2003 1985 2003 1985 2003 1985 2003 1985 2003 1985 2003 Europe 29.4 25.8 72.7 73.4 69.6 77.5 68.8 75.7 18.3 22.5 16.2 18.5 North America 33.5 39.2 13.5 12.5 13.5 9.6 15.5 10.9 16.1 25.7 45.4 29.1 Latin America 4.9 4.1 1.4 1.2 1.5 1.0 1.8 1.3 0.2 1.0 1.3 1.1 Asia 24.7 26.4 7.1 9.8 7.0 7.3 6.3 8.0 62.4 46.9 29.5 47.0 Rest of World 7.5 4.5 5.2 2.9 8.4 4.5 7.5 4.0 3.0 3.8 7.6 4.3
3. The CMS methodology
The constant-market-share analysis (CMS) – a statistical decomposition of the changes in countries’ market shares – provides a useful way to assess the contribution of geographical and sectoral specialization to their overall export performance.5 The first step to illustrate the CMS methodology is to write the export share of a given country (labelled with i) as the sum across destinations (labelled with n) and sectors (labelled with j) of the product of two terms:
∑ ∑
∈ ∈⎟
⎟
⎠
⎞
⎜
⎜
⎝
⎛
=
J j n NW W n W j n W j n i j W W W i
X
X
X
X
X
X
, , , , , , (1)where Xij,n is the value of the exports of country i in country n of the manufactured goods
belonging to the category j (W denotes the world both as source and destination of exports).
The first term of the product in brackets is the share of total imports of goods j from country n supplied by i, or i’s share in market n for good j. The second ratio is the weight of country n’s imports of goods j in total world imports.6 The export share of country i is thus a weighted average of its export shares by destinations and sectors, with weights given by the relative importance of destination-sector pairs in total world imports. The second term in the right-hand side of equation (1) can be further decomposed into three components: one that refers to the geographical specialization of country i, the other referred to its sectoral specialization, plus a term that results from the interaction of these two factors. Equation (1) then becomes:
n W j n W j n W j J
j n N n i j n W j W W j W W n W W W j n W j J j n N
n W n W j n W j n i j W W W i
I
G
S
C
X
X
X
X
X
X
X
X
X
X
X
X
, , , , , , , , , , , , , , , ,∑∑
∑∑
∈ ∈ ∈ ∈≡
≡
⎟
⎟
⎠
⎞
⎜
⎜
⎝
⎛
⎟
⎟
⎠
⎞
⎜
⎜
⎝
⎛
⎟
⎟
⎠
⎞
⎜
⎜
⎝
⎛
⎟
⎟
⎠
⎞
⎜
⎜
⎝
⎛
=
(2)where:
⎟
⎟
⎠
⎞
⎜
⎜
⎝
⎛
=
W nj n i j n i j
X
X
C
, , , ,⎟
⎟
⎠
⎞
⎜
⎜
⎝
⎛
=
W nn W j n W j
X
X
S
, , , ,⎟
⎟
⎠
⎞
⎜
⎜
⎝
⎛
=
WWj n W j n W j
X
X
G
, , , , 5The version of the decomposition that we use here is a variant of the standard formulation of Richardson (1971a). In the latter, the geographical and sectoral effects are derived sequentially, which implies that the choice of the order matters for the final result (Richardson, 1971b). Here, instead, geographical and sectoral effects are treated symmetrically, although at the cost of introducing an interaction term (geography-sector effect). For other recent examples of CMS analysis, see Cheptea, Gaulier, and Zignago (2005) and ECB (2005).
6
⎟
⎟
⎠
⎞
⎜
⎜
⎝
⎛
=
WWj n W j W W n W n W j
X
X
X
X
I
, , , , , .The first term of equation (2) is, as before, country i’s share in market n for good j. The second term is the share of goods of sector j in the total imports of country n (sectoral structure of world exports by destination country). The third term is the share of country n’s imports of sector j’s goods in total world imports of goods in the same sector (geographical orientation of world exports by sector). The rightmost term is an interaction between geographical and sectoral effects, which we call mixed structure effect.7
From total differentiation of (2), the absolute change in country i’s export market share can be approximated as the sum of four effects: a competitiveness effect (dCi), a sectoral effect (dSi), a geographical effect (dGi), and an interaction effect (dIi), namely:
R
dI
dG
dS
dC
X
X
d
WW i i i iW i
+
+
+
+
=
⎟⎟
⎠
⎞
⎜⎜
⎝
⎛
, ,, (3)
where:
∑∑
(
)
∈ ∈
=
J
j n N
n W j n W j n W j n i j i
I
G
S
dC
dC
, , , , ;∑∑
(
)
∈ ∈
=
J
j n N
n W j n W j n i j n W j i
I
G
C
dS
dS
, , , , ;(
)
∑∑
∈ ∈
=
J
j n N
n W j n W j n i j n W j i
I
S
C
dG
dG
, , , , ;∑∑
(
)
∈ ∈
=
J
j n N
n W j n W j n i j n W j i
G
S
C
dI
dI
, , , , ;and R is a residual approximation term.
The competitiveness effect measures the variation in country i’s market share that would have resulted if the sectoral and geographical composition of world demand had remained the same, i.e. had the growth in total world demand (imports) been homogeneous across sectors and importers. The latter implies that countries with different sectoral and/or geographical specialization do not derive a differential advantage from the increase in world demand, and that the resulting variation in market share can be interpreted as a “pure” gain/loss in competitiveness. The sectoral and geographical effects measure the variations in country i’s market share resulting from the changing structure of world demand, given the beginning-of-period structure of the exports of the reference exporter country: the more world demand is
7
biased towards products and destinations in which i specializes, the larger i’s gain in market share. The interaction effect arises because it is not possible to completely separate destination and product effects. For this reason, it is worth aggregating the sectoral, geographical, and interaction effect into an overall structure effect.
4. An empirical investigation
[image:12.595.76.519.293.543.2]In this section we present the results of the CMS analysis. For a sample of countries we report the decomposition of changes in market shares over the period 1985-2003, and assess the contribution of competitiveness and structure to their export performance. Our comments focus especially on the United States, Japan, Germany, France, Italy, and China.
Table 4a. Decomposition of absolute changes in export market shares (1985-2003)
Share 1985 Var. 85-03 Comp. Geo. Sect. Inter. Spec. Residual
United States 14.1 -2.9 -3.7 0.4 0.2 1.8 2.5 -1.7 China 0.9 5.9 5.9 -0.3 0.1 0.4 0.1 -0.1 Japan 12.9 -5.2 -5.8 0.8 -0.1 1.4 2.0 -1.4 Germany 13.3 -1.8 -2.0 0.4 -0.1 0.9 1.2 -0.9 France 6.3 -0.8 -0.4 -0.1 -0.2 0.5 0.3 -0.6 UK 6.1 -1.2 -1.0 0.3 -0.4 0.5 0.5 -0.7 Italy 5.2 -0.7 -0.7 0.0 -0.2 0.5 0.3 -0.3 Spain 1.5 0.8 1.0 0.0 -0.1 0.0 0.0 -0.2 Brazil 1.4 -0.5 -0.3 -0.2 -0.2 0.2 -0.2 0.0 Canada 5.7 -2.1 -0.7 -0.4 -1.1 0.4 -1.1 -0.2 Mexico 0.8 1.7 1.8 -0.1 -0.2 0.2 -0.1 0.0 Korea Rp 2.1 1.0 0.8 0.0 0.0 0.4 0.3 -0.1
Turkey 0.3 0.4 0.5 -0.1 -0.1 0.1 -0.1 0.0 Poland 0.3 0.6 0.6 -0.1 0.0 0.1 0.0 0.0 Hungary 0.2 0.5 0.5 0.0 0.0 0.0 0.0 0.0 Indonesia 0.4 0.3 0.4 -0.2 0.0 0.2 0.0 -0.1
Malaysia 0.8 0.8 0.7 0.1 0.0 0.2 0.3 -0.2 Thailand 0.4 0.8 0.8 0.0 0.0 0.1 0.1 -0.1
Notes. Var. 85-03 is the absolute variation of the share over the reference period. Comp=competitiveness effect, Geo=geographical effect, Sect=sectoral effect, Interaction=interaction effect, Spec=Sect+Geo+Interaction
In many cases, including the United States, Japan, Germany, Italy and China, the contribution of Comp is close to or higher than 100 per cent.8
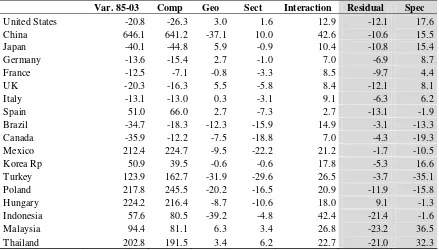
Table 4b. Decomposition of relative changes in export market shares (1985-2003)
Var. 85-03 Comp Geo Sect Interaction Residual Spec
United States -20.8 -26.3 3.0 1.6 12.9 -12.1 17.6
China 646.1 641.2 -37.1 10.0 42.6 -10.6 15.5
Japan -40.1 -44.8 5.9 -0.9 10.4 -10.8 15.4
Germany -13.6 -15.4 2.7 -1.0 7.0 -6.9 8.7
France -12.5 -7.1 -0.8 -3.3 8.5 -9.7 4.4
UK -20.3 -16.3 5.5 -5.8 8.4 -12.1 8.1
Italy -13.1 -13.0 0.3 -3.1 9.1 -6.3 6.2
Spain 51.0 66.0 2.7 -7.3 2.7 -13.1 -1.9
Brazil -34.7 -18.3 -12.3 -15.9 14.9 -3.1 -13.3
Canada -35.9 -12.2 -7.5 -18.8 7.0 -4.3 -19.3
Mexico 212.4 224.7 -9.5 -22.2 21.2 -1.7 -10.5
Korea Rp 50.9 39.5 -0.6 -0.6 17.8 -5.3 16.6
Turkey 123.9 162.7 -31.9 -29.6 26.5 -3.7 -35.1 Poland 217.8 245.5 -20.2 -16.5 20.9 -11.9 -15.8
Hungary 224.2 216.4 -8.7 -10.6 18.0 9.1 -1.3
Indonesia 57.6 80.5 -39.2 -4.8 42.4 -21.4 -1.6
Malaysia 94.4 81.1 6.3 3.4 26.8 -23.2 36.5
Thailand 202.8 191.5 3.4 6.2 22.7 -21.0 32.3
Notes. Var. 85-03 is the relative variation of the share over the reference period (abs. variation divided by share in 1985).
However, market shares appear to have been driven also by structural effects, which in the main industrial countries have contributed positively to export performance. Sectoral and geographical specialization would have brought about, ceteris paribus, a 2.5 percentage points gain in market share for the United States (+18 per cent of the 1985 share); 2 points for Japan (+15 per cent); 1.2 points for Germany (+9 per cent); 0.3 points for France (+4.4 per cent); 0.3 points for Italy (+6.2 per cent). In the case of China the structure effect has been negligible, which is consistent with the fast growth recorded by its exports across all sectors and destinations. Competitiveness has been the most important determinant of the overall increase in market share among the other Asian emerging countries as well, although the overall structure effect has also been relevant.
In the remaining part of this section, we analyse more closely the evolution of export market shares and its components for a more restricted subset of countries. We do that trying to highlight the possible influence on the evolution of market shares, especially short-term, of
8
exchange rates of the exporting countries vis-à-vis the US dollar, which is the currency of conversion of export figures.
Table 4c. Relative importance of individual components for changes in export market shares (1985-2003)
(explained percentage of total absolute change in market shares)
Var. 85-03 Comp Geo Sect Interaction Residual Spec
United States -2.9 126.5 -14.6 -7.7 -62.3 58.1 -84.6 China 5.9 99.2 -5.7 1.5 6.6 -1.6 2.4 Japan -5.2 111.6 -14.8 2.3 -26.0 26.9 -38.5 Germany -1.8 112.8 -19.8 7.7 -51.7 51.0 -63.8 France -0.8 57.3 6.6 26.8 -68.5 77.8 -35.1 UK -1.2 80.2 -27.1 28.4 -41.1 59.7 -39.9 Italy -0.7 99.3 -2.2 24.0 -69.5 48.4 -47.7 Spain 0.8 129.3 5.2 -14.2 5.3 -25.7 -3.6 Brazil -0.5 52.8 35.4 45.7 -42.8 8.9 38.2 Canada -2.1 34.1 20.8 52.4 -19.4 12.0 53.8 Mexico 1.7 105.7 -4.5 -10.5 10.0 -0.8 -4.9 Korea Rp 1.0 77.6 -1.1 -1.1 35.0 -10.3 32.7 Turkey 0.4 131.3 -25.8 -23.9 21.3 -3.0 -28.3 Poland 0.6 112.7 -9.3 -7.6 9.6 -5.5 -7.2 Hungary 0.5 96.5 -3.9 -4.7 8.0 4.1 -0.6 Indonesia 0.3 139.9 -68.1 -8.3 73.7 -37.2 -2.7 Malaysia 0.8 85.9 6.7 3.6 28.4 -24.6 38.7 Thailand 0.8 94.4 1.7 3.1 11.2 -10.4 15.9
The impact of exchange rate changes on export values depends on a series of interacting factors, including the currency denomination of exports, the change in relative prices, and the price elasticity of exports. If producer currency pricing (PCP) is prevalent, an appreciation of the reference country’s currency vis-à-vis the US dollar, if not matched by an increase in relative prices, tends to raise that country’s market share simply because of currency conversion. A real exchange rate appreciation has the opposite effect of reducing the demand for exports from that country. In balance, the two effects can generate the well known J-effect. When, instead, the local currency pricing (LCP) is prevalent, a nominal and real exchange rate appreciation vis-à-vis the US dollar could be expected to leave the dollar value of exports and the corresponding market share unchanged, at least in the short-run. In the medium- to long-run, insufficient exporters’ profit margins could lead them to raise dollar prices or leave the market. Both under PCP and LCP, when the exchange rate changes in nominal but not in real terms, one could expect the market share not to change by much, although the final outcome depends on whether higher or lower local producer prices are passed through to export prices.
structure effect; (iv) the real effective exchange rate.9 Each cumulative effect is constructed as the sum over time of the absolute changes in market shares that would have resulted setting to zero the other effects and the unexplained residual.10
United States
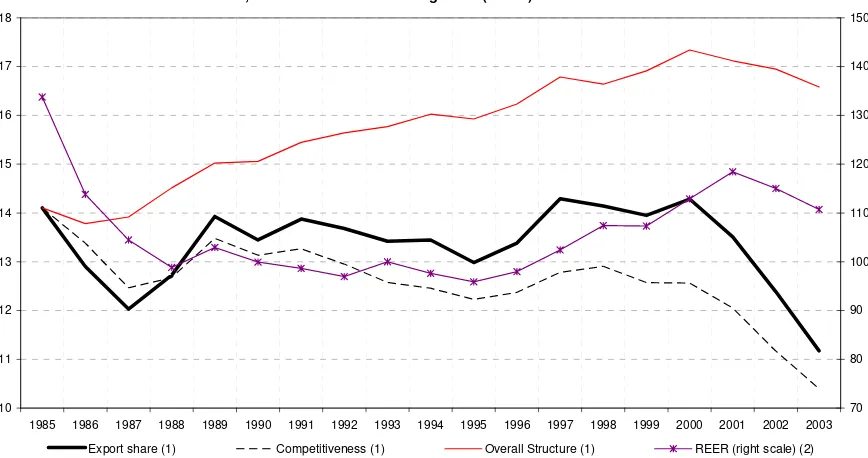
[image:15.595.78.512.305.534.2]As already reported in Tables 4a and 4b, the fall of the export market share of the United States between 1985 and 2003 from 14.1 to 11.2 per cent (a relative decline of about 20 per cent) may be entirely explained by a drop in competitiveness (Figure 9). As anticipated, the loss has been concentrated in the period between 2000 and 2003. Indeed, the market share of the United States in 2000 was slightly above that in 1985, suggesting that throughout the 1990s the country has been able to withstand the growing competition of emerging countries.
Figure 9. Evolution of export market share, contribution of competitiveness and overall structure effects, and real effective exchange rate (REER) for the United States
10 11 12 13 14 15 16 17 18
1985 1986 1987 1988 1989 1990 1991 1992 1993 1994 1995 1996 1997 1998 1999 2000 2001 2002 2003 70 80 90 100 110 120 130 140 150
Export share (1) Competitiveness (1) Overall Structure (1) REER (right scale) (2)
Source: Banca d'Italia and calculations on data from World Trade Analyzer, Statistics Canada. (1) Percentages. - (2) Index 1993 = 100; calculated on the basis of producer prices of manufactured goods; an increase in the index corresponds to an appreciation of the REER.
Bad performance in the last three years could be partly related to the depreciation of the US dollar, although the latter has not been so sizable in real effective terms. Since 1985, the United States have benefited from a comparatively advantageous geographical and sectoral structure, which has contributed a 2.5 percentage points market share increase (+17.6 per cent).
9
The real effective exchange rate is calculated on the basis of manufactured goods producer prices with respect to the same set of competitors considered in the constant-market-share analysis in this paper (62 countries overall).
10
Interestingly, the positive contribution of this component, after continuing on a positive trend, has reversed since 2000. On the basis of the preliminary analysis, the strongly positive overall structure effect for the United States can be partly explained by the relative specialization of its exports in sectors classified as high-tech, for which world demand has recorded a sustained growth. United States’ exports have also been supported by their geographical orientation, strongly biased towards fast growing Asian emerging markets.
Short-run dynamics of the market share of the United States appear to some extent to have been influenced by exchange rate movements. This is particularly evident during the 1985-87 period, when the US dollar depreciated by 22 per cent in real effective terms, and the United States’ export share fell from 14 to 12 per cent; also, between 1995 and 2000, the increase from 13 to slightly above 14 per cent could partly reflect an 18 per cent real effective appreciation. It is interesting to observe that exchange rate movements do not seem to influence the overall structure effect.
Japan
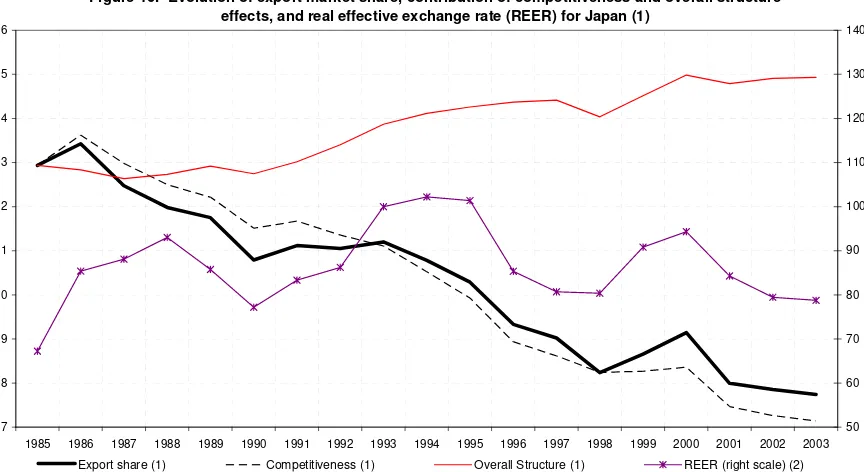
[image:16.595.80.512.425.661.2]Japan’s market share between 1985 and 2003 has fallen dramatically, trending downward from 13 to less than 8 per cent (Figure 10).
Figure 10. Evolution of export market share, contribution of competitiveness and overall structure effects, and real effective exchange rate (REER) for Japan (1)
7 8 9 10 11 12 13 14 15 16
1985 1986 1987 1988 1989 1990 1991 1992 1993 1994 1995 1996 1997 1998 1999 2000 2001 2002 2003 50 60 70 80 90 100 110 120 130 140
Export share (1) Competitiveness (1) Overall Structure (1) REER (right scale) (2)
Source: Banca d'Italia and calculations on data from World Trade Analyzer, Statistics Canada. (1) Percentages. - (2) Index 1993 = 100; calculated on the basis of producer prices of manufactured goods; an increase in the index corresponds to an appreciation of the REER.
stemmed from the favourable geographical and sectoral orientation of its exports, with a comparatively high concentration in high- and medium-tech sectors and a strong presence in the rest of Asia. The evolution of Japan’s market share appears much less influenced by the dynamics of its real effective exchange rate, notwithstanding the latter exhibited wide swings.11
Germany, France, and Italy
[image:17.595.76.512.326.564.2]As documented above (Table 4b), the three European countries have recorded losses in market shares less pronounced, in relative terms, than those of the United States and Japan (Figures 11,12, and 13). Since its peak in 1987 at 15 per cent, Germany’s market share has trended downwards to 10 per cent in 2000, a one third reduction and the highest among the three countries. However, Germany is also the only one to have exhibited a positive performance in recent years, its share returning to about 11.5 per cent in 2003.
Figure 11. Evolution of export market share, contribution of competitiveness and overall structure effects, and real effective exchange rate (REER)for Germany
10 11 12 13 14 15 16
1985 1986 1987 1988 1989 1990 1991 1992 1993 1994 1995 1996 1997 1998 1999 2000 2001 2002 2003 80 85 90 95 100 105 110
Export share (1) Competitiveness (1) Overall Structure (1) REER (right scale) (2)
Source: Banca d'Italia and calculations on data from World Trade Analyzer, Statistics Canada. (1) Percentages. - (2) Index 1993 = 100; calculated on the basis of producer prices of manufactured goods; an increase in the index corresponds to an appreciation of the REER.
The market shares of France and Italy, after peaking at 7 and 5.7 per cent, respectively, in 1990 have fallen to 6 and 4.4 per cent in 2000, and have levelled off thereafter. Export shares for Germany and Italy and, to a lesser extent, France, appear to have been pushed by the US dollar depreciation between 1985 and 1987, but there is no clear evidence that their effective exchange
11
rate movements have strongly driven market shares at other times.12 Compared to the US and Japan, the three European countries have benefited less from the respective sectoral and geographical specializations. For Germany the overall structure effect has contributed a 1.2 percentage points gain in market share (+8.7 per cent of the share in 1985), more in relative terms than for France (+4.4 per cent) and Italy (+6.2 per cent). This may be explained by the comparatively lower concentration of German exports in low-techs – the sector that has recorded the lowest average growth rate and the higher concentration in medium-techs, which instead have grown on average at the same pace as overall world exports.
Figure 12. Evolution of export market share, contribution of competitiveness and overall structure effects, and real effective exchange rate (REER) for France
5 6 6 7 7
1985 1986 1987 1988 1989 1990 1991 1992 1993 1994 1995 1996 1997 1998 1999 2000 2001 2002 2003 85 90 95 100 105
Export share (1) Competitiveness (1) Overall Structure (1) REER (right scale) (2)
Source: Banca d'Italia and calculations on data from World Trade Analyzer, Statistics Canada. (1) Percentages. - (2) Index 1993 = 100; calculated on the basis of producer prices of manufactured goods; an increase in the index corresponds to an appreciation of the REER.
However, the evolution of the cumulative structure effect has been broadly similar across the three countries. In particular, the contribution has been positive until 1990, as a result of the strong intra-area component of European countries trade and the robust growth of their import demand over that period.13 In 1990 the cumulative overall structure effect has peaked for all three countries; it has turned negative over the subsequent three years eroding most of the pervious 5-year gains. After 1993, only for Germany has the structure effect provided a significant contribution, boosting its export market share by 0.9 percentage points (+7.4 per cent
12
For instance, Italy’s real effective exchange rate depreciated by 20 per cent between 1992 and 1995, while its export share only fell from 5.37 to 5.25 per cent.
13
of the share in 1993), compared to 0.2 points for France (+2.8 per cent), and almost zero for Italy. Over the latest decade, Germany has taken advantage of its high concentration in medium-tech sectors, for which world import demand has grown slightly faster than average, while Italy has been penalized by the lagging demand for low-tech goods.14
Figure 13. Evolution of export market share, contribution of competitiveness and overall structure effects, and real effective exchange rate (REER) for Italy
4.0 4.5 5.0 5.5 6.0
1985 1986 1987 1988 1989 1990 1991 1992 1993 1994 1995 1996 1997 1998 1999 2000 2001 2002 2003 80 90 100 110 120
Export share (1) Competitiveness (1) Overall Structure (1) REER (right scale) (2)
Source: Banca d'Italia and calculations on data from World Trade Analyzer, Statistics Canada. (1) Percentages. - (2) Index 1993 = 100; calculated on the basis of producer prices of manufactured goods; an increase in the index corresponds to an appreciation of the REER.
Interestingly, since 2000 all three countries have benefited from a significant positive structure effect, presumably resulting from a recovery of import demand from countries in Europe (mostly originated in acceding markets).15 In the case of Italy, over the same period the strong concentration in the low-tech industries has become less of a disadvantage, since the three broad sectors by technological intensity have recorded very similar growth rates.16
Emerging countries
The growth of Chinese exports has outpaced by far that of world trade, and has been evenly distributed across sectors and destinations, from very low starting levels. It is therefore no surprise that the overall structure effect has contributed nothing of the six-fold increase in
14
Between 1994 and 2003 world import demand for medium-tech goods has increased at an average annual rate of 6.6 per cent, compared to 6.3 per cent for overall world imports, and its share has risen from 51 to 53 per cent; demand for low-tech goods has only increased by 4.9 per cent, and the corresponding share of world imports has fallen from 34 to 29 per cent.
15
The share of imports from Europe out of total world imports, after a decade-long decline from 54 per cent in 1990 to 45 per cent in 2000, has increased up to 48 per cent over the subsequent three years..
16
Chinese export market share (figure 14). As documented in the preliminary analysis, the competitive pressure of Chinese manufacturers has been felt in all sectors, although increasingly so in high-tech industries. This is reflected in the evolution of the sectoral composition of Chinese exports over time: high-tech products accounted for only 4 per cent in 1985, and for one third in 2003, while the weight of low-tech products has fallen from 71 to 40 per cent.
Figure 14. Evolution of export market share, contribution of competitiveness and overall structure effects, and real effective exchange rate (REER) for China
0 1 2 3 4 5 6 7
1985 1986 1987 1988 1989 1990 1991 1992 1993 1994 1995 1996 1997 1998 1999 2000 2001 2002 2003 80 90 100 110 120 130 140 150
Export share (1) Competitiveness (1) Overall Structure (1) REER (right scale) (2)
Source: Banca d'Italia and calculations on data from World Trade Analyzer, Statistics Canada. (1) Percentages. - (2) Index 1993 = 100; calculated on the basis of producer prices of manufactured goods; an increase in the index corresponds to an appreciation of the REER.
The ability to diversify their exports away from low-tech industries has been also a feature of Korea, Malaysia and Thailand, for which the weights of high-tech products have increased from 12 to 27 per cent, 5 to 33 per cent, and from 2 to 22 per cent, respectively, while the weight of low-tech ones has fallen from 51 to 19 per cent for Korea, from 53 to 20 per cent for Malaysia, and from 68 to 32 per cent for Thailand. The pace of such transformations has been quite sustained, especially for Malaysia and Thailand, a large part of them having occurred between late 80s and early 90s; throughout the 90s those countries have thus been able to take advantage of the fast growth of world demand of high-tech goods, as is witnessed by the positive overall contribution of specialization.17
17
Non-Asian emerging countries have remained highly specialized in low-tech products.18 Throughout the period, the share of high-tech industries has never increased above 6 per cent of their total exports for Turkey, Poland, Hungary and Brazil; only Mexico has managed to increase it from 12 to 25 per cent. The geographical orientation of their exports has not been supportive either, with strong weights of, respectively, European and North-American destinations. The contribution of the overall specialization factor has been negative for all of such countries.
5. Conclusions
In the last two decades competitive pressure from emerging countries’ exports has strongly increased, especially from China and other Asian countries, resulting in significant market share losses for major industrial countries. There also have been substantial changes in the geographical and sectoral composition of world import demand, with an increasing share of them being again from the Asian emerging countries and for goods of high technological intensity.
The disaggregated analysis conducted in this paper, using a variant of the traditional constant-market-share methodology, has shown that the differentiated growth of world import demand across sectors and destination markets has allowed countries such as the United States and Japan, specialized in fast-growing sectors and markets, to compensate part of their broad loss of competitiveness. For European countries, including Germany, France and, to a larger extent, Italy, the lower concentration in high-tech products and the less developed trade relationships with Asian emerging countries have resulted in a relatively lower, however still positive, contribution of specialization to the overall performance of their exports. European and Latin American emerging countries have also been penalized by the low share of high-tech exports and by the strong orientation towards markets in own or neighbouring regions. On the contrary, besides gaining market shares overall, Asian emerging countries have also been able to rapidly diversify away from low-tech to high-tech industries.
18
Appendix
The preliminary analysis and constant-market-share analysis are conducted on the basis of bilateral trade data for 62 countries, classified into 5 broad geographical groups as follows:
1. Europe: Austria, Belgium-Luxemburg, Bulgaria, Croatia, Cyprus, Czech Republic, Denmark, Estonia, Finland, France, Germany, Greece, Hungary, Ireland, Italy, Latvia, Lithuania, Malta, the Netherlands, Norway, Poland, Portugal, Romania, Russia, Slovakia, Slovenia, Spain, Switzerland, Sweden, Turkey, and the United Kingdom.
2. North America: Canada, Mexico, and the United States.
3. Asia: China, Hong Kong, India, Indonesia, Japan, Kuwait, Malaysia, Pakistan, the Philippines, Singapore, South Korea, Taiwan, and Thailand.
4. LatinAmerica: Argentina, Brazil, Chile, Colombia, Ecuador, Peru, and Venezuela.
5. Rest of the world: Algeria, Australia, Israel, Morocco, Nigeria, New Zealand, Saudi Arabia, and South Africa.
The ISIC groups are classified into the three broad technological categories according to the following criterion:
1. Sectors included in high-tech are ISIC 5.1 (pharmaceuticals), 8.2 (office machines, automatic data processing, telecommunications, sound recording apparel), and 8.3 (electrical and optical equipment).
2. Sectors included in medium-tech are ISIC 5.2 (other chemicals), 8.1 (machinery and equipment, n.e.c.), and 9 (transport equipment).
References
Alessandrini M., B. Fattouh and P. Scaramozzino (2007),”The changing pattern of foreign trade specialization in Indian manufacturing” Oxford Review of Economic Policy, Vol.23, No.2, pp.270-291.
Carolan T., N. Singh and C. Talati (1998), “The Composition of US-East Asia Trade and
Changing Comparative Advantages”, Journal of Development Economics, Vol.57, No.2,
pp.361-389.
Caselli P. and A. Zaghini (2005), “International Specialization Models in Latin America: the Case of Argentina”, Temi di discussione, No. 558, Banca d’Italia.
Cheptea A., G. Gaulier, S. Zignago (2005), “World Trade Competitiveness: A Disaggregated View by Shift-Share Analysis”, Working Paper, No. 23, Centre D’Etudes Prospectives et D’Informations Internationales.
Danninger S. and F. Joutz (2007), “What Explains Germany's Rebounding Export Market Share?” Working Paper, No. 24, International Monetary Fund
Eaton J. and S. Kortum (2002), “Technology, Geography, and Trade”, Econometrica, Vol. 70, pp. 1741-1779.
ECB (2005), “Competitiveness and the export performance of the euro area trade”, Occasional Paper, No. 30, European Central Bank.
Finicelli A., A. Liccardi and M. Sbracia (2005), “A New Indicator of Competitiveness for Italy and the Main Industrial and Emerging Countries”, Supplements to the Statistical Bulletin, Methodological Notes, Vol. XV, No. 66, Bank of Italy.
Frankel J.A., D. Romer and T. Cyrus (2006), “Trade and Growth in East Asian Countries: Cause and Effect?”, in H. Singer, N. Hatti and R.Tandon (eds.), NICs after Asian Miracle, BR Publishing Corporation Ltd.
International Monetary Fund (2006), “Exports and Domestic Demand in Germany”, IMF Country Report No.06/436.
Maskus K. (1991), “Comparing International Trade data and Product and national Characteristics data for the Analysis of Trade Models”, in: Hooper P., Richardson J.D. (eds.): International Economic Transactions: Issues in Measurement and Empirical Research, Chicago University Press, Chicago.
Proudman J. and S. Redding, (2000), “Evolving Patterns of International Trade”, Review of International Economics, Vol.8, No.3, pp.373-396.
Redding S. (2002), “Specialization Dynamics”, Journal of International Economics, Vol.58, No.2, pp.299-334.
Richardson J.D. (1971a), “Constant-Market-Shares Analysis of Export Growth”, Journal of International Economics, Vol. 1, pp. 227-239.
Richardson J.D. (1971b), “Some Sensitivity tests for a ‘Constant-Market-Shares’ Analysis of Export Growth”, Review of Economics and Statistics, Vol. 1, pp. 227-239.
Stehrer R. and J. Wörz, (2003), “Technological Convergence and Trade Patterns”, Review of World Economics, Vol.139, pp.191-219.
Weinhold D. and J. E. Rauch (1999), “Openness, Specialization, and Productivity Growth in Less Developed Countries”, Canadian Journal of Economics, Vol.32, pp.1009-1027.