End-To-End Microflow Performance Measurement of IPv6
TrafficOver Diverse Wireless Topologies
Dimitrios P. Pezaros
Computing Dept. Lancaster University Lancaster, UK, LA1 4WA
+44 (0) 1524 510378
dp@comp.lancs.ac.uk
Manolis Sifalakis
Computing Dept. Lancaster University Lancaster, UK, LA1 4WA
+44 (0) 1524 510378
mjs@comp.lancs.ac.uk
David Hutchison
Computing Dept. Lancaster University Lancaster, UK, LA1 4WA
+44 (0) 1524 510331
dh@comp.lancs.ac.uk
ABSTRACT
In order to facilitate resource accountability in environments with rapidly and unpredictably evolving traffic dynamics, it is of key importance to develop mechanisms capable of ubiquitously measuring different performance aspects of the diverse operational network traffic. In this work, we used an IPv6-based measurement mechanism to assess the end-to-end performance experienced by a set of IPv6 microflows as these were routed over operational W-LAN and W-WAN network configurations. We present measurements of unidirectional delay and packet loss experienced by bulk TCP and CBR UDP traffic during different days of the week.
Categories and Subject Descriptors
C.2.3 [Computer Communication Networks]: Network Operations – network management, network monitoring, public networks.
General Terms
Measurement, Performance, Design, Experimentation.
Keywords
Wireless, Measurements, IPv6, Microflow, Performance, In-line, End-to-End.
1
INTRODUCTION
Data-carrying wireless IP networks have become increasingly popular both in the workplace and at home (W-LAN), as well as while on the move through mobile telephone handsets that use data transmission services over Wireless Wide Area Networks (W-WAN)s. Local and wide-area wireless communications have traditionally adopted not only different transmission principles and media access technologies from those of wired networks, they also exhibit unique characteristics based on their individual deployment and/or operational conditions. This is due to their inherent sensitivity to environmental, territorial and rapidly-changing conditions.
At the same time, the introduction of IPv6, promising a network
address space able to accommodate any device capable of generating a digital heart-beat, will boost the use of mobile and wireless networks, since an unquantifiable number of devices can become fully-capable IP nodes (mainly end-systems) on-demand, consuming and/or providing data services over the Internet. Such dynamicity can largely influence today’s statically-configured and engineered topologies in unpredictable ways, and it can lead not only to sudden changes of the topology and size of the Internet, but also to rapidly changing usage and traffic/load dynamics.
In such a diverse and dynamically evolving environment, performance measurements become of fundamental importance for the accountability of resources, and also for the better understanding of the properties and characteristics of the diverse wireless network technologies. In addition, the uniqueness and diversity of these environments makes every measurement also unique, and potentially non-reproducible and atypical.
In this paper we use in-line measurement, an IPv6-based technique, to measure the performance experienced by IPv6 microflows as these were routed through wireless local and wide-area service network configurations.
The remainder of this paper is structured as follows. In Section II we describe the principles and main benefits of the in-line measurement technique, and we raise its particular suitability for wireless environments where static over-provisioning and overall administrative network access cannot be assumed. We advocate the usefulness of ubiquitous measurement mechanisms as a means of assessing a variety of metrics with the objective to reveal the actual response of the network elicited by the operational traffic. In Section III we outline the experimental environment over which performance measurements have been conducted. In Section IV we present measurements of end-to-end one-way delay and packet loss experienced by bulk TCP and Constant Bit Rate (CBR) UDP IPv6 microflows over a campus-wide IEEE 802.11b W-LAN and a GPRS over GSM W-WAN. In this context, microflows are defined as a unidirectional portion of traffic identified by a 5-tuple in the datagrams’ headers: IPv6 source and destination addresses, transport protocol, and transport source and destination ports. Based on the network response elicited by the instrumented traffic, we empirically evaluate the performance and actual service quality levels offered by the two operational wireless topologies. In addition, we reveal the temporal variations in traffic-perceived performance between what are commonly considered as “busy” and “off-peak” periods, and its dependence on network usage patterns. We conclude the Permission to make digital or hard copies of all or part of this work for
personal or classroom use is granted without fee provided that copies are not made or distributed for profit or commercial advantage and that copies bear this notice and the full citation on the first page. To copy otherwise, or republish, to post on servers or to redistribute to lists, requires prior specific permission and/or a fee.
paper in Section V by summarising our findings and outlining directions for future work.
2
IN-LINE MEASUREMENT AND IPv6
In-line measurement [1, 2] is a two-point technique that exploits the concept of piggybacking per-packet, minimal measurement indicators within the payload datagrams, in order to reveal how traffic is routed between two nodes in the network, either end-to-end or edge-to-edge. Before departure from a source of an instrumented path, a timestamp or a sequence number is encoded in a dedicated measurement header and is inserted into the packet. Upon arrival at the destination of an instrumented path, the presence of the special-purpose header triggers a direct measurement activity that observes and/or amends the indicators carried within the datagram. In this way, in-line measurement provides an indication of the performance experienced by the service network traffic with high confidence. This avoids “Heisenberg” effects that are often caused by active measurement infrastructures in which the additional synthetic traffic perturbs the network and biases the resulting analysis [3]. At the same time, in-line measurement is a targeted and direct two-point operation as opposed to a post-processing activity of single-point passively monitored data, and can hence be conducted in real-time.
In order for in-line measurement to be applicable to any traffic type carried over the Internet infrastructure, the obvious place to insert the measurement headers is between the network and transport layers in the TCP/IP stack. This, of course, requires the necessary protocol space and support so that additional (measurement) structures can be encoded between existing layers of the networking stack. IPv6 already provides the space for such functionality due to its extensibility options that allow optional information to be encoded between the main network and transport layer headers and only be processed where and when required. In contrast to IPv4 where options are processed en-route by every visited node [4], IPv6 defines the destination options extension header to be only processed by the ultimate or selected, pre-identified intermediate destinations of the datagram [5]. In addition, by having options encapsulated in separate (extension) headers, there is no requirement for a limited set of standardised options, as it was the case in IPv4. Indeed, although (option-carrying) IPv6 extension headers clearly reside in and are processed at the network layer, they are conceptually equivalent to upper-layer headers, uniquely identified by the next header value of the immediately preceding header.
In-line measurement has been engineered as a series of IPv6 destination options headers that enable such functionality to be encoded as a native part of the network layer, and facilitate selective processing only at identified nodes in the network. In this paper we used two measurement option-barring headers to measure one-way delay and one-way packet loss, respectively, as shown in Figure 1.
All measurements have been carried out end-to-end, by instrumenting operational traffic with measurement indicators at an IPv6 source, and by amending/observing these indicators at the ultimate destination of the traffic. Measurement instrumentation has been implemented as a set of processing modules that operate within the IPv6 stacks of instrumented Linux end-systems. The protocol specification guarantees that intermediate nodes do not process the measurement extension
[image:2.595.313.558.141.215.2]headers [5], and hence instrumented traffic is guaranteed identical treatment with the rest of the traffic by the forwarding engines in the network.
Figure 1.(a) One-Way Delay and (b) One-Way Loss Measurement Destination Options Headers
All measurements have been carried out end-to-end, by instrumenting operational traffic with measurement indicators at an IPv6 source, and by amending/observing these indicators at the ultimate destination of the traffic. Measurement instrumentation has been implemented as a set of processing modules that operate within the IPv6 stacks of instrumented Linux end-systems. The protocol specification guarantees that intermediate nodes do not process the measurement extension headers [5], and hence instrumented traffic is guaranteed identical treatment with the rest of the traffic by the forwarding engines in the network.
traffic flows, but also differences in the network response elicited by similar-type microflows over distinct wireless technologies.
3
EXPERIMENTAL ENVIRONMENT
[image:3.595.63.293.305.448.2]End-to-end unidirectional delay and packet loss measurements have been conducted over two diverse wireless service networks over the MSRL infrastructure [7] (Figure 2). MSRL includes a wireless cellular network as well as a combination of 802.11 technologies and it comprises a real service infrastructure. The measurements were carried out between a host machine connected to MSRL’s wired backbone network (measurement point W) and a host machine with multiple wireless interfaces, connected through the 802.11b/g campus-wide network (measurement point B) and through the GPRS/GSM W-WAN network (measurement point A). The host attached to the 100 Mb/s backbone ran Linux kernel 2.4.18 and was equipped with an Intel 100BaseT adapter. The wireless node ran Linux kernel 2.4.19 with two wireless interfaces (Wi-Fi/GPRS) provided by a NOKIA D211 combo PCMCIA 802.11b adapter.
Figure 2: Experimental Environment – MSRL Infrastructure
The W-LAN infrastructure is part of Lancaster University Campus wireless network, and includes 802.11b and 802.11g equipment that operates in the 2.4 GHz frequency band using DSSS (Direct Sequence Spread Spectrum) modulation over CSMA/CA media access control. Although the nominal speed for 802.11b is 11Mb/s, in practice the maximum throughput that an application can achieve is about 5.9 Mb/s over TCP and 7.1 Mb/s over UDP, mainly due to the CSMA/CA protocol overhead in order to guarantee reliable transmissions in diverse environments [8, 9]. In addition, due to the frequency band that they operate in, 802.11b and 802.11g equipment can incur interference from microwave ovens, cordless phones, and other appliances using the same 2.4 GHz band. For this reason 802.11b cards can operate at 11 Mb/s, but will fall back to 5.5, 2, and then 1 Mb/s, if signal quality becomes an issue.
The W-WAN network is the Orange UK GPRS/GSM service network allowing connection speeds of up to 40Kb/s. GSM provides TDMA-based medium access at 900, 1800 or 1900 MHz using 200KHz-wide channels. Each channel is divided in 8 slots some of which are used for voice and some for the GPRS data. If all 8 slots were allocated to GPRS a nominal of 171 Kb/s (practical 115Kb/s) could be reached, however most set-ups allocate asymmetrically slots for up to 20/50Kb/s (up/downlink). Connectivity between Orange UK and the MSRL backbone is served by a 2Mb/s wireless Frame Relay point-to-point link.
4
RESULTS
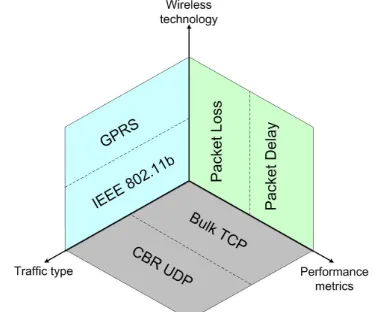
Measurements were conducted over the W-LAN and W-WAN topologies, one set during weekday business hours, and a second during weekend evening hours. Figure 3 shows a 3D overview of the scope of each experimental set. IPv6 bulk TCP and Constant Bit Rate (CBR) UDP microflows have been instrumented with the appropriate measurement headers to assess the end-to-end unidirectional packet delay and loss for each wireless configuration.
For both bulk TCP and UDP experiments, the wireless nodes acted as clients, receiving content from a host attached to high-capacity wired networks. For the purposes of the One-Way Delay (OWD) measurements, both communication ends synchronised using NTP with a common stratum 1 server. In order to avoid having the NTP messages competing with the operational traffic over the bottleneck wireless links, an additional network interface on the wireless nodes was attached to a 100 Mb/s wired network though which time synchronisation was carried out. The NTP daemon was allowed sufficient time to synchronise prior to the experiments until it reached a large polling interval. The offset reported by NTP was always on the order of 10-3 or less,
[image:3.595.332.520.344.500.2]with respect to the minimum OWD observed.
Figure 3: The Three Dimensions of the Measurement Scope
All the traces were empirically examined against negative OWDs as well as against linear alteration (either increase or decrease) of the minimum OWDs over time. None of these offset/skew-related phenomena were experienced [10].
For the purposes of the One-Way Loss (OWL) measurement experiments, each system kept a variable to indicate whether per-packet measurement data had been dropped due to system capability effects, so it can be distinguished from genuine packet loss. Such phenomenon was never observed.
4.1
One-Way Delay (OWD) Measurements
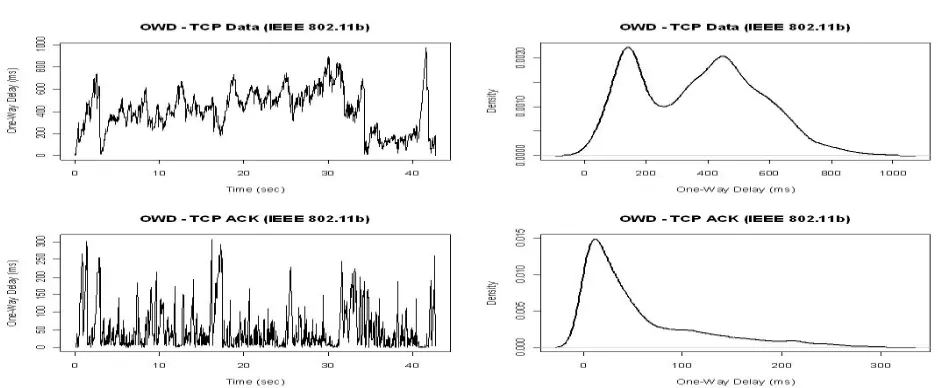
medium, and hence an important indication about the potentially achieved throughput for the transfer. There is an obvious similarity between the OWDs experienced during the two sets of experiments for each wireless network. The often and sharp spikes in the OWD experienced by the Maximum Segment Sized (MSS) packets of the TCP data path over the W-LAN network, together with a mainly increasing trend, lead to the two similar bi-modal distributions with the long tails which concentrate around similar values of OWD.
On the other hand, the spikes in the OWD experienced by the minimum-sized acknowledgements over the reverse TCP path periodically concentrate mainly around the same values and hence the PDF shows a clear mode on small positive OWDs. The
[image:4.595.66.529.256.430.2]thin long tails correspond to the clearly visible and often larger spikes. The mean OWD for the acknowledgement path of the two measurement sets taken over the W-LAN network is 40 and 56 ms, respectively. The mean OWD of the data path for the same sets is 228 and 367 ms, respectively. What is mostly interesting in Figure 4 and Figure 5 is that, although the OWD phenomena experienced during the two W-LAN experiment sets are not arbitrarily different, the OWD assumes higher values in both directions during the evening hours (weekend) experiment than those assumed during business hours. It is highly unlikely that this phenomenon can be attributed to higher network usage during these evening hours, and may have been caused by external interference, which was unquantifiable at the time of the experiment.
Figure 4: One-Way Delay for TCP Data and ACK Paths during business hours (W-LAN)
[image:4.595.60.529.448.642.2]Figure 6: One-Way Delay for TCP Data and ACK Paths during business hours (W-WAN)
Figure 7: One-Way Delay for TCP Data and ACK Paths during weekend evening hours (W-WAN)
During the experiments conducted over the W-WAN, the OWD of the bulk TCP data path shows an interesting repetitive trend of gradually reaching a local maximum and then sharply fallback to some threshold minimum value. Local minima and maxima assume very similar OWD values, and this trend is extrapolated on the PDF that gradually reaches a clear mode. On the reverse path, OWDs largely vary in the range of a few hundreds of milliseconds, with not many high spikes. Their PDF is multimodal but all modes concentrate around similar OWD values. Both data and reverse paths show similar OWD trends between the two different day-and-time datasets. The mean OWD of the data path is 5900 milliseconds during the business hours experiment and 5500 milliseconds during the weekend experiment. Traffic on the reverse path experiences a mean OWD of 800 milliseconds in both cases. The data path figures for the W-WAN experiments can be considered reasonable since higher utilisation of the GSM network during business hours can safely be assumed. Table 1 shows the aggregate TCP goodput measured at the receiver, as being the number of bytes received over the entire duration of the transfer. The number of bytes measured by the IPv6-based in-line measurement modules
accounts for payload data, transport layer header fields, as well as for possibly retransmitted datagrams during the bulk transfer. It is interesting to note that the difference of approximately 400 ms in the mean OWD of the data path between the two W-WAN experiments does not result in a considerable difference in the TCP goodput experienced, whereas the just over a 100 ms difference in the mean OWD of the corresponding W-LAN experiments is followed by a considerable difference in goodput too. Of course, the difference in goodput seen between the two bulk transfers over the W-LAN network can be attributed to different levels of interference and/or packet loss phenomena, which have not been jointly considered during these experiments.
Table 1: Aggregate Goodput of Bulk TCP Transfers
W-LAN W-WAN
Business hours 223.7 KB/s 3.78 KB/s Evening hours
(weekend)
149.9 KB/s 3.84 KB/s
[image:5.595.57.531.293.485.2]goodput achieved over the two wireless networks, with respect to their transmission capacity difference. The ratio of the theoretical capacities of the media (11 Mb/s over 115.2 Kb/s) is much larger than the achieved goodput ratio for both experimental sets. If one also considers the practical constraints of most GPRS-enabled terminals being able to simultaneously listen only to a limited number of downlink channels that further limit the maximum bandwidth, they can infer that the W-LAN infrastructure is either congested, or more likely, signal coverage is bad. During the weekend experiment, when resource contention of the W-LAN infrastructure is low, the goodput ratio of the bulk transfers corresponds to a capacity ratio of 1.2Mb/s over 30.72Kb/s. OWD for UDP microflows was measured while streaming CBR traffic consisting of 512-byte datagrams. In each experiment, different bit rates have been tried in sequential runs that approximate typical streaming application rates, while laying well into the theoretical transmission capacities for each technology. The OWD measurements presented below focus on two different bit rates for each technology, one that was seamlessly handled by the medium, and a second that stressed, and in some cases exceeded the (practical) capacity of the network under test. Figure 8 shows the OWD experienced by traffic streamed at 1Mb/s and 2Mb/s respectively over the W-LAN network during the ‘business hours’ experimental set. Per-packet OWD is mostly concentrated around a few tens of milliseconds for the 1Mb/s microflow with a mean of 25.9ms. Some relatively large values that appear to occur periodically, and some even larger values between the 150th and 250th seconds
of the experiment result on the PDF having a clear mode on small positive values, followed by a very long thin right tail. Figure 9 and Figure 10 show OWD experienced by the UDP traffic when streamed over the W-WAN network, at 20Kb/s and 50Kb/s, during business hours and weekend evening hours respectively. It is interesting to examine the (dis-)similarities between the different experimental runs. The time series plots in Figure 9 show a clear periodic trend where OWD sharply increases by more than a factor of 20 every 53 seconds. Thus, although the mean OWD is 2500 ms, the median is only 634 ms indicating that 50% of the packets experienced delays of just over 500 ms. The same periodicity is experienced by the OWD during the 50 Kb/s CBR flow, where, again sudden increases in delay occur every 53 seconds. This periodicity in delay increase is coupled with datagram loss phenomena, as it can be seen from the discontinuity of the plots, and will become apparent in the next sections. However, OWD assumes overall larger values with a mean of 5100 ms and hence these increases do not have the same impact on the distribution. During the weekend experiment shown in Figure 10, such periodic increases in the OWD are not apparent. Rather, sudden increases in delay of up to a factor of four with respect to the minimum OWD of 418 ms are more random.
The mean OWD is 487 ms for the 20 Kb/s flow, and 5100 ms for the 50 Kb/s flow. Overall, OWD assumes similar values between the two experimental sets, with all the quantiles of the OWD distributions for each bit-rate lying on the same range.
4.2
One-Way Loss (OWL) Measurements
Unidirectional packet loss has been measured by grouping datagrams into flows at the source of the instrumented path based on their network and transport layer 5-tuple. Each flow has an
associated timer (103 sec) after which, if no packets belonging to
that flow have been seen, its entry expires. Network level incremental sequence numbers are piggybacked in each datagram at the source, and packet loss is calculated at the destination between two successively received packets A and B, based on the following formula:
OWL = SeqNumB– SeqNumA– 1.
Positive OWL values usually indicate datagrams being dropped, whereas negative OWL values indicate either link-level packet retransmissions, or out-of-order datagram delivery if they are immediately preceded by positive OWL values and they all sum-up to zero. An OWL value of -1 always indicates a link-level datagram retransmission.
Figure 11 shows OWL experienced by the bulk TCP transfers over (a) the W-LAN and (b) the W-WAN networks during business hours (upper plots) and weekend evening hours (lower plots). Rare packet loss instances can be observed over the W-LAN topology, and a small number of single link-level retransmission instances. Over the W-WAN network, TCP packet loss is more often and periodic with mainly single packet losses, and also instances of two successive packets being dropped. Overall, OWL remains low with a 1.5% loss rate for the business hours experiment and 0.87% for the experiment conducted over the weekend.
Figure 12 and Figure 13 show the unidirectional packet loss experienced by the CBR UDP traffic over the LAN and W-WAN networks, respectively. Again, the upper plots refer to the business hours experiment and lower plots to the weekend experiment. Both the W-LAN and the W-WAN media seem able to accommodate fairly seamlessly the unresponsive UDP traffic at the relatively conservative rates of 1 Mb/s and 20 Kb/s, respectively, since they only experience rare packet drops, with an overall loss rate well below 1%. The only exception occurred during the business hour W-WAN experiment at 20 Kb/s where a burst of packets were dropped mainly at the beginning of the streaming, resulting in an overall loss rate of 6.5%. However, when streaming at 2 Mb/s over the W-LAN topology during business hours, packet loss phenomena raise significantly and successive packet drops of up to 80 datagrams are experienced. The flow exhibits an overall loss rate of 44%. During the weekend experiment, the UDP flow with the same characteristics exhibits an overall loss rate of 19.5% when routed over the W-LAN network. Similar conditions of severe packet loss are experienced for UDP traffic routed over the W-WAN network at a rate of 50 Kb/s. overall packet loss rate reaches 45% during the business hour experiment and 40% during the weekend experiment, respectively.
4.3
On the Relevance of Ping Performance
An additional set of experiments conducted during business hours included the simultaneous generation of 64-byte ICMP echo messages (104-byte IPv6 datagrams) over the instrumented end-to-end paths, in order to examine the relevance of ping RTT indications with respect to the performance experienced by the operational traffic.
Figure 8: UDP One-Way Delay over the W-LAN Network during business hours
Figure 9: One-Way Delay for CBR UDP traffic at 20Kb/s and 50 Kb/s during business hours (W-WAN)
[image:7.595.65.530.501.688.2]Figure 11: TCP Data Loss over (a) W-LAN and (b) W-WAN
Figure 12: CBR UDP Loss at (a) 1Mb/s and (b) 2Mb/s [W-LAN]
[image:8.595.69.525.118.329.2]distribution for each measured characteristic, indicating the main percentiles as well as the variance of the metric. The mean value is also drawn on each boxplot. It can be seen that the mean RTT/2 value lies in both cases between the mean OWD measured for the TCP data and reverse paths, something reasonable given the packet size of the ICMP test traffic. However, neither the mean nor the distribution summary of RTT/2 can adequately estimate the unidirectional contributors of the round-trip time.
Figure 14: OWD for TCP Data and Reverse Paths, and Ping RTT/2 over (a) W-LAN and (b) W-WAN
Figure 15: OWD for UDP Traffic and Ping RTT/2
Figure 15 shows the same comparison of OWD experienced by UDP streaming traffic and ping RTT/2. It is again evident that ping underestimates the OWD contributor of the downlink path of the two topologies. The relevance of RTT/2 to the actual observed phenomenon is arbitrary since its mean value captures 10% and 39% of the mean UDP OWD for the W-LAN and the W-WAN networks, respectively.
The findings of this comparison between OWD measured by the in-line measurement modules and Ping’s RTT/2 are in full accordance with previous studies, which also conclude that dividing the round-trip-time reported by ping in half can yield misleading results in determining unidirectional latencies [17]. Delays in each direction of an end-to-end path can be largely different due to both static components such as asymmetric paths (e.g. GPRS) and dynamically varying components such as temporal resource contention. In addition, administrative policies such as traffic type classification and prioritisation can result in
ICMP control traffic being treated differently by the network forwarding engines.
4.4
Discussion
The end-to-end unidirectional packet delay measured over the two networks for both reliable and unreliable transports shows that, at a microflow level, the OWD distribution changes depending on the packet sizes as well as on the application traffic and network technology. Similar multimodal delay distributions lying within similar value ranges have been observed for bulk TCP transfers over each network during experiments carried at different hours of the day and different days of the week, implying that the network traffic dynamics are not highly variable.
OWD values on the orders of thousands of milliseconds for bulk TCP tansfers observed over the GPRS infrastructure are in agreement with previously published evidence [13]. The TCP goodput measured over the W-LAN network during the weekend experiment when low resource utilisation can safely be assumed indicates interference and significant signal fading [9]. It has been suggested that the throughput of a bulk transfer connection can produce an overestimate of the available bandwidth in the path [11]. During the TCP experiments over W-LAN, this figure remained well below 2Mb/s. This upper bandwidth limit has also been extrapolated by the CBR UDP experiments, where it became apparent that the medium could not handle streaming at 2Mb/s. In contrast to the 1Mb/s streaming experiment, delay increase on the order of hundreds of milliseconds as well as severe packet loss phenomena have been measured. Further investigation using the netstumbler utility [18] verified that a number of experimental W-LAN networks were competing over the same frequency channels during the course of the experiments. This interference caused a decrease on the S/N ratio of our measurement infrastructure resulting in reduced throughput, either due to switching to fallback modes or to increased error rate. This phenomenon was reflected in our measurement results.
[image:9.595.94.249.386.525.2]End-to-end one-way loss measurements revealed that packet losses were relatively rare for TCP flows over the two wireless configurations, and also emphasised the practical capacity limitations of the two media where CBR traffic at 2Mb/s and 50Kb/s respectively saturated the links of the two networks.
5
CONCLUSIONS
In this paper we used a ubiquitous, IPv6-based mechanism to empirically evaluate the end-to-end performance of two different-technology wireless service networks, as this is reflected by the end-to-end one-way delay and packet loss experienced by operational traffic routed over the topologies. The measurements revealed similar one-way delay experienced by bulk TCP traffic irrespective of day-of-the-week for both media, implying no major influences by fluctuations in operational cross-traffic. One-way delay was less predictable for UDP traffic flows, although it still assumed similar values for each medium, at a given bit rate. Packet loss measurements showed that TCP unsurprisingly adapts its transmission and avoids serious losses over both wireless media. Using CBR UDP streaming traffic, we empirically identified some practical capacity limitations of the W-LAN and the W-WAN networks. Streaming traffic at 2Mb/s and 50Kb/s, respectively, proved practically infeasible, due to high packet loss rates.
Future work will investigate through analysis the invariant factors on the studied performance metrics that can be identified between the different media, as well as between different day-of-week experiments. Periodicity and/or repetitiveness effects that are apparent from the descriptive analysis of this paper will be further investigated and analysed. Constant factors and variable components contributing to the end-to-end one-way delay over the two wireless networks will be investigated. An enhanced set of experiments has already been planned to reveal correlations between one-way delay and loss indications during different days of the week. Further experimentation will also focus on assessing the impact of link-level mobility on the performance experienced by the traffic of both W-LAN and W-WAN networks.
6
REFERENCES
[1] Pezaros, D., P., Hutchison, D., Garcia, F., J., Gardner, R., D., Sventek, J., S., In-line Service Measurements: An IPv6-based Framework for Traffic Evaluation and Network Operations, in Proceedings of the 2004 IEEE/IFIP Network Operations and Management Symposium (NOMS’04), Seoul, Korea, April 19-23, 2004
[2] Pezaros, D., P., Network Traffic Measurement for the Next Generation Internet, PhD Thesis, Computing Department, Lancaster University, August 2005
[3] Paxson, V., Towards a Framework for Defining Internet Performance Metrics, The Sixth Annual Conference of the Internet Society (INET'96), Montreal, Canada, June 24-28, 1996
[4] Postel, J., Internet Protocol, IETF Standard, Network Working Group, Request For Comments (RFC) 791, September 1981
[5] Deering, S., Hinden, R., Internet Protocol, Version 6 (IPv6) Specification, IETF Network Working Group, Request For Comments (RFC) 2460, December 1998
[6] Kotz, D., Essien, K., Analysis of a Campus-wide Wireless Network, in Proceedings of the Eighth Annual Conference
on Mobile Computing and Networking (MobiCom’02), September 23-28, Atlanta, Georgia, USA, 2002
[7] MSRL – Mobile-IPv6 Systems research Lab”. Project funded by Cisco Systems, Microsoft Research (Cambridge), and Orange Ltd, Lancaster University, 2001
[8] Vasudevan, V., Parikh, M., Chandra, K., Thompson, C., TCP and IEEE 802.11b Protocol Performance in Indoor Wireless Channels, in Proceedings of IEEE Sarnoff Symposium, New Jersey, March 2003
[9] Heusse, M., Rousseau, F., Berger-Sabbatel, G., Duda, A., Performance Anomaly of 802.11b, in Proceedings of IEEE INFOCOM, San Francisco, March-April 2003
[10]Moon, S., B., Skelly, P., Towsley, D., Estimation and Removal of Clock Skew from Network Delay Measurements, in Proceedings of IEEE INFOCOM, New York, NY, March 21-25, 1999
[11]Jain, M., Dovrolis, C., End-to-End Available Bandwidth: Measurement Methodology, Dynamics, and Relation with TCP Throughput, ACM SIGCOMM’02, Pittsburgh, USA, August 19-23, 2002
[12]Choi, B., Moon, S., Zhang, Z., Papagiannaki, K., Diot, C., Analysis of Point-to-Point Packet Delay in an Operational Network, in Proceedings of IEEE INFOCOM’04, Hong Kong, March 7– 11, 2004
[13]Chakravorty, R., Cartwright, J., Pratt, I., Practical Experience with TCP over GPRS, in Proceedings of the IEEE Global Communications Conference (IEEE GLOBECOM’02), Taipei, Taiwan, R.O.C., November 17-21, 2002
[14]Claffy, K., C., Miller, G., Thompson, K., The Nature Of The Beast: Recent Traffic Measurements From An Internet Backbone, The Eighth Annual Conference of the Internet Society (INET'98), Geneva, Switzerland, July 21-24, 1998 [15]Fraleigh, C., Moon, S., Lyles, B., Cotton, C., Khan, M.,
Moll, D., Rockell, R., Seely, T, Diot, C., Packet-Level Traffic Measurements from the Sprint IP Backbone, IEEE Network Magazine, Volume 17 , Issue 6 , pp. 6-16, November-December 2003
[16]Meyer, M., TCP Performance over GPRS, in Proceedings of the IEEE Wireless Communications and Networking Conference (WCNC'99), New Orleans, Louisiana, U.S.A., September 1999
[17]Claffy, K., C., Polyzos, G., C., Braun, H-W., Measurement Considerations for Assessing Unidirectional Latencies, Journal of Internetworking, Volume 4, Number 3, January 1993
[18]Netstumber, http://www.netstumbler.com/
[19]Joo, Y., Ribeiro, V., Feldmann, A., Gilbert, A., C., Willinger, W., On the Impact of Variability on the Buffer Dynamics in IP Networks, 37th Annual Allerton Conference on Communication, Control and Computing, September 1999


![Figure 13: CBR UDP Loss at (a) 20Kb/s and (b) 50Kb/s [W-WAN]](https://thumb-us.123doks.com/thumbv2/123dok_us/7985864.758015/8.595.61.528.118.733/figure-cbr-udp-loss-kb-kb-w-wan.webp)

