Early Prediction of Students Performance using Machine
Learning Techniques
Anal Acharya,
Department of Computer Science, St Xavier’s College, Kolkata,
India.
Devadatta Sinha,
Department of Computer Science and Engineering, University of Calcutta, Kolkata,
India.
ABSTRACT
In recent years Educational Data Mining (EDM) has emerged as a new field of research due to the development of several statistical approaches to explore data in educational context. One such application of EDM is early prediction of student results. This is necessary in higher education for identifying the “weak” students so that some form of remediation may be organized for them. In this paper a set of attributes are first defined for a group of students majoring in Computer Science in some undergraduate colleges in Kolkata. Since the numbers of attributes are reasonably high, feature selection algorithms are applied on the data set to reduce the number of features. Five classes of Machine Learning Algorithm (MLA) are then applied on this data set and it was found that the best results were obtained with the decision tree class of algorithms. It was also found that the prediction results obtained with this model are comparable with other previously developed models.
General Terms
E-Learning, Classification, Machine Learning.
Keywords
Educational Data Mining, College Education, Machine Learning, Result Prediction, Kappa Statistic, F-Measure, WEKA.
1. INTRODUCTION
In any form of higher education it is necessary to predict a student‟s academic performance [1,2]. There are two reasons for this: it is essential to identify which set of students would do well in semester end examination so that they can be awarded scholarships and more importantly to identify the students who may fail in semester end examinations so that some form of remediation may be offered to them. The academic performance of students depends on several factors; some of these are previous academic records, economic status, family background, performance in mid semester examinations etc. Based on these factors, classification models using MLAs can be constructed which can predict student results. Various classes of MLAs [3] have been used by the researchers for this purpose. These include Decision Trees (DT), Bayesian Networks (BN), Artificial Neural Networks (ANN), Support Vector Machines (SVM) to name a few.
As hinted above several studies have been done by researchers to predict the academic performance of students in various examinations. These include higher secondary, graduation, post graduation, engineering as well as medical courses. Predictions have been done for traditional university courses as well as distance learning courses. For Web based learning courses [5] this type of study attains a higher degree of significance due to the lack of face to face interaction between the student and the instructor. In such cases MLAs are applied on student data generated from “system logs” for predicting student results. Varied degrees of success have
been reported by the researches in terms of prediction accuracy in all these fields while constructing these models. Brief report on some of these works is next discussed. Thai Nghe et al[3] has used DT and BN classes of MLAs for predicting the undergraduate and post graduate results of two universities in Thailand. The total number of student records used for this prediction is 20492 and 932 respectively. Algorithms used for this prediction are C4.5, MSP and Naïve Bayes. They concluded that for all classes of predictions DT yields better results than BN by 3 to 12%. Resampling was used to improve the prediction accuracy.
Kotsiantis et al [4] described a model to predict student results for a distance learning course in Hellenic Open University. Predictions were done on the basis of marks obtained in written assignments. The algorithms used for this prediction are C4.5, Naïve Bayesian Network (NBN), Back Propagation (BP), 3-Nearest Neighborhood (3-NN) and Sequential Minimal Optimization (SMO). A set of 510 students of the university was chosen for experimental purpose. It was found that the NBN algorithm generates the best results (accuracy 72.48%).
Ramaswami et al [5] developed a predictive data mining model for student performance to identify the factors causing poor performance in higher secondary examination in Tamil Nadu. A data set for 772 students collected from regular students and school offices were used for this prediction. Algorithm used for this prediction is Chi-Square Automatic Interaction Detection (CHAID) DT. This tree was used to generate a set of decision rules used for predicting student grades. The overall prediction accuracy achieved was 44.69%. Menaei-Bidgoli et al[6] applied data mining algorithms on “logged data” in a educational web based learning system. The system was tested with a data set of 227 students enrolled in a physics course in Michigan State University. Classification was initially performed using Quadratic BN, 1-NN, Prazen Window, Multilayer Perceptron (MLP) and C5.0 DT. It was seen that combining these classifiers increases prediction accuracy. Genetic Algorithms (GA) were further used to improve prediction accuracy by 10%.
Kovacic [7] explores the “socio-demographic” and “study environment” factors that results in student dropout in a polytechnic college in New Zealand. He uses student enrollment data like age, gender, ethnicity for this purpose. The total number of student records used for purpose was 450. Algorithms used for this prediction are CHAID and Classification and Regression Trees (CART). It was found that CART obtained a higher degree of accuracy (60.5%). Based on the results of Confusion Matrix and ROC curve he concluded that decision trees based on enrollment data alone are not sufficient to classify students accurately.
prediction model was constructed from a profile of 1407 students of which 1100 were used for training and 307 were used for testing purpose. The average predictive efficiency for training and test sets were 77% and 68% respectively. Oladhakun et al[9] uses Artificial Neural Network(ANN) to predict academic performance of students in a Engineering course. The effect of the factors like test scores, subject combination, age of admission etc were studied. The model was tested with a set of 112 students from Engineering Department of University of Ibadan, Nigeria. The overall accuracy achieved using this model is 74%.
All these references primarily use MLAs for classifying student data. However applying these algorithms on student data set is not efficient in most circumstances as it contains a large number of features and data records [10]. In this context the objective of this work is as follows:
(i) To identify the attributes and examination pattern of a set of students majoring in Computer Science in some under graduate colleges in Kolkata.
(ii) To perform features selection on this data set to determine the optimal number of features; these features would then be used for classification.
(iii) To apply MLAs on this reduced feature set to identify the students who may perform exceedingly well and more importantly those who may perform poorly.
(iv) To perform a parametric comparison with the contemporary literature discussed above.
In light of this the organization of the paper is as follows. The next section gives a brief overview of the MLAs used in this paper. The following section describes student attribute and data set used in this work along with examination pattern. The results and the inferences are next discussed. Finally a comparative study of this work is done with similar works in relevant literature.
2. MACHINE LEARNING
Machine Learning is the process of learning a set of rules from instances or more generally speaking creating a classifier that can be used to generalize from new instances [11]. Creation of a classifier is a two step process. In the first step the classifier model is constructed using a given data set. This step is called training. In this step classification rules are constructed. The second step called testing determines the accuracy of the classification rules. If the accuracy of the classifier is above an acceptable limit [12] then the classifier model constructed in the first step may be used for classification of new data records. Training the classifier requires the use of MLAs. Choice of algorithm is critical because the accuracy of prediction is often dependent on these algorithms. Over the years several researchers [3,4,5,6,7,8, 9] have used varied MLAs to perform classification in various knowledge domain. In this study five classes of MLAs has been chosen for classification with a representative algorithm from each class. MLAs from five classes are chosen so as to introduce a certain degree of variation among the classifiers, i.e. they should not make identical or correlated errors [13]. The justification behind choosing these MLAs are next discussed.
DT [14] exhibits the capability of modeling complex relationships between variables without strong model assumptions. They also do not need long training time and can thus save modeling time when the data set is huge. C4.5
algorithm is chosen as a representative member of this class. ANN [15] have an excellent capability of self learning and self adapting and have hence been used in a lot of difficult applications like predicting share value, breast cancer to name a few. They are often found to be more efficient and accurate than other classifier techniques. Multi Layer Perceptron (MLP) is chosen as a representative member of this class. BN [16] can achieve relatively good performance on classification task. A representative of this class is Naïve Bayes (NB) classifier which greatly simplifies learning by assuming that features are independent for a given class variable. SVM [17] have lately been used by a lot of researchers in classifying linear as well as non linear data. They have been found to be highly accurate. They are less prone to data over fitting than other methods. On the flip side the training time of even the fastest SVM can be extremely slow. Sequential Minimal Optimization (SMO) is chosen as a representative of this class of MLAs. Finally, Lazy Learners [17] are able to model complex decision spaces that are not easily describable by others MLAs. They naturally support incremental learning. 1-Nearest Neighborhood (1-NN) algorithm is chosen as a representative of this class. These MLAs are used for student result prediction in section 4.
3.
ATTRIBUTE
AND
DATA
SET
DESCRIPTION
The data set for this study is derived from a set of students majoring in Computer Science in some undergraduate colleges in Kolkata. The course curriculum is divided into six semesters. In each semester a student has to appear in two examinations: a mid semester examinations and a term end examination. Since the objective of this study is to perform early prediction of student performance, semester I results are used for prediction purpose. In semester I a student has to appear in three papers : a theory paper of 100 marks and two practical papers of 50 marks each. These are named as TH11, PR11, and PR12 for convenience. Corresponding to each of the three papers data has been collected using a questionnaire prepared from the following sources: (i) Vice Principal‟s office of the related colleges (ii) Faculty members and students of the respective departments (iii) Related literature [3,4,5,6,7,8,9].
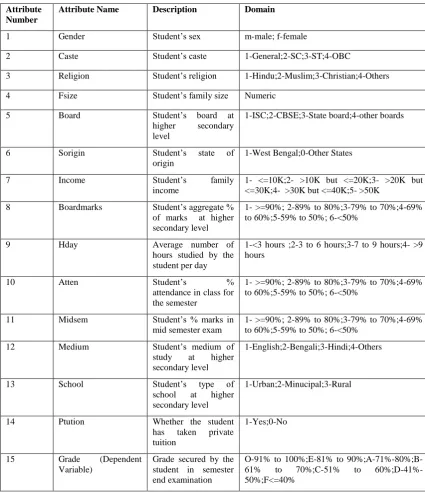
Table 1. Student attributes and their domains
Attribute Number
Attribute Name Description Domain
1 Gender Student‟s sex m-male; f-female
2 Caste Student‟s caste 1-General;2-SC;3-ST;4-OBC
3 Religion Student‟s religion 1-Hindu;2-Muslim;3-Christian;4-Others
4 Fsize Student‟s family size Numeric
5 Board Student‟s board at
higher secondary level
1-ISC;2-CBSE;3-State board;4-other boards
6 Sorigin Student‟s state of
origin
1-West Bengal;0-Other States
7 Income Student‟s family
income
1- <=10K;2- >10K but <=20K;3- >20K but <=30K;4- >30K but <=40K;5- >50K
8 Boardmarks Student‟s aggregate %
of marks at higher secondary level
1- >=90%; 2-89% to 80%;3-79% to 70%;4-69% to 60%;5-59% to 50%; 6-<50%
9 Hday Average number of
hours studied by the student per day
1-<3 hours ;2-3 to 6 hours;3-7 to 9 hours;4- >9 hours
10 Atten Student‟s %
attendance in class for the semester
1- >=90%; 2-89% to 80%;3-79% to 70%;4-69% to 60%;5-59% to 50%; 6-<50%
11 Midsem Student‟s % marks in
mid semester exam
1- >=90%; 2-89% to 80%;3-79% to 70%;4-69% to 60%;5-59% to 50%; 6-<50%
12 Medium Student‟s medium of
study at higher secondary level
1-English;2-Bengali;3-Hindi;4-Others
13 School Student‟s type of
school at higher secondary level
1-Urban;2-Minucipal;3-Rural
14 Ptution Whether the student
has taken private tuition
1-Yes;0-No
15 Grade (Dependent
Variable)
Grade secured by the student in semester end examination
O-91% to 100%;E-81% to 90%;A-71%-80%;B-61% to 70%;C-51% to 60%;D-41%-50%;F<=40%
Needless to say that a student has to pay a large amount of money as fees to the private tutors. It has been noted that students who have performed well in the board exams generally performs well in graduation exams. Another indicator in this regard is student‟s performance in the mid semester exams. The number of hours studied by the student also determines the quality of his academic performance as does his attendance in class.
These attributes are used to predict student grades as a 7 class problem in the semester end examination: in particular grade „O‟ indicates that the student is outstanding and may be awarded scholarship whereas grade „F‟ indicated that the student is poor and hence may need remedial attention. Other grades are suitably defined. The student attributes, prediction variable and their corresponding domain are shown in Table 1 for easy reference.
4. RESULTS AND DISCUSSION
[image:4.595.92.243.304.372.2]The attribute set shown in Table 1 contains 14 independent attributes and one dependent attribute used for prediction. Classifying data with such a large attribute set may lead to several disadvantages [10]: high computational complexity, poor model interpretability and high data over fitting that would reduce generalization. Acharya and Sinha [18] have performed a detailed study on the effect of several Filter and Wrapper based feature selection techniques on DS1. Three filter based methods used were Correlation Based Feature Selection (CBFS), Chi-Square Based Feature Evaluation (CBFS) and Information Gain Attribute Evaluation (IGATE). Wrapper based feature selection methods use learning algorithms for selection of features. Three learning algorithms used were C4.5, Naïve Bayes and 1-Nearest Neighborhood. They found that CBFS algorithm with 8 features gives the best classification results. To ensure uniformity CBFS algorithm with highest ranked 8 features has been selected for applying classifier in each of the three papers (TH11, PR11, and PR12). The features selected are shown in Table 2.
Table 2: Features selected for three papers for DS1.
Papers Features Selected
TH11 7,5,12,8,3,11,13,2 PR11 2,3,5,7,8,11,12,13 PR12 7,11,8,5,3,10,2,13
[image:4.595.47.290.545.711.2]Again to ensure uniformity the same set of features are used for DS1 as well as DS2. As discussed in the previous section five MLAs from 5 classes are chosen (C4.5, MLP, NB, 1-NN, SMO) for predicting student results. In continuation of [18] two parameters [17] are used to determine the degree of predictive accuracy: Kappa statistic and F-Measure. Kappa statistic measures the agreement of prediction with true class: a value of 1.0 signifies complete agreement. F-measure is a combination of Precision and Recall parameters. Again in continuation to [18] the experiments for this paper have been conducted in WEKA (Waikato Environment for Knowledge Analysis) which is free software [19] written in Java for data analysis and predictive modeling. The values of Kappa Statistic and F-Measure corresponding to the MLAs for DS1 and DS2 are shown in Tables 3,4,5,6 respectively.
Table 3: F-Measure corresponding to DS 1
C4.5 MLP NB 1NN SMO
TH11 0.75 0.70 0.66 0.67 0.76
PR11 0.78 0.72 0.67 0.71 0.78
PR12 0.83 0.73 0.70 0.72 0.81
Table 4: Kappa Statistic corresponding to DS 1
C4.5 MLP NB 1NN SMO
TH11 0.75 0.65 0.64 0.61 0.77
PR11 0.80 0.74 0.71 0.68 0.78
PR12 0.81 0.80 0.74 0.73 0.79
Table 5: F-Measure corresponding to DS 2
C4.5 MLP NB 1NN SMO
TH11 0.66 0.55 0.55 0.60 0.65
PR11 0.65 0.59 0.61 0.58 0.66
PR12 0.67 0.63 0.60 0.61 0.70
Table 6: Kappa Statistic corresponding to DS 2
C4.5 MLP NB 1NN SMO
TH11 0.68 0.57 0.57 0.52 0.67
PR11 0.70 0.62 0.62 0.58 0.68
PR12 0.71 0.69 0.64 0.63 0.69
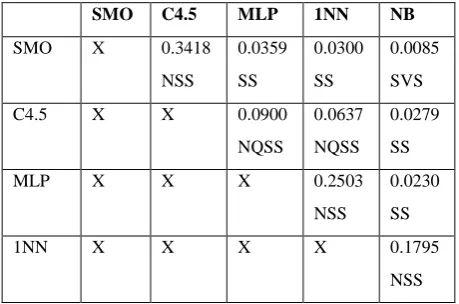
Clearly the best results are obtained by the SMO algorithm closely followed by C4.5. MLP gives mediocre results followed by 1NN and NB algorithms. To further analyze the effect these algorithms on DS1 and relationship between them paired t-test is applied. This test is used to determine the degree of significance between the Kappa statistic and F-measure values pair wise among the values shown in Tables 3,4,5,6. The degree of significance determined by the p-value is grouped into four categories: Not Statistically Significant (NSS), Not Quite Statistically Significant (NQSS), Statistically Significant (SS), and Statistically Very Significant (SVS). These results corresponding to DS1 for F-Measure and Kappa Statistic are shown in Tables 7 and 8. From Table 7 it is found that the difference in F-Measure for SMO and C4.5 MLAs is NSS. The difference between SMO and MLP/1NN are SS whereas the difference between SMO and NB is SVS. Similarly the difference between C4.5 and MLP/1NN are NQSS whereas the difference between C4.5 and NB is SS.
[image:4.595.314.544.617.769.2]From Table 8 it follows that the difference in Kappa Statistic for C4.5 and SMO/MLP MLAs is NSS. The difference between C4.5 and NB is NQSS. The difference between SMO and MLP is NQSS whereas the difference between SMO and NB/1NN is SS. Thus it may be concluded without a shadow of doubt that the NB MLA displays the worst performance. 1NN and MLP algorithm performs just slightly better. However as displayed in Tables 7 and 8 the difference between them is marginal. SMO and C4.5 performs much better than these three MLAs. However within themselves the difference is NSS.
Table 7: Paired t-test results for F-Measure values of DS1
SMO C4.5 MLP 1NN NB
SMO X 0.3418
NSS
0.0359 SS
0.0300 SS
0.0085 SVS
C4.5 X X 0.0900
NQSS
0.0637 NQSS
0.0279 SS
MLP X X X 0.2503
NSS
0.0230 SS
1NN X X X X 0.1795
Table 8: Paired t-test results for Kappa Statistic values of DS1
C4.5 SMO MLP NB 1NN
C4.5 X 0.6633
NSS
0.1126 NSS
0.0512 NQSS
0.0280 SS
SMO X X 0.0898
NQSS
0.0350 SS
0.0156 SS
MLP X X X 0.4405
NSS
0.2641 NSS
NB X X X X 0.3458
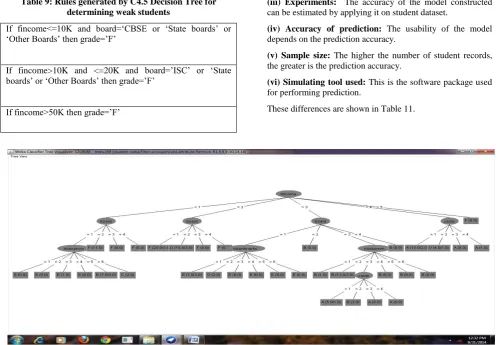
[image:5.595.50.283.93.248.2]NSS Thus either one of these may be used for generation of production rules for predicting student performance. Similar results are observed when paired t-test is applied on DS2. Since the difference between C4.5 and SMO is NSS, C4.5 is used for generation of production rules. There are several reasons [9] for this: Firstly, DTs can be easily understood and interpreted. Secondly, they can easily be converted to a set of production rules and can classify both numerical as well as categorical data. Fig 1 shows a WEKA snap shot of the DT obtained by applying C4.5 MLA on DS2 for the paper TH11. It shows that the most important attribute in determining student grade is Family Income. Decision rules for determining student grades can easily be derived from these. Tables 9 and 10 shows the production rules derived from Fig 1 for identifying weak and outstanding students respectively.
Table 9: Rules generated by C4.5 Decision Tree for determining weak students
If fincome<=10K and board=„CBSE or „State boards‟ or „Other Boards‟ then grade=‟F‟
If fincome>10K and <=20K and board=‟ISC‟ or „State boards‟ or „Other Boards‟ then grade=‟F‟
If fincome>50K then grade=‟F‟
Table 10: Rules generated by C4.5 Decision Tree for determining outstanding students
If fincome>20K and <=30K and board=‟ISC‟ and boardmarks<90% and >80% then grade=‟O
If If fincome>30K and <=40K and caste=‟SC‟ then grade=‟O‟
5.
COMPARATIVE
STUDY
WITH
CONTEMPORARY LITTERATURE
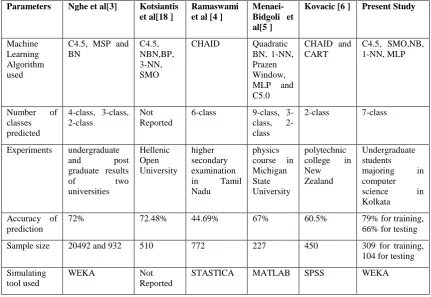
As discussed in Section 1, several researchers [3,4,5,6,7,8,9] have already used MLAs to predict student results. Some of these are reported in section 1. A notable difference between those works and current work is that here feature selection is explored in detail [18] before performing classification. Various models developed may be farther compared on the basis of the following parameters:
(i) Machine Learning Algorithm used: Several classes of MLAs have been used by different researchers like Decision Trees, Bayesian Networks, Neural Networks, Support Vector Machines etc.
(ii) Number of classes predicted: This gives the number of categories in to which data is to be classified. For example, 6-class indicates that students are 6-classified into 6 categories. (iii) Experiments: The accuracy of the model constructed can be estimated by applying it on student dataset.
(iv) Accuracy of prediction: The usability of the model depends on the prediction accuracy.
(iii) Experiments: The accuracy of the model constructed can be estimated by applying it on student dataset.
(iv) Accuracy of prediction: The usability of the model depends on the prediction accuracy.
(v) Sample size: The higher the number of student records, the greater is the prediction accuracy.
(vi) Simulating tool used: This is the software package used for performing prediction.
These differences are shown in Table 11.
[image:5.595.48.547.414.759.2]Table 11: Comparison with related works
Parameters Nghe et al[3] Kotsiantis et al[18 ]
Ramaswami et al [4 ]
Menaei-Bidgoli et al[5 ]
Kovacic [6 ] Present Study
Machine Learning Algorithm used
C4.5, MSP and BN
C4.5, NBN,BP, 3-NN, SMO
CHAID Quadratic BN, 1-NN, Prazen Window, MLP and C5.0
CHAID and CART
C4.5, SMO,NB, 1-NN, MLP
Number of classes predicted
4-class, 3-class, 2-class
Not Reported
6-class 9-class, 3-class, 2-class
2-class 7-class
Experiments undergraduate and post graduate results
of two
universities
Hellenic Open University
higher secondary examination in Tamil Nadu
physics course in Michigan State University
polytechnic college in New Zealand
Undergraduate students majoring in computer science in Kolkata
Accuracy of prediction
72% 72.48% 44.69% 67% 60.5% 79% for training,
66% for testing
Sample size 20492 and 932 510 772 227 450 309 for training,
104 for testing Simulating
tool used
WEKA Not
Reported
STASTICA MATLAB SPSS WEKA
6. CONCLUSION
The aim of this paper is to apply MLAs for prediction of student results. For this purpose a suitable representative from five classes of MLA were first trained and then tested. They were found to yield useful results. Educators are thus in a position to identify the outstanding and more importantly students who may perform poorly in the term end examination. The attributes and data set are derived by surveying a group of students majoring in Computer Science in some undergraduate colleges in Kolkata. It is to be noted that the developed research methodology is general in nature: it could be applied to full time as well as distance education courses including the courses where web based learning is used.
The training set contains 309 instances whereas the testing set contains 104 instances. After detailed analysis it was found that DTs are the most convenient algorithm to generate the set of production rules. Accordingly, C4.5 was used to generate the decision tree. F-Measure and Kappa Statistic were used to determine the efficiency of the prediction algorithm. Average F-Measure value for the training dataset was found to be 0.79 whereas for the testing dataset was found to be 0.66. The later value seems to be slightly low perhaps due to the fact that the number of testing instances is only 104. Similar results are shown by Kappa Statistic also.
The research methodology proposed in this paper could be improved on several accounts. Firstly, grade „F‟ has been allotted to the students who secures less than 40% marks. Thus no distinction is made between the students who secure 38% marks and those who secure 10% marks. Secondly, several students take admission in a course, appear in the mid semester exams but due to certain reason are unable to appear in the term end exams. These students are not considered for prediction as they contain missing attribute. Finally, the
efficiency of prediction may be increased by Combining Multiple Classifiers (CMC). Genetic algorithms may also be applied for this purpose.
7. REFERENCES
[1] Romero, C. and Ventura, S.2007, Educational data mining: A survey from 1995 to 2005, Expert Systems with Applications, 135–146.
[2] Castro, F., Vellido, T., Àngela Nebot, and Mugica F., Applying Data Mining Techniques to e-Learning Problems.
[3] Nguyen, N. N., Janeck, P, Haddawy, P., 2007, A Comparative Analysis of Techniques for Predicting Academic Performance, 37th ASEE/IEEE Frontiers in Education Conference.
[4] Kotsiantis, S., Piarrekeas, C., Pintelas, P.,2007. Predicting Students‟ performance in Distance Learning using Machine Learning Techniques, Applied Artificial Intelligence, 18:411-426.
[5] Ramaswami, M., Bhaskaran, R.,2010, A CHAID Based Performance Prediction Model in Educational Data Mining, International Journal of Computer Science Issues, Vol. 7, Issue 1, No. 1.
[6] Minei-Bidgoli, B., Kashy, D., Kortemeyer G., Punch W F, 2003. Predicting Student Performance: An Application of Data Mining Methods with the Educational Web-Based System LON-CAPA, 33rd ASEE/IEEE Frontiers in Education Conference,. [7] Kovacic, Z. J.,2007, Early Prediction of Student Success:
[8] Karamouzis, S., and Vrettos, A, 2008, An Artificial Neural Network for Predicting Student Graduation Outcomes, Proceedings of the World Congress on Engineering and Computer Science , San Francisco, USA.
[9] Oladukun, V. O., Adebanjo, A. T., Charles-Obawa, O. E., Predicting Students‟ Academic Performance using Artificial Neural Network: A Case Study of an Engineering Course.
[10] Dash, M., Liu H.,1997, Feature Selection for Classification, Intelligent Data Analysis, 131–156. [11] Kotsiantis S. B., 2007, Supervised Machine Learning: A
Review of Classification Techniques, Informatica 31, 249-268.
[12] Haan, J., Kamber M., Data Mining-Concepts and Techniques, Third Edition, Elsivier.
[13] Ali, S., Smith K.,2006, On learning algorithm selection for classification, Applied Soft Computing 6, 119–138. [14] Domingos, P,. A Few Useful Things to Know about
Machine Learning,.
[15] Livieris, E., Drakopoulou, E., Pintelas, P., Predicting students' performance using artificial neural networks. [16] Stefanowski, J., An Experimental Study of Methods
Combining Multiple Classifiers - Diversified both by Feature Selection and Bootstrap Sampling.
[17] Zhao, Y., and Zhang, Y.,Comparison of decision tree methods for finding active objects
[18] Acharya, A., Sinha, D., 2014, Application of Feature Selection Methods in Educational Data Mining , International Journal of Computer Applications 103(2):34-38.