1
THE MULTI-DIMENSIONAL ANALYSIS OF
SOCIAL EXCLUSION
BY
Ruth Levitas, Christina Pantazis, Eldin Fahmy, David Gordon,
Eva Lloyd and Demi Patsios
Department of Sociology and School for Social Policy
Townsend Centre for the International Study of Poverty
and
Bristol Institute for Public Affairs
University of Bristol
January 2007
Views expressed in this report are not necessarily those of the Social Exclusion
Task Force or any other government department.
2
CONTENTS
List
of
tables
and
figures 4
List of abbreviations
5
Acknowledgements
8
Executive Summary
9
Chapter One
Background and
Introduction 13
Chapter Two
Concepts and Definitions of Social Exclusion
18
conceptualising
social
exclusion
18
deep exclusion
25
Chapter Three
From Concepts to Indicators
32
single
indicator
sets
32
children
38
young people
43
working age adults
47
later life
49
additional
indicator
sets
51
Chapter Four
Survey Analyses of Social Exclusion
55
Millennium Survey of Poverty and
Social
Exclusion
55
British
Household
Panel
Survey
68
Families
and
Children
Study
78
English
Longitudinal
Study
of
Ageing
80
Chapter Five
Devising and Applying the Bristol Social
86
Exclusion Matrix (B-SEM)
the matrix
86
applying the B-SEM to survey data sets
96
administrative
sources
105
Chapter
Six
Conclusions
and
Recommendations
117
further
research
118
survey
data
120
administrative
data
125
3
Appendix 1
Opportunity For All Indicators 2005
128
Appendix 2
Monitoring Poverty and Social Exclusion
131
Indicators
Appendix
3
Index
of
Multiple
Deprivation
135
Appendix 4
Audit Commission Quality of Life Indicators
138
Appendix 5
Proportion of the population perceiving items or
141
activity
as
necessary
Appendix 6
A Survey of Surveys
Appendix 7
Applying the B-SEM
Appendix 8
Statistical analyses of social exclusion indicators
4
List of tables and figures
Tables
2.1 Definitions of social exclusion or inclusion
3.1 Harmonised indicators of social exclusion adopted by the EU in 2001 3.2 Proposed European indicators of social exclusion (Atkinson indicators) 4.1 Association between social exclusion and other dimensions of exclusion
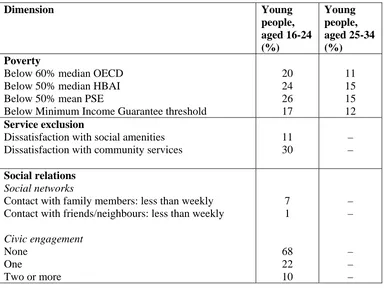
4.2 Percentage of young people excluded using the PSE approach, on a selected number of indicators
4.3 Percentage of pensioner households excluded using the PSE approach 5.1 Major cross-sectional surveys used in the application of B-SEM 5.2 Major panel/cohort surveys used in the application of B-SEM
Figures
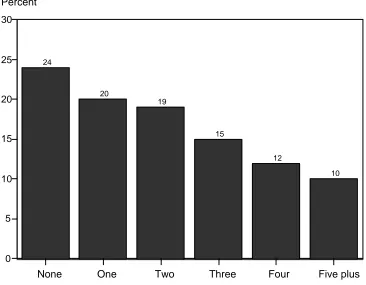
4.1 Number of indicators of social exclusion and poverty reported by PSE respondents, out of a possible eight
5
List of abbreviations
ACORN A Classification of Residential Neighbourhood ALSPAC Avon Longitudinal Study of Parents and Children
ADMID administrative data sets for measuring impact on disadvantage APS Annual Population Survey
ASBO Anti-Social Behaviour Order
ASHE Association for the Study of Higher Education BCS70 British Cohort Study 1970
BHPS British Household Panel Survey BMA British Medical Association B-SEM Bristol Social Exclusion Matrix CAB Citizens Advice Bureau
CAPI computer-assisted personal interviewing CASI computer-assisted self-interviewing
CDRP Crime and Disorder Reduction Partnership CJS Criminal Justice System
CMPO Centre for Market and Public Organisation CRSP Centre for Research in Social Policy CSV Community Service Volunteers
DCLG Department for Communities and Local Government DCMS Department of Culture, Media and Sport
DfES Department for Education and Skills DfT Department for Transport
DH Department of Health
DTI Department of Trade and Industry DWP Department for Work and Pensions ECHP European Community Household Panel EFS Expenditure and Food Survey
ELSA English Longitudinal Study of Ageing ESRC Economic and Social Research Council FACS Families and Children Study
FRS Family Resources Survey GHQ General Health Questionnaire GHS General Household Survey GLM General Linear Model
GSS Government Statistical Service GWR geographical weighted regression HBAI Households Below Average Income
HEFCE Higher Education Funding Council for England HESA Higher Education Statistics Agency
6 ISEW Index of Sustainable Economic Welfare
JCSHR Joint Centre for Scottish Housing Research JRF Joseph Rowntree Foundation
JUVOS Joint Unemployment and Vacancies Operating System LFS Labour Force Survey
LLFS Local Labour Force Survey
LSE-CASE Centre for the Analysis of Social Exclusion at the London School of Economics and Political Science
LSYPE Longitudinal Study of Young People MAR missing at random
MAUP modifiable areal unit problem MDP Measure of Domestic Progress MUD moral underclass discourse
NAPincl national action plan on social inclusion NatCen National Centre for Social Research NCDS National Child Development Study NDS National Data Strategy
NEF New Economics Foundation NES New Earnings Survey
NeSS Neighbourhood Statistics Service
NFER National Foundation for Educational Research NINOs National Insurance numbers
NPD National Pupil Dataset NPI New Policy Institute
NS-SEC National Statistics socioeconomic class NS-SEG National Statistics socioeconomic group OCJS Offending, Crime and Justice Survey ODPM Office of the Deputy Prime Minister OLS ordinary least squares
ONS Office for National Statistics PLASC Pupil Level Annual School Census PLUG PLASC/NPD User Group
PSA Public Service Agreement
PSE Survey Millennium Survey of Poverty and Social Exclusion RED redistributive
SARs Samples of Anonymised Records SEH Survey of English Housing
SEU Social Exclusion Unit
SID social integrationist approach SLFS Scottish Labour Force Survey SPLS Supporting People Local System
7 UCAS Universities and Colleges Admissions Service
WLFS Welsh Labour Force Survey
8
Acknowledgements
9
Executive summary
The purpose of this project was to review existing sources on multi-dimensional disadvantage or severe forms of social exclusion characterised as ‘deep exclusion’; to recommend possibilities for secondary analysis of existing data sets to explore the dynamics of ‘deep exclusion’; to identify any relevant gaps in the knowledge base; and to recommend research strategies for filling such gaps.
The first task was to define social exclusion and deep exclusion and to identify the appropriate ‘dimensions’ contributing to multi-dimensional disadvantage. A working definition of social exclusion was adopted after exploration of the wide range available in the literature:
Social exclusion is a complex and multi-dimensional process. It involves the lack or denial of resources, rights, goods and services, and the inability to participate in the normal relationships and activities, available to the majority of people in a society, whether in economic, social, cultural or political arenas. It affects both the quality of life of individuals and the equity and cohesion of society as a whole.
‘Social exclusion’ itself is universally regarded in the academic and policy literature as involving multi-dimensional disadvantage. ‘Deep exclusion’ cannot therefore be clearly differentiated from social inclusion on this basis. However, there are degrees of severity of social exclusion. Severe or deep exclusion was therefore defined as follows:
Deep exclusion refers to exclusion across more than one domain or dimension of disadvantage, resulting in severe negative consequences for quality of life, well-being and future life chances.
Although there are several indices relating to social exclusion and related matters, many of these are principally descriptive and do not allow for analysis of interacting variables. The multivariate analysis that has been done on social exclusion is of variable quality and is inconsistent in the definitions of social exclusion and the domains and indicators used.
10 greater vulnerability of a category of individuals, and triggers which have a direct causal impact.
A matrix of appropriate domains and topic areas was constructed looking across four stages of the life course: childhood, youth, working-age adulthood and later life. This matrix, the Bristol Social Exclusion Matrix, or B-SEM, contains 10 dimensions or domains of potential importance in social exclusion:
Resources: Material/economic resources
Access to public and private services Social resources
Participation: Economic participation Social participation
Culture, education and skills Political and civic participation Quality of life Health and well-being
Living environment
Crime, harm and criminalisation
The interactive nature of social exclusion means that these domains and topics are often both outcomes and risk factors. The substantive coverage and the methodological adequacy of a range of data sets was then assessed. While there is a great deal of data collected on aspects of disadvantage in existing surveys and administrative data sets, very few cover the range of aspects of multiple disadvantage or social exclusion included in the B-SEM.
Some people most at risk of social exclusion are omitted entirely from household surveys. They include all of the population living in institutions, such as some children in local authority care or in young offenders’ institutions; disabled children in residential care; disabled adults; those hospitalised or in prison; older people in residential care; and some asylum seekers, notably those in holding institutions. Homeless people are also missed by household surveys. Other groups are under-represented in household surveys, including some of those most vulnerable to social exclusion, such as some minority ethnic groups, those on low incomes and residentially mobile populations including travellers.
11 investigate the dynamics of social exclusion in vulnerable groups excluded from or underrepresented in household surveys.
The best existing surveys for secondary analysis of multi-dimensional disadvantage were identified as: Families and Children Study (FACS); British Household Panel Survey (BHPS); English Longitudinal Study of Ageing (ELSA); General Household Survey (GHS); Millennium Survey of Poverty and Social Exclusion (PSE Survey); Avon Longitudinal Study of Parents and Children (ALSPAC). For young people, the best sources are the cohort studies initiated in 1958, 1970 and 2000. The Longitudinal Study of Young People (LSYPE) is likely to become an important addition although meaningful results for this group will not become available for some years. Pooled data from the GHS is also a useful source for looking at social exclusion among young people.
A new household survey, the UK Longitudinal Household Survey (UKLHS), is under construction that will have a sample size of 40,000 and is expected to generate data from 2008. Steps should be taken to ensure there are appropriate questions on social exclusion.
Administrative data sources may be considered as an alternative to survey data. Two major reports, Pleace and Bretherton (2006) reporting for the DWP and Jones and Elias (2006), reporting for the NDS, have recently been published. Both note the potential advantages of linking administrative data sources, or linking them to survey data, but both raise issues of data quality as well as ethical and legal issues in the use of such data, and questions of public trust.
Recommendations
1. We recommend secondary analysis using B-SEM to identify appropriate domains and indicators of the surveys listed above.
2. The PSE Survey has the most extensive coverage of social exclusion. We recommend repeating an improved version of the PSE Survey with a larger sample size and an ethnic booster. If possible we would recommend re-contacting the households in the original survey to provide a longitudinal element.
3. We recommend the generation of a ‘Social Exclusion Module’ based on the B-SEM for inclusion in the future UKLHS (or in the BHPS or GHS).
12 exclusion, especially those who are excluded from or under-represented in household surveys. Such qualitative work should use biographical methods to explore the experience of social exclusion and the nature and sequence of precipitating events and events and interventions that reduce or prevent exclusion.
5. We recommend that the findings from this qualitative workbe used where possible to inform specialised surveys of social exclusion among the non-household population.
There are also changes that could be made to existing data collection practices that would improve the adequacy of existing data in relation to measuring social exclusion:
6. We recommend that more consideration is given to the use of ethnic and other boosters in existing survey research to improve the overall usefulness of these sources. 7. We recommend that a religious variable be routinely included in surveys, and that
administrative data such as IMD (Index of Multiple Deprivation) scores are also added to existing surveys.
8. We recommend that the UKLHS builds on BHPS best practice and includes a children’s cohort. In general, we recommend that more survey research collects data directly from children, with the age of respondents taken as far down as possible, certainly from about seven years of age.
9. In view of the inconsistent use of age categories in relation to young people, we recommend the more consistent application of the United Nations 16-24 age boundaries.
10.We recommend that in future sweeps of ELSA a sample for Wales be included. 11.We recommend further consideration of the use of administrative data. However, in
13
Chapter one
Background and introduction
The incoming Labour government made social exclusion a key policy issue in 1997. The Social Exclusion Unit (SEU) was set up to provide a cross-departmental approach to the complex problems of specific groups, initially focusing on rough sleepers, truancy and school exclusion, teenage pregnancy and young people not in education, employment or training. The SEU defined social exclusion as:
… a shorthand term for what can happen when people or areas suffer from a combination of linked problems such as unemployment, poor skills, low incomes, poor housing, high crime environments, bad health and family breakdown.
This definition, albeit impressionistic, captures the multi-dimensional character of the problem the government sought to address. But the effectiveness of government policy in this crucial area cannot be assessed without appropriate data, raising the issue of relevant indicators of social exclusion. Debate in 1998-99 in academic, policy and think-tank circles resulted in the production of two sets of indicators from existing statistics, the New Policy Institute’s (NPI) Poverty and Social Exclusion in Britain and the government’s own Opportunity for All series. The government also made a commitment to abolish child poverty, with specific interim targets.
The European Union also put poverty and social exclusion at the heart of its social policy at the Lisbon Summit in 2000, with specific criteria set out at Nice in 2001, together with a requirement that each member state produce a biennial national action plan on social inclusion (NAPincl). The Nice criteria include a specific reference to addressing vulnerable groups at particular risk of exclusion. The EU has also produced a package of ‘primary’ and ‘secondary’ indicators of exclusion, while suggesting that appropriate ‘tertiary’ indicators be developed at national level. The UK had already done much of this work, and was able to draw extensively on the Opportunity for All reports in the 2001 NAPincl, and subsequently to build on these.
14 production of individual indicators – although both the NPI and Opportunity for All report the origins and robustness of each indicator. Two main quantitative studies in the UK have tried to overcome these problems, and to (a) move from the definition of social exclusion to measurement and (b) examine the interaction of different dimensions of social exclusion. They are the secondary analysis of the British Household Panel Survey (BHPS) undertaken by Burchardt and colleagues (Burchardt, 2000; Burchardt et al, 2002) at the Centre for the Analysis of Social Exclusion at the London School of Economics and Political Science (LSE-CASE), and the Rowntree-funded Millennium Survey of Poverty and Social Exclusion in Britain (PSE Survey), carried out in 1999 (Gordon et al, 2000; Pantazis et al, 2006).
Miliband (2006) recommends thinking about social exclusion in three ways: wide, deep and concentrated exclusion. Wide exclusion refers to the large number of people excluded on a single or small number of indicator(s). Concentrated exclusion refers to the geographic concentration of problems and to area exclusion. Deep exclusion refers to those excluded on multiple and overlapping dimensions. The purpose of this piece of research is to examine the scope for looking at the interaction of factors in social exclusion, and specifically in ‘deep exclusion’ or multiple disadvantage, using existing databases.
To make sure current information bases are fully exploited we need to explore the potential for additional secondary analysis of existing data sets. Assessment of the specialised data sets that have already been used to explore social exclusion is crucial. A range of general and specialised surveys, both cross-sectional and longitudinal, could potentially add to our knowledge in this field, as could some administrative data. The first task is to look at the range of quantitative data available, primarily in England and Wales, and to establish what could be used to measure the interaction of multiple factors in deep exclusion. The second task is to set out a range of options for future research, which might include adaptation or secondary analysis of existing data sets and/or the use of new specialised surveys or qualitative research to help define appropriate policy intervention in relation to ‘deep exclusion’. The stages of the research were therefore set out as follows:
15 the development of European indicators; those informing quantitative research such as the PSE Survey and LSE-CASE; and those current in the wider academic literature.
2. Clarify the possible meaning of deep exclusion in relation to these frameworks.
3. Construct an indicative social exclusion matrix identifying the principal domains and dimensions of social exclusion, and topic areas within these. The UK government typically commissions about 20 social surveys each year. Many of these surveys contain key information pertinent to the study of social exclusion. It would be possible ultimately to develop a searchable meta-database on social exclusion that documents relevant survey data sources, question items and associated information (for example, sampling methods, coverage etc). The Office for National Statistics (ONS) has successfully applied this approach in the development of the ONS social capital survey matrix. The topics in a comparable social exclusion matrix should be sensitive to the possible different character of social exclusion at different stages of the life course, childhood, youth, working age and later life.
4. Identify the data sets to be addressed, including a range of repeat cross-sectional surveys, longitudinal surveys and one-off surveys, and both general surveys across the household population (such as the General Household Survey or GHS), and those targeted at particular groups (such as the Families and Children Study or FACS). Key sources are the BHPS and PSE, since these are the primary sources that have been used to analyse ‘social exclusion’ across the population as a whole. Administrative data sets might also be useful.
16
6. Consolidate the results of this detailed investigation and consider which research strategies and which studies best estimate and/or track multi-dimensional exclusion, and what scope there is for further secondary analysis of existing data using multivariate techniques.
7. Identify gaps in the knowledge base, and make recommendations for further research.
The organisation of this report follows the same logic as the original research framework. Chapters Two to Four explore the main definitions of and approaches to social exclusion, and the indicators hitherto used in its measurement. This review is used to derive operational definitions of ‘social exclusion’ and ‘deep exclusion’ at the individual or household level. An operational definition is one that is theoretically and practically amenable to measurement either directly or by use of a proxy indicator. The relevant domains of disadvantage are derived from existing literature and indicator sets, as are a range of individual topics within each domain. Both domains and indicators are considered in relation to four life course stages: childhood, youth, working-age adulthood and later life.
From this background, a matrix of domains and topic areas, the Bristol Social Exclusion Matrix (B-SEM), is outlined in Chapter Five. This was then used to assess the coverage of a range of key cross-sectional and longitudinal social surveys and the potential of administrative data. For this part of the research, the team accessed the Economic and Social Research Council (ESRC) data archive and other relevant data banks, and systematically cross-matched each questionnaire to the derived matrix. The technical report on each survey was used to identify the size and composition of the sample, and especially the representation, under-representation and omission of sub-groups, particularly those likely to be vulnerable to social exclusion. Each data set was subsequently considered by the team’s statistical experts for its potential for analysing social exclusion, and notes incorporated into the supporting summary for each survey. Chapter Five summarises the overall findings from this exercise, Appendix 6 contains a detailed account of the characteristics of each survey considered. Appendix 7 provides a tabular version of the B-SEM for each survey, showing the extent of the data coverage in relation to social exclusion.
17 methodological possibilities and difficulties associated with the use of survey and administrative data, addressing both general issues and their impact on specific surveys. In addition, a National Data Strategy (NDS) was launched in 2005. The component parts of this include a UK Data Forum, and the national Longitudinal Strategy Committee (see Buck 2002) that will report annually in February to the UK Data Forum and the ESRC Research Resources Board (NDS, 2005a, 2005b). As part of this, the ESRC commissioned a report on existing panel and cohort studies (Martin et al, 2006), as well as an audit of administrative data resources (Jones and Elias, 2006).
In relation to administrative data, the huge range of data held by different government departments and the small scale of this study necessitated a highly selective approach. The research team contacted key individuals in the Department for Education and Skills (DfES), Department for Work and Pensions (DWP) and the Citizens Advice Bureau (CAB), and also consulted relevant GSS methodology papers with particular attention to non-response errors (GSS 1998, 1999, 1999a, 1999c, 2000, 2001). The feedback from this exercise made a very useful contribution to a preliminary general assessment of possibilities here, as well as identifying other work on merging data sets due to report shortly. It is evident that there is a great deal of duplication of effort in this area, and steps should be taken to minimise this, at least by ensuring that relevant researchers in government departments are aware of the work of the independent NDS.
18
Chapter two
Concepts and definitions of social exclusion
Conceptualising social exclusion
The main purpose of this project, as outlined in Chapter One, is to explore the scope for the analysis of ‘deep exclusion’ or multiple disadvantage across a range of existing data sets, and to identify gaps in the knowledge base and potential strategies for filling those gaps.
The first task is to establish what is meant by social exclusion in general and deep exclusion in particular, and thus in broad terms what the relevant dimensions of ‘disadvantage’ might be. In 1997, the SEU defined social exclusion as:
… a shorthand term for what can happen when people or areas suffer from a combination of linked problems such as unemployment, poor skills, low incomes, poor housing, high crime environments, bad health and family breakdown.
This definition encapsulates multiple disadvantage, but is also quite vague in that it does not specify ‘what can happen’.
Within two years, the UK government had established an annual audit of ‘poverty and social exclusion’, the Opportunity for All reports, beginning in 1999, although this also does not offer a very specific definition. It adds to the SEU formulation that:
Social exclusion occurs where different factors combine to trap individuals and areas in a spiral of disadvantage. (DSS, 1999, p 23)
Poverty is seen as multi-dimensional:
Lack of income, access to good-quality health, education and housing, and the quality of the local environment all affect people’s well-being. Our view of poverty covers all these aspects. (DSS, 1999, p 23)
19 Poverty … [exists] when people are denied opportunities to work, to learn, to live healthy and secure lives, and to live out their retirement years in security. (DSS, 1999, p 23)
Alongside the Opportunity for All reports, the NPI, in conjunction with the Joseph Rowntree Foundation (JRF), from 1998 produced its own annual series Monitoring Poverty and Social Exclusion. The NPI has developed an extensive website (www.npi.org.uk) that goes substantially beyond the report issued annually as hard copy, and is an invaluable resource (the indicators are discussed below). There is, however, very little definitional discussion in either virtual or hard copy versions. The 2005 report includes no definition (Palmer et al, 2005). The website, drawing on the definition in the first report (Howarth et al, 1998) says:
While the number of people on low income, measured in various different ways, are naturally treated as an important aspect of poverty and social exclusion, this report stretches well beyond that. The notion of poverty that has guided the development of this report is where people lack many of the opportunities that are available to the average citizen. Low income and limited expenditure, especially on essentials, will be indicative of this, but the report also includes many indicators of things that researchers have been found to be disproportionately associated with low income, for example, certain forms of ill-health and restricted access to services. This broad concept of poverty coincides with the emerging concept of social exclusion. Its great practical value is that it widens the focus to include factors that may be thought to cause severe and chronic disadvantage. In the context of this report, this means that indicators connected with long term lack of paid work, or poor educational qualifications, can be included alongside more readily understood aspects of poverty. (NPI, 2006)
In 1989, the European Commission was asked by the Council of Ministers to examine policies to combat social exclusion. In 2000, the Lisbon Summit put poverty and social exclusion at the heart of EU social policy. Specific criteria were set out at Nice in 2001, together with a requirement that each member state produce a biennial national action plan on social inclusion (NAPincl). The Nice objectives, which include a specific reference to addressing vulnerable groups at particular risk of exclusion, are as follows:
20 • Preventing the risks of exclusion
• Helping the most vulnerable
• Mobilising all relevant bodies in overcoming exclusion.
‘Helping the most vulnerable’ might be seen as an early pre-occupation of the SEU: its early reports focused on particular groups – rough sleepers, those truanting from or excluded from school, pregnant teenagers, young people not in education, or training. A large part of its work subsequently focused on neighbourhood disadvantage. In 2004, alongside continuing work on specific groups such as looked-after children, prisoners and those suffering poor mental health, the emphasis shifted to a programme of work on Breaking the Cycle and preventing social exclusion, including a substantial amount of commissioned work on The drivers of social exclusion (Bradshaw et al, 2004). In May 2006 the issue of social exclusion was given Cabinet-level priority with the appointment of a Minister for Social Exclusion. This, however, was followed with the announcement in June 2006 of the closure of the SEU itself, with its work being transferred to a smaller task force in the Cabinet Office responsible for trying to persuade Whitehall departments to focus on the most severely excluded. The Social Exclusion Task Force (SETF) avoids the terminology of the Treasury, whose Children and Young People’s Policy Review (launched in conjunction with the Department for Education and Skills and informing the 2007 Comprehensive Spending Review) includes ‘the stock of families already regarded as high cost, high harm’ and those ‘at high risk of moving into this situation’ (HM Treasury 2006; see also Feinstein and Sabates 2006). For SETF, references to ‘disadvantage and harm’ (SETF 2006:5) are accompanied by prioritisation of ‘specific hard-to-reach groups, including children in care, people with mental health problems and teenagers at risk of pregnancy’ (SETF, 2006, p. 95), and an emphasis on early intervention. However, there are also references to ‘problem families’ (Cabinet Office 2006), and a strong emphasis in the report on the responsibility of the excluded themselves: Thus ‘In this Action Plan we have focused on some of the most excluded groups, such as children in care or adults leading chaotic lives – groups that have generally failed to fulfil their potential and accept the responsibilities that most of us take for granted’ (SETF 2006:10).
21 Table 2.1: Definitions of social exclusion or inclusion
1 … a shorthand term for what can happen when people or areas suffer from a combination of linked problems such as unemployment, poor skills, low incomes, poor housing, high crime environments, bad health and family breakdown. (SEU, 1997)
2 Social exclusion occurs where different factors combine to trap individuals and areas in a spiral of disadvantage. (DSS, 1999, p 23)
3 Social exclusion is a process, which causes individuals or groups, who are geographically resident in a society, not to participate in the normal activities of citizens in that society. (Scottish Executive, nd)
4 The notion of poverty that has guided the development of this report is where people lack many of the opportunities that are available to the average citizen.… This broad concept of poverty coincides with the emerging concept of social exclusion. (NPI, Howarth et al, 1998) 5 The processes by which individuals and their communities become polarised, socially
differentiated and unequal. (ESRC, 2004)
6 The dynamic process of being shut out from any of the social, economic, political and cultural systems which determine the social integration of a person in society. (Walker and Walker, 1997, p 8)
7 A lack or denial of access to the kinds of social relations, social customs and activities in which the great majority of people in British society engage. In current usage, social exclusion is often regarded as a ‘process’ rather than a ‘state’ and this helps in being constructively precise in deciding its relationship to poverty. (Gordon et al, 2000, p 73) 8 An individual is socially excluded if (a) he or she is geographically resident in a society but
(b) for reasons beyond his or her control, he or she cannot participate in the normal activities of citizens in that society, and (c) he or she would like to so participate. (Burchardt et al, 2002, pp 30, 32)
9 Inadequate social participation, lack of social integration and lack of power. (Room, 1995 ) 10 Social exclusion is a broader concept than poverty, encompassing not only low material
means but the inability to participate effectively in economic, social, political and cultural life and in some characterisations alienation and distance from mainstream society. (Duffy, 1995)
11 (Social Inclusion) The development of capacity and opportunity to play a full role, not only in economic terms, but also in social, psychological and political terms. (EU Employment and Social Affairs Directorate)
12 An accumulation of confluent processes with successive ruptures arising from the heart of the economy, politics and society, which gradually distances and places persons, groups, communities and territories in a position of inferiority in relation to centres of power, resources and prevailing values. (Estivill, 2003, p 19)
Several points about these definitions have a bearing on the present project.
22 of polarisation and inequality to the growth of social exclusion (see Rowntree, 1995), but have drawn attention to what Barry calls an ‘upper threshold’ of social exclusion, permitting self-exclusion by the rich (Hutton, 1996; Barry, 2002). Such forms of closure may be of particular importance in the context of rising inequality and falling social mobility (Aldridge, 2001, 2004).
Second, although the definitions may be clear and precise, their level of abstraction means they are not empirically precise. While they help to conceptualise social exclusion, this is not the same as providing an operational definition that is amenable to measurement. Operational definitions are always a compromise between conceptual precision and clarity and what is theoretically and practically measurable. Consequently, many reports on aspects of social exclusion open by grappling with the variation in definitions, and the difficulty of operationalising these. For example, several refer to disconnection from economic processes, but do not specify what this means in practice. This is often taken to mean non-participation in, or exclusion from, the labour market, perhaps partly because of macro-economic policies that involve increasing labour force participation rates. Other sources include participation in unpaid or caring work. Some contemporary literature regards consumption, which can also be construed as an economic process, as crucial to identity formation and self-respect (Bauman, 1998; Bowring, 2000).
Third, several of the definitions refer to exclusion from activities that are ‘normal’ or available to the ‘average citizen’, or to the majority of citizens. While this appears to be an empirical question, it is also a normative one. The selection of which activities ‘matter’ involves a judgement, and one that may change over time, as expectations and opportunities change.
23 freedom includes also the capacity and resources required to exercise that freedom including resources such as education, information and transport, as well as material resources such as income.
Fifth, the Nice criteria specifically distinguish risks from access to goods, resources, services and employment (implicitly therefore constitutive of exclusion). Labour market inactivity may be seen as constitutive of social exclusion (at least for working-age adults). Alternatively, it may be seen as a risk factor, increasing the probability of poverty and social exclusion. It may, of course, be both. In exploring or constructing indicators, the distinction between outcome measures and risk factors is important (see Barnes, 2005). An analysis that usefully deploys this distinction in analysing social exclusion among older people is Barnes et al (2006). However, it is characteristic of the process of social exclusion that many outcomes also constitute risk factors, so the distinction is not absolute.
A useful report from the Department for Transport (DfT) points to a range of factors that can be summarised as risks, relations and resources, but also endorses the emphasis in the literature on some different aspects of social exclusion from those outlined above – questions of status, recognition and self-esteem, as well as expectations and power:
Oppenheim (1998) suggests that it is necessary to focus on social exclusion rather than poverty for a number of reasons. Social exclusion is multi-causal, relational, and it includes less tangible aspects than poverty such as the loss of status, power, self-esteem and expectations.… We might also add here that another important aspect of exclusion is political exclusion and the inability to influence decision making, which can be affected by a lack of resources, including time, telephones, transport and articulacy.(DfT, nd, p 10)
24 be related to the EU definition (definition 11) that refers to playing a full part in society in psychological terms, and the NPI (definition 4) reference to access to opportunities, which can be interpreted as including the opportunity for social confirmation of personal worth. In this context, some of the language of recent government reports on those experiencing social exclusion is significant: there are several potentially stigmatising references to people with ‘chaotic lives’ (Social Exclusion Task Force, 2006).
Other work has also addressed the question of social exclusion in terms of the quality of life of older people (Barnes et al, 2006). This is conceptually helpful, since quality of life is the background concern of much of the work on social exclusion. Exclusion on one or more dimensions has a severe negative impact on quality of life. The centrality of this has been somewhat obscured by an over-emphasis on paid work, so that in 1998 the NPI identified “a lack of clarity about what social exclusion might mean” for older people “because neither inclusion within education and training nor inclusion within paid work will be central to overcoming any problem” (Howarth et al, 1998, p 14).
25
A composite working definition of social exclusion that encapsulates many of the factors reflected in the literature is:
Social exclusion is a complex and multi-dimensional process. It involves the lack or denial of resources, rights, goods and services, and the inability to participate in the normal relationships and activities, available to the majority of people in a society, whether in economic, social, cultural or political arenas. It affects both the quality of life of individuals and the equity and cohesion of society as a whole.
This definition does not address the structural issues of inequality, polarisation, social mobility and social closure noted above. A definition is a purposive construction, and this is designed to facilitate the exploration of the experience or effects of exclusion at the individual and/or household level. In the context of the present study, structural characteristics are best seen as drivers of social exclusion, rather than constitutive of it. A review of the literature on the drivers of social exclusion conducted for the SEU in 2004 identified three areas of macro-drivers. “Poverty, inequality and social exclusion”, it argues, “are driven upwards and downwards by three major contextual factors: demographic, labour market and social policy” (Bradshaw et al, 2004, p 9). The demographic factors operating in the past to increase levels of social exclusion have been “large youth cohorts, ageing and increased dependency ratios, and family change, particularly the increase in lone parent families”. The impact of these is currently less, but there are additional trends of inward migration, single living and cohabitation that may possibly lead to increased levels of social exclusion. Labour market factors have included unemployment, ‘flexibility’ and greater insecurity in the labour market, the dispersion of earnings and the concentration of work. Social policy changes in the 1980s and 1990s also, they argue, led to increased levels of social exclusion: uprating benefits in line with prices rather than earnings; abolition and cuts to some benefits; a shift from direct to indirect taxation and a consequently more regressive system; cuts in service expenditure, especially on housing, or increases that were insufficient to meet increased need. However, they point out that if social policy can be a macro-driver of social exclusion, it is also capable of reducing it (Bradshaw et al, 2004, pp 13, 100).
Deep exclusion
26 in wide, deep and concentrated forms, and it is important not to confuse them” (Miliband, 2006, p 3). ‘Wide exclusion’ refers to those deprived on a single indicator. ‘Deep exclusion’ refers to those who are excluded on multiple counts, while ‘concentrated exclusion’ refers to the concentration of problems in particular geographical areas. “Here we get closer to a more recognisable definition of social exclusion reflecting the most disadvantaged in society” (Miliband, 2006, p 7). Miliband suggested that the SEU and other government departments need to set minimum standards across different stages of the life course – for children, working-age adults and older people. A large minority would be below one or more of the basic minimum standards. (Indeed, it is even possible that a majority of the population could be considered socially excluded on at least one count.)
In the same speech Miliband emphasised the multi-dimensionality of social exclusion in general: “the focus on social exclusion signalled that there was more than one dimension to inequality” – assets, skills, social networks and housing, as well as income (Miliband, 2006, p 4). He identified four distinctive features of government thinking in terms of social exclusion:
• it is relative and relational • it is multi-dimensional
• the extension of state help must be accompanied by an extension of personal responsibility
• it is embedded in power relations that constrain and define the capabilities and choices of individuals.
27 Lack of income and productive resources to ensure sustainable livelihoods; hunger and malnutrition; ill-health; limited or lack of access to services; increased morbidity from illness; homelessness and inadequate housing; unsafe environments and social discrimination and exclusion. It is also characterised by lack of participation in decision-making and in civil, social and cultural life. (UN, 1995)
The most recent literature on poverty emphasises the relational questions of recognition and respect (Lister, 2004). There is a growing body of work on the development of capacities and capabilities, building on the work of Amartya Sen (Nussbaum and Sen, 1993; Sen, 1995, 2001).
To some extent these differences are semantic, since all are concerned with multiple disadvantage. However, in some cases definitions of and policy approaches to poverty and social exclusion embed questions of causality. Levitas (1998, 2005) identifies three different orientations to social exclusion in British public policy, implying different models of causality and different policy interventions. In the redistributive (RED) model, lack of material resources is presumed to be the root cause:
Individuals, families and groups can be said to be in poverty when they lack the resources to obtain the types of diet, participate in the activities and have the living conditions and amenities which are customary, or at least are widely encouraged and approved, in the societies to which they belong. Their resources are so seriously below those commanded by the average individual or family that they are, in effect, excluded from ordinary living patterns, customs and activities. (Townsend, 1979, p 32)
28 characteristics of the excluded and their imputed deficiencies. Silver (1994) also argues that there are three dominant approaches to social exclusion, linked to different models of the welfare state. The importance of these arguments is both that different people may understand quite different things by the term ‘social exclusion’, and impute quite different causal processes, and causal relationships between factors need to be established empirically, not embedded in definitions.
The question of whether ‘deep exclusion’ is a distinct phenomenon from social exclusion more generally, or produced by different ‘drivers’ is, in the light of the existing definitions of social exclusion, very unclear. This applies to the macro-drivers identified by Bradshaw and colleagues. Bradshaw et al (2004) make two further points that are crucial to the scope of the current project. One is the importance of distinguishing between macro-drivers that increase the overall levels of social exclusion, or particular aspects of it such as homelessness, and the causes or correlates of individual vulnerability to social exclusion. Where individuals are concerned, it is also useful to distinguish between risk factors and triggers. Risk factors signal increased vulnerability of a category of individuals, while triggers have a direct causal impact. Triggers are in fact only specifically identified by Bradshaw et al in relation to homelessness, where leaving local authority care or prison are critical.
Bradshaw et al also make the point that establishing causation in social sciences research is particularly difficult:
The aim is to establish drivers. We understand drivers to mean the factors that cause or generate social exclusion. In social science, it is extremely difficult to establish cause. An association, relationship or correlation is often the best that can be demonstrated. Even then there are problems in demonstrating the direction of relationship between the driver and social exclusion, or whether it is the driver itself or a factor associated with the driver that produces the exclusion. (Bradshaw et al, 2004, p 6)
29 employment, education, health, housing, neighbourhoods (including transport, social capital and neighbourhood deprivation) and crime.
Because of the multi-faceted and interactive process of social exclusion, the drivers of social exclusion that are identified by Bradshaw et al partly coincide with the domains themselves: low income, unemployment, education, ill-health (including substance misuse, child accidental death and mental health problems), housing (especially homelessness), transport problems, crime and fear of crime. Although our current project is primarily concerned with ‘deep’ exclusion, it is notable that in relation to ‘concentrated’ exclusion, Bradshaw et al concluded from the literature that neighbourhood effects were often overstated, and that “neighbourhood factors were less important than individual characteristics” (Bradshaw et al, 2004, p 107). Poverty was identified as a key factor in most other dimensions of exclusion.
The work on The drivers of social exclusion, together with an investigation of the concept itself, calls into question the existence of a distinctive phenomenon of deep exclusion. If social exclusion itself is about multiple disadvantage, deep exclusion is simply the most severe manifestation of an already severe process. Rather than treating deep exclusion as a qualitatively distinct phenomenon, it is perhaps more accurate to recognise that just as there are very marked difference of access to goods, services resources, power, recognition and so on among the socially included, so the socially excluded vary in the severity of their condition: deep exclusion is a matter of degree.
A working definition of deep exclusion might therefore be:
Deep exclusion refers to exclusion across more than one domain or dimension of disadvantage, resulting in severe negative consequences for quality of life, well-being and future life chances.
Deep exclusion thus emphasises the issue of multiple and severe disadvantage. Miliband’s (2006) examples of multiple deprivation are:
• struggling with basic skills and long-term unemployed
30 These, and especially the last example, echo the concerns encapsulated in the SEU’s original description of social exclusion, as well as being wholly consistent with the United Nations (UN) definition of overall poverty.
The dimensions Miliband referred to included:
• 10.1 million working-age adults without an NVQ (National Vocational Qualification) Level 2 qualification
• 3.8 million working-age people in workless households • 3.2 million children who live in non-decent housing
• 2.2 million older people living in relative low-income households • 464,000 19-year-olds with no Level 2 qualifications
• 194,000 16- to 18-year-olds not in education, employment or training • 2.2 million children in absolute poverty
• 3.5 children in relative poverty
• 5.2 million people struggling with basic literacy and numeracy • homeless people
• housebound elderly.
One widely cited social policy expert cites seven dimensions to social exclusion itself (Percy-Smith, 2000:9):
• economic (for example, long-term unemployment, workless households, income poverty)
• social (for example, homelessness, crime, disaffected youth)
• political (for example, disempowerment, lack of political rights, alienation from/lack of confidence in political processes)
• neighbourhood (for example, decaying housing stock, environmental degradation) • individual (for example, mental and physical ill-health, educational
under-achievement)
• spatial (for example, concentration/marginalisation of vulnerable groups). • group (concentration of the above characteristics in particular groups: elderly,
31 Thus although the distinction between wide and deep exclusion makes intuitive sense at a descriptive level, it does depend very much on how many dimensions are identified, and what they are. For example, low income and material deprivation may be treated as separate dimensions, or used to generate a compound indicator of poverty as in the PSE Survey (see Chapter Four). One partial solution to this is to think in terms of a hierarchy of domains, topics and indicators, rather than ‘dimensions’, and accept that there may be a variety of appropriate or possible indicators within a given domain or for a specified topic. This is particularly important when contemplating the use of existing data sets, where the task is to assess whether there is data that could be used as a proxy indicator for the topics under scrutiny.
We are still faced with the question of what these domains might be, and which topics might be identified as most important within each of these domains. The next chapter, therefore, considers the indicator sets that have so far been used to measure or monitor social exclusion, in order to assess their adequacy, before returning to the identification of topics within individual domains.
32
Chapter three
From concepts to indicators
Single indicator sets
From the outset it was recognised that effective government policy to combat poverty and social exclusion requires appropriate data, raising the issue of relevant indicators of social exclusion. Debate in 1998-99 in academic, policy and think-tank circles in the UK resulted in the production of two sets of indicators from existing statistics. Subsequently, in 2001 the EU adopted its own set of measures to provide comparative data across member states – an indicator set somewhat narrower than either of the UK versions, and notably narrower than those proposed in a major report to the Social Protection Committee (Atkinson et al, 2002). The most important sets of single indicators currently produced or proposed are therefore:
• the Laeken indicators, the agreed battery of indicators for measuring progress in tackling poverty and social exclusion across the EU;
• the wider set proposed to the Social Protection Committee, the Atkinson indicators; • the indicators included in NAPincl. These go beyond the Laeken indicators, and
essentially coincide with those forming the basis of the UK annual audit of poverty and social exclusion, initiated in 1999 as Opportunity for All;
• the separate but overlapping series developed by the NPI and JRF, Monitoring Poverty and Social Exclusion.
33 drawn on the relevant specialist literatures to look at gaps in the conceptualisation and coverage of social exclusion.
The Laeken indicators (Table 3.1) are relatively narrow in scope. They mainly address questions of distributive poverty, inequality and labour market access, including some measures of low educational attainment and qualification. Otherwise, there are just two indicators of well-being: life expectancy and self-defined health status.
[image:33.595.65.516.393.706.2]The Laeken primary and secondary indicators are constrained by the data that can be produced in comparable form across the EU. The Open Method of Coordination is also predicated on the practices of monitoring and sharing best practice. It is accepted that other ‘tertiary’ indicators are needed that are sensitive to the particular conditions in individual member states. However, it is notable that the priority here is given to economic, rather than social, political or cultural dislocations – either because this is deemed more important, or because the economic sphere is assumed to be causal.
Table 3.1: Harmonised indicators of social exclusion adopted by the EU in 2001
Indicator
Primary indicators
1 Low income rate after transfers with low-income threshold set at 60% median income, with breakdowns by gender, age, activity status, household type and housing tenure
2 Distribution of income, using income quintile ratio
3 Persistence of low income
4 Median low income gap
5 Regional cohesion (measured by variation of employment rates)
6 Long-term unemployment rate
7 People living in jobless households
8 Early school leavers not in education or training
9 Life expectancy at birth
10 Self-defined health status by income level
Secondary indicators
11 Dispersion around the low-income threshold using 40%, 50% and 70% median national income
12 Low income rate anchored at a fixed point in time
13 Low income rate before transfers
14 Gini coefficient
15 Persistent low income (below 50% median income)
16 Long-term (over 12 months) unemployment share
17 Very long-term (over 24 months) unemployment share
18 People with low educational attainment
Source: Social Protection Committee (2001)
34 adequacy, different aspects of which are included as a level one, or primary, indicator; as a level two indicator; and as three of the eight proposed new areas of measurement. However, most of the level one and level two indicators are again concerned with the risk of income poverty and labour market vulnerability. Most other features of social exclusion are areas where appropriate indicators need to be developed, but they identify the relevant additional areas of social exclusion as:
• health • deprivation
• access to education • housing
• basic skills (literacy and numeracy) • access to public and private services
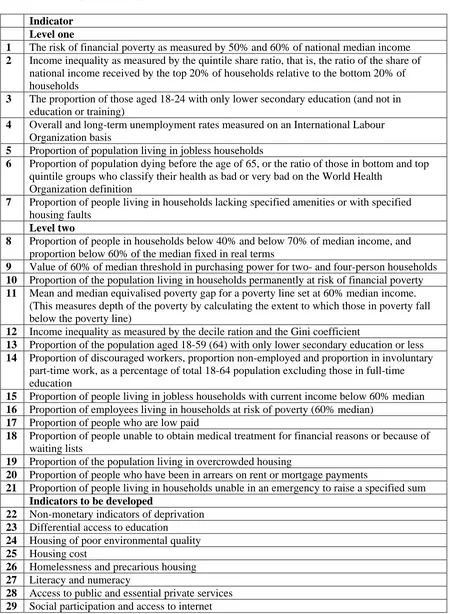
35 Table 3.2: Proposed European indicators of social exclusion (Atkinson indicators)
Indicator Level one
1 The risk of financial poverty as measured by 50% and 60% of national median income
2 Income inequality as measured by the quintile share ratio, that is, the ratio of the share of national income received by the top 20% of households relative to the bottom 20% of households
3 The proportion of those aged 18-24 with only lower secondary education (and not in education or training)
4 Overall and long-term unemployment rates measured on an International Labour Organization basis
5 Proportion of population living in jobless households
6 Proportion of population dying before the age of 65, or the ratio of those in bottom and top quintile groups who classify their health as bad or very bad on the World Health
Organization definition
7 Proportion of people living in households lacking specified amenities or with specified housing faults
Level two
8 Proportion of people in households below 40% and below 70% of median income, and proportion below 60% of the median fixed in real terms
9 Value of 60% of median threshold in purchasing power for two- and four-person households
10 Proportion of the population living in households permanently at risk of financial poverty
11 Mean and median equivalised poverty gap for a poverty line set at 60% median income. (This measures depth of the poverty by calculating the extent to which those in poverty fall below the poverty line)
12 Income inequality as measured by the decile ration and the Gini coefficient
13 Proportion of the population aged 18-59 (64) with only lower secondary education or less
14 Proportion of discouraged workers, proportion non-employed and proportion in involuntary part-time work, as a percentage of total 18-64 population excluding those in full-time education
15 Proportion of people living in jobless households with current income below 60% median
16 Proportion of employees living in households at risk of poverty (60% median)
17 Proportion of people who are low paid
18 Proportion of people unable to obtain medical treatment for financial reasons or because of waiting lists
19 Proportion of the population living in overcrowded housing
20 Proportion of people who have been in arrears on rent or mortgage payments
21 Proportion of people living in households unable in an emergency to raise a specified sum
Indicators to be developed
22 Non-monetary indicators of deprivation
23 Differential access to education
24 Housing of poor environmental quality
25 Housing cost
26 Homelessness and precarious housing
27 Literacy and numeracy
28 Access to public and essential private services
29 Social participation and access to internet
Opportunity for All and Monitoring Poverty and Social Exclusion
36 • children and young people
• working-age people
• people aged 50+ and retired people • communities (all ages).
This reflects a general acceptance that the precise meaning of social exclusion and its appropriate indicators vary between age groups.
In all, there are 60 Opportunity for All indicators in the 2005 report (see Appendix 1), 25 of which apply to children and young people, 18 to people of working age, 10 to those aged over 50, and 7 to communities. The balance of these reflects two things: the emphasis, in policy terms, on early intervention (consistent with the second Nice criterion, ‘preventing the risks of exclusion’); and the relative underdevelopment of indicators for older people, for whom labour market activity is not required and is a less central concern in terms of social inclusion. This in turn underlines the fact that labour market activity is, at the UK level as well as in Europe, perceived as a central element of social inclusion.
There are overlaps between the groups. A ‘child’ is defined for the purposes of the low income indicators as “an individual aged under 16, or an unmarried 16 to 18-year-old on a course up to and including A level standard (or up to and including Highers in Scotland)” (DWP 2006, p 155). There is no equivalent definition for a ‘young person’. Those of working age include all those who are not children and are below state pension age (less than 65 for men, less than 60 for women). The inclusion of those over 50 in the headline description of this group is somewhat misleading (see below).
37 The organisation of the NPI indicators shown in Appendix 2 is slightly different from the Opportunity for All set, in that the low-income figures are treated en bloc. These include an indicator of material deprivation drawn from the BHPS, although it is of limited usefulness, giving figures for the number of households lacking two out of three consumer durables, video, freezer and washing machine (the NPI note that this is ‘driven by data availability and somewhat arbitrary’). Thereafter the life course sequence is followed as in the Opportunity for All except that the sections for children and young people are separated, and the working adults section applies mainly to those over the age of 25. However, since both take a life course approach, it makes sense to discuss the indicators together under the age-related headings used by Opportunity for All.
In addition to the life course indicators, both Opportunity for All and the NPI have indicators at community level. Those in the Opportunity for All series cover employment rates in deprived areas, crime rates in high-crime areas, housing that falls below the set standard of decency, households in fuel poverty, life expectancy at birth, the attainment gap at Key Stage 2 and casualties in deprived areas.
In the NPI set, the ‘community’ or ‘social cohesion’ indicators include non-participation in a range of organisations: trades unions, professional associations, environmental groups, parents’/school associations, pensioner groups, community groups, tenant/resident groups, women’s groups, religious groups, sports clubs, social groups and political parties, with the data drawn from the BHPS. Notwithstanding the criticisms of an over-focus on paid work in government approaches, and the consequent incorporation of indicators on the quality of work, the justifications for the inclusion of this indicator portray voluntary activity as a means to, or a substitute for, paid work rather than a valued activity in its own right:
Social networks are a means of finding paid employment and other forms of occupation. A lack of contacts has been shown to prolong unemployment. The long term unemployed often have low levels of social engagement beyond their immediate families. Policies aimed at reducing poverty and social exclusion through paid work depend partly on fostering networks between the employed and unemployed. (NPI, 2006)
38 unions and tenants groups to social groups and sports clubs. People’s local communities can provide numerous opportunities both for help and for the chance to help. (NPI, 2006)
Access to services constitutes a separate sub-section in the ‘community’ section of the NPI report, which is comprised of transport, not having a bank account, and not having home insurance (indicators 45, 46, 47). This section also contains a series of indicators on the quality, cost and precariousness of housing. Although there are more indicators on these topics included in the NPI report, they are in many cases assessed by the report’s authors as of only medium or limited robustness.
Children
In 2004, of 59.8 million residents in the UK, 11.6 million, or nearly 20%, were under the age of 16. The Opportunity for All section on children, as for all groups, includes several indicators of income poverty. Although the measurement of child poverty is changing to include a combination of low income and material deprivation, as yet no indicators of the latter are incorporated into the Opportunity for All series. Attempts have been made to construct a time series using proxy measures from FACS and the new section of the Family Resources Survey (FRS) (Willitts, 2006). The health indicators mainly apply to younger age groups: infant mortality, child protection registrations, obesity in the under 10 age group, smoking in the under-15s. The serious unintentional injury indicator similarly only applies to those under the age of 16. There is a range of indicators of development (for Sure Start areas only), access to education and educational attainment. Households in temporary accommodation and those in non-decent housing are counted. However, there are no service-related or participation indicators included. Specific attention is given to the outcomes for looked-after children and for teenage parents.
Monitoring Poverty and Social Exclusion has a smallernumber of indicators for children than the Opportunity for All set, grouped under the headings of economic circumstances, health and well-being, and education. It addresses some of the most serious exclusions, including not only permanent inclusion from school but incarceration in young offenders’ institutions.
39 ethnicity, neighbourhood deprivation, gender, disability and family background (including occupation, family type and income) are treated as risk factors. Groups at acute risk of exclusion are also identified. Five domains are used. The framework is formulated to be ‘positive’ rather than a deficit model, as indicated by the language used in the original documents (shown here in brackets). Although the merits of this are clear, there are also risks: it can be read as exhortatory, placing too much responsibility upon children for effecting their own inclusion.
• Being healthy (Be healthy) • Safety and security (Stay safe)
• Enjoying and achieving (Enjoy and achieve)
• Social and civic participation (Make a positive contribution) • Economic well-being (Achieve economic well-being).
However, if we consider the domains in the ECM framework across the life-course and compare them with the Opportunity for All and NPI indicators, we can see that the latter offer almost no indicators on social and civic participation. There are no indicators of ‘enjoying and achieving’ for older people, and only the lack of NVQ Level 2 qualifications for those of working age. Indeed, there are very few indicators for older people at all.
40
For instance, the aims and targets associated with Enjoy and achieve are biased towards achieving, such as in achieving ‘stretching national educational standards’ at primary and secondary level, rather than enjoying. More interesting from a poverty and social exclusion perspective, is the aim included under Make a positive contribution that ‘Children and young people develop enterprising behaviour’. This is related to the Department of Trade and Industry (DTI) national target of the percentage of 18- to 24-year-olds who are self-employed, manage own business or have thought seriously about starting their own business. Yet any judgements relating directly to children and young people’s enterprising behaviours are lacking from the related inspection section of the outcomes framework, as they are from those provided for the domain Achieve economic well-being.
The framework thereby ignores the “overwhelming evidence” (Hobbs et al, 1996, p 16) for children and young people’s extensive participation in paid employment. This issue is not only strongly linked to poverty (Middleton and Loumidis, 2001) and risks to children’s health and educational attainment, but the area is also covered by more than 200 laws and by-laws currently in force (Better Regulation Task Force, 2004). This illustrates the Every Child Matters framework’s lack of scope regarding important aspects of child well-being and social inclusion.
The scope of child indicators in poverty and social exclusion surveys is rather broader than this. For example, The 1999 PSE Survey children’s indicators (see Chapter Four) are more extensive than either the 2005 Monitoring Poverty and Social Exclusion indicators (Appendix 1), or the 2005 Opportunity for All indicators (Appendix 2). These additional indicators, such as age-related participation in social activities, experience of bullying, temporary exclusion and additional indicators of material deprivation should be included among child indicators in future. A recent report by the Loughborough team for Save the Children (Adelman et al, 2003) contains the most extensive description of the nature of children’s poverty and social exclusion in Britain employing PSE Survey indicators and data. Another report for Save the Children on child poverty (Magadi and Middleton, 2005) is based on the most recent BHPS data 1994-2002 and thus covers England, Scotland and Wales.
41 survey that covers issues related to poverty and social inclusion. This invaluable source of data on children’s direct experience of social exclusion has been analysed by Magadi and Middleton (2005, p 6) in terms of (a) relationships with friends and family; (b) pocket money and part-time work; (c) school experience and career aspirations; and (d) emotional well-being. All make excellent indicators of social exclusion.
Some other general surveys include indicators that appear to be relevant to the multi-dimensional measurement of children’s social exclusion. The 2004 FACS (Lyon et al. 2006), employs additional indicators such as the ‘number of food and meal items family were unable to afford’ from section 10 on material deprivation, children’s access to ‘technology’ and ‘happiness’ from section 14 on children’s activities and leisure time and items from section 15 on child maintenance.
There are some significant gaps and omissions in pertinent indicators of the well-being of children. In its recent report, the Fabian Commission on Life Chances and Child Poverty draws attention (The Fabian Society, 2006, p 97) to the ONS (1999a) survey of child mental health, which established clear links between family income, housing quality and child mental health. Findings indicated that children in families on an income of less than £100 a week were three times more likely to suffer from a mental disorder than children in families living on £500 a week or more. Similarly, children in social housing were three times more likely to suffer from a mental disorder than those in privately owned housing. Such disorders and emotional and behavioural problems are linked to aspects of social exclusion such as stigma and discrimination, disrupted schooling and social isolation. Data from a three-year follow-up survey have recently been published, confirming these trends.
42 Virtually all information about children in social surveys is collected from adults, and thus from proxy informants. There are consi