0095-1137/10/$12.00 doi:10.1128/JCM.00344-10
Copyright © 2010, American Society for Microbiology. All Rights Reserved.
Microarray for Hepatitis B Virus Genotyping and Detection of 994
Mutations along the Genome
䌤
†
Marie Gauthier,
1Bertrand Bonnaud,
2Maud Arsac,
2Fabien Lavocat,
1Je
´ro
ˆme Maisetti,
2Alan Kay,
3Franc
¸ois Simon,
4Fabien Zoulim,
3and Guy Vernet
1*
Laboratoire des Pathoge`nes Emergents, Fondation Me´rieux, 21 avenue T. Garnier, 69007 Lyon, France1;
Information Technologies Department, bioMe´rieux S.A., 69280 Marcy-l’Etoile, France2;
INSERM U871, 151 Cours Albert Thomas, 69008 Lyon, France3; and Department of
Virology, Saint-Louis Hospital, 1 Avenue Claude Vellefaux, 75010 Paris, France4
Received 19 February 2010/Returned for modification 2 April 2010/Accepted 30 August 2010
Genome analysis of hepatitis B virus (HBV) in patient sera is helpful for monitoring treatment. We developed an improved version of a DNA microarray to identify HBV genotypes and to detect mutations of interest in the S, Pol, Core, and X genes. It includes an automated software analysis of fluorescence values for simpler, more robust data interpretation. In this version, probes were added to identify genotype H, to analyze 155 additional positions, and to detect 561 additional polymorphisms. Sequences were added to the alignments to resolve hybridization problems due to natural polymorphisms in the vicinity of important codons. The duplex PCR protocol allowed whole-genome analysis in a single tube. An alternative nested-PCR protocol allowed genotyping and mutations in S and reverse transcriptase (rt) genes in patients with low viral loads, as demonstrated in patients with less than 400 HBV genome copies/ml. Reproducibility was high, with variation coefficients lower than 3%. Only 0.57% of 20,771 codons from 253 samples could not be identified. The concordance with Sanger sequencing for the identification of codons improved from 92.8% to 95.7% with the improved version. Concordance was higher than 91% for codons associated with resistance to lamivudine, emtricitabine, telbivudine, famciclovir, entecavir, and tenofovir with vaccine escape and for pre-Core mutants. Concordance was lower for adefovir resistance mutations (68.6%) and mutations in the basal core promoter (60.3%), probably because hybridization efficiency was affected by the low GC content of the probes. A concordance of 93.7% with sequencing for genotype identification was observed in 190 specimens, lower than that obtained with the first version, possibly due to mixed virus populations.
According to the WHO, hepatitis B virus (HBV) has in-fected more than 2 billion people worldwide, and more than 350 million people suffer from chronic hepatitis B (http://www .who.int/mediacentre/factsheets/fs204). The treatment of chronic hepatitis B is difficult, and complete cure is still rare (7). Polymorphisms in the viral genome have important im-pacts on disease prevention, natural history, and treatment, and laboratory methods for their detection are important tools for clinicians, epidemiologists, and researchers.
Eight viral genotypes have been described, named A to H, differing by at least 8% on the whole genome or by 4% in the S gene (1). They have different geographical prevalences (13, 21). Recombinants between genotypes and coinfection with different genotypes have been described (9, 12, 29, 32). The genotype may influence the treatment response (4, 11), disease evolution, and coinfection with other parenterally transmitted viruses, i.e., HIV, hepatitis C virus (HCV), and hepatitis D virus (HDV) (12).
Mutations in the precore (pre-C) gene are more frequent in patients with persistent viremia and severe disease (3).
Muta-tions in the basal core promoter (BCP) have been associated with fulminant hepatitis and severe disease (10, 22, 26). In a recent meta-analysis, Liu et al. (15) showed that mutations in the pre-S region, as well as in enhancer II of the core (C) gene and BCP, both overlapping with the X gene, are associated with hepatocarcinoma (HCC). These mutations may be useful biomarkers to predict the outcome of the disease and evolution toward HCC. Mutations in the X gene regulate viral infectivity and may induce hepatocarcinogenesis (19, 20, 33). Mutations in the pre-S1 and pre-S2 regions can induce inhibition of viral secretion (12), and mutations in the core gene can affect HBc antigenicity (12, 38), resulting in escape from host surveillance. In addition to alpha interferon, antiviral molecules targeting the reverse transcriptase (rt) activity encoded by the Pol (P) gene are now available for the treatment of hepatitis B: lami-vudine and, more recently, adefovir, entecavir, tenofovir, and emtricitabine. The emergence of mutant strains resistant to these drugs has been described (16, 27, 37), associated with mutations that compensate for loss of viral fitness (28). Lami-vudine should not be used alone, as resistant strains are ob-served in 70% of patients after 4 years of treatment (6). Recent studies recommended the standardization of treatment strate-gies according to patient profiles and the implementation of mutant detection assays (17).
Mutations associated with vaccine escape and immuno-therapy failure have been described in the S gene, especially in the region coding for theadeterminant of HBsAg (5, 12, 36). Mutations in the gene have also been associated with * Corresponding author. Mailing address: Lab. des Pathogenes
Emergents, Foundation Merieux, 21 Avenue T. Garnier, 69007 Lyon, France. Phone: 33 437 38 24 20. Fax: 33 437 38 24 11. E-mail: guy [email protected].
䌤Published ahead of print on 8 September 2010.
† The authors have paid a fee to allow immediate free access to this article.
4207
on May 16, 2020 by guest
http://jcm.asm.org/
occult hepatitis, although the mechanisms of action are not yet clear (8).
Sequencing remains the gold standard for molecular char-acterization. However, its interpretation can be influenced by several biases and requires specific skills. At least three differ-ent runs are needed to get the whole 3.2-kb HBV sequence. Line probe assays (LiPA [Innogenetics, Gent, Belgium]) are easy to perform, although at least three LiPA strips are re-quired to get information on genotypes (A to G only), 3 mu-tations in BCP/pre-C, and 6 mumu-tations in rt (18).
In this work, we describe a diagnostic tool for HBV geno-typing and mutation detection in a single experiment with automated software analysis. It is an improved version of an assay that was described previously (24, 34) and was designed to improve nucleotide identification and to detect an extended list of mutants and the recently identified H genotype.
MATERIALS AND METHODS
Microarray design.The Affymetrixin situsynthesis technology (Affymetrix) was used to design a microarray with 520,327 different probes allocated to the detection of polymorphisms/mutations in the HBV genome. Individual probes
are 20-mer oligonucleotides spotted individually on 11-m-wide squares. An
alignment of 1,454 HBV sequences was created in order to identify natural polymorphisms and to design the probes. We retrieved 986 sequences from GenBank (http://www.ncbi.nlm.nih.gov/GenBank/) and 586 from the private da-tabase of INSERM U871 (Lyon, France). The genotype A sequence X02763 was chosen as a reference for the alignment. The GenBank accession numbers of the other chosen reference sequences for each genotype are as follows: B, D00329; C, X01587; D, J02203; E, X75657; F, X75658; G, AF160501; and H, AY090454. A phylogenetic tree was created by combining PHYLIP, DNADIST (F84 dis-tance), and NEIGHBOR software that identified 816 genomic positions as rel-evant for discriminating genotypes. A 4L tiling strategy was retained for exhaus-tive resequencing, using, for each position, a set of four probes differing only at position 12, where A, C, G, or T is present. To take into account the genetic variability of the virus, several sets of four probes have usually been designed to identify a single position. Each set, referred to as a tile, includes polymorphisms that have been detected in the vicinity of the position of interest. We used the standard nomenclature of Stuyver et al. (31) for codon numbering in the rt region of the Pol gene. Mutants in BCP are designated according to their genomic nucleotide positions, which start with the 4th nucleotide of the (hypo-thetical) EcoRI site.
Samples.Samples were provided by Azienda Ospedaliera (Pisa, Italy), the Intercollegiate Faculty of Biotechnology (Gdansk, Poland), and CEPEM-IPEP ATRO (Porto Velho, Brazil) and were characterized by Sanger sequencing covering the pre-S1, pre-S2, S, rt, BCP, pre-C, C, and X regions. Sequences were aligned for codon identification and genotype determination.
Thirty-seven plasmids encoding rare rt mutations, as well as artificial mixtures of mutants, were provided by INSERM U871, Lyon, France. These plasmids (derived from plasmid pTriEXModHBV) contain 1.1 genomes of either wild-type (WT) HBV or the same genome engineered to introduce the mutations using the Quick-Change kit (Stratagene, La Jolla, CA) (2).
DNA extraction, amplification, labeling, and hybridization. DNA was ex-tracted from sera and amplified in a duplex PCR as previously described (34). If the two bands with expected sizes of 1.5 and 1.7 kbp were not detected by agarose gel electrophoresis, an alternative nested-PCR protocol generating a 741-bp amplicon in rt/S from the 1.7-kbp amplicon was used with the following primers:
5⬘-AAGGTATGTTGCCCCGTTTGTC-3⬘and 5⬘-GGGTTGCGTCAGCAAAC
ACT-3⬘. The amplification mixture was composed of MgCl2 buffer, 2 mM;
deoxynucleoside triphosphates (dNTPs), 0.3 mM; and Roche Fast-StartTaqPol
enzyme, 2 U. Amplification required 40 cycles at 93°C for 30 s, 48°C for 30 s, and 68°C for 1 min, finishing with 68°C for 7 min. Labeling and cleavage of PCR
fragments were done by successively adding 5l of RNase-free water, 5l of
PCR product, 5l of M bis-biotin-phenylmethyl-diazomethyl (bis-bioPDAM)
(bioMe´rieux, Marcy l’Etoile, France), and 5l of 20 mM HCl and incubating
them for 25 min at 95°C. The labeled fragments were purified, hybridized on the microarray, and stained as described previously (37). The microarrays were immediately scanned at 570 nm using the GS3000 scanner and GCOS software (Affymetrix, Santa Clara, CA).
Data interpretation.In a set of 4 probes designed for a given nucleotide, the signal of a single probe is considered significant and is retained if it is at least 1.2 times higher than the other three after subtraction of the background signal. There is no need for a specific internal calibrator. Data interpretation is made using the average fluorescence intensity of all retained probes, identified by their names and the corresponding position of the interrogated base on the genome.
The DNAEM software (bioMe´rieux, Marcy-l’Etoile, France) was used to run a
computer engine to translate fluorescence intensities into sequence information by automatically selecting the most probable nucleotide at each interrogated position. The parameters of the computer engine were optimized to provide the highest global concordance with Sanger sequencing on a panel of samples. The software performs two distinct analyses: mutation identification and genotype determination. For mutation detection in coding regions, the retained amino acid is the one with the highest score after assembly of the 3 bases of a given codon. Genotype identification scores (Id scores) were obtained by comparing the experimental data obtained with a sample to the reference sequence of each genotype (from A to H) at 816 positions selected in the genome alignments because they allowed the highest discrimination between genotypes. The Id score for each genotype was the percentage of concordant bases between the reference sequence and the test sequence. The retained genotype was the one with the highest Id score. A synthetic report was generated containing sample informa-tion, genotyping results, and mutations detected for the sample. The whole process from DNA extraction to interpretation report can be done within a single working day.
RESULTS
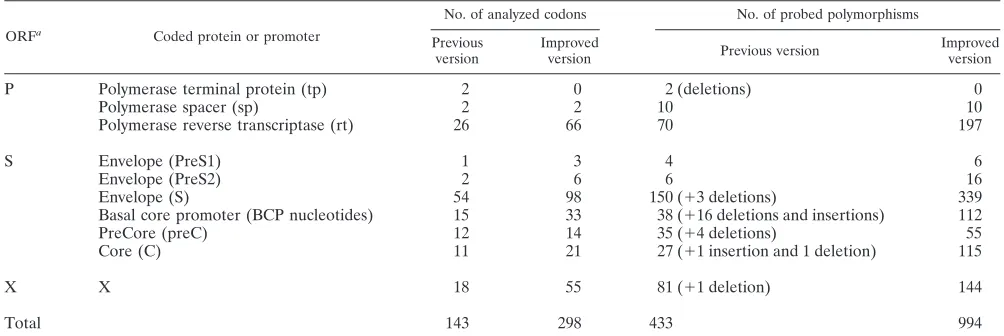
Probes were designed to detect 994 mutants located at 298 genomic positions along the genome in the S, C, P, and X genes (Table 1). The complete list of mutations is available at http://www.gabriel-network.org/?-publications-. Compared to the previous version of the assay (34), this version contains probes for the analysis of 155 new positions and the detection of 561 additional polymorphisms. Insertions and deletions that were included in the old version were removed because their reliable detection is not possible using the current software version. In addition, sequences of the newly described geno-type H were introduced into the alignment, and corresponding probes were added to the array.
Analytical and reproducibility performance. The average signal-to-background ratio of a typical experiment at 66 posi-tions in the rt region was estimated to be approximately 50. As shown by agarose gel electrophoresis, the duplex PCR protocol generated the expected bands from 62% of the samples (118 out of the 190 samples used to evaluate genotyping perfor-mances; see below). When this was not the case, especially in samples with less than 5,000 copies of the HBV genome/ml, we used an alternative nested-PCR protocol that allowed geno-typing when the viral load was low, including in 6 samples with fewer than 400 copies/ml (Fig. 1). Furthermore, this protocol allows the identification of the most important mutations in the rt and S regions.
Reproducibility was evaluated by testing two samples (one genotype A and one genotype D). Each specimen was tested 16 times by two operators using two batches of reagents. The coefficients of variation on the fluorescent signals obtained with all probes varied between 9 and 10% (data not shown). The coefficients of variation were not higher than 3% for genotype Id scores. We observed an impact of the operator within the series obtained with the genotype A sample, result-ing in a significantly higher coefficient of variation (2.6%) than was obtained with the other sample. Gel electrophoresis showed that this impact was due to lower amplification effi-ciency in one series by one operator (data not shown).
on May 16, 2020 by guest
http://jcm.asm.org/
Genotyping performance.One hundred ninety samples were used to evaluate genotyping performance. The viral loads were available for 142 of them. Figure 1 shows that samples con-taining less than 400 genome copies/ml could be analyzed and provided concordant results between the microarray and the reference technique. The whole duplex PCR protocol could amplify 118 samples, and the rt/S PCR protocol was used to amplify the other 72. A genotype was identified for all samples. Table 2 shows that mean Id scores varied between 89.3 (geno-type A) and 55.2 (geno(geno-type F). The mean ratio between the highest Id score and the one immediately following was at least 1.17, confirming the discrimination capacity of the assay. Se-quencing and the microarray gave concordant results for 172 of the 183 samples with a single expected genotype (94.0%). Al-though the genotyping algorithm is currently not optimized to identify multiple genotypes, in 6 out of 7 samples with a mix-ture of genotypes, the assay detected one of the two expected genotypes. The overall concordance was 93.7%. Discrepant results were observed for 12 samples, including one sample with a mixture of genotypes, most of them identified as geno-type A by sequencing. In 4 out of these 12 samples, the Id score was low (below 60). Nine out of 12 discrepancies were ob-served with the whole-genome PCR protocol and 3/12 with the rt/S 740-bp nested-PCR protocol, suggesting that reducing the size of the segment used for genotyping had no significant impact on the quality of results. The initial microarray result was confirmed upon retesting of all 12 samples. For 9/12
dis-crepant samples, a PCR product was available for retesting by sequencing, alignment, and BLAST on the NCBI website in rt/S. The initial sequencing result was confirmed in 7 out of 9 samples. In the other two samples, retesting did not confirm the initial sequencing result or the microarray result.
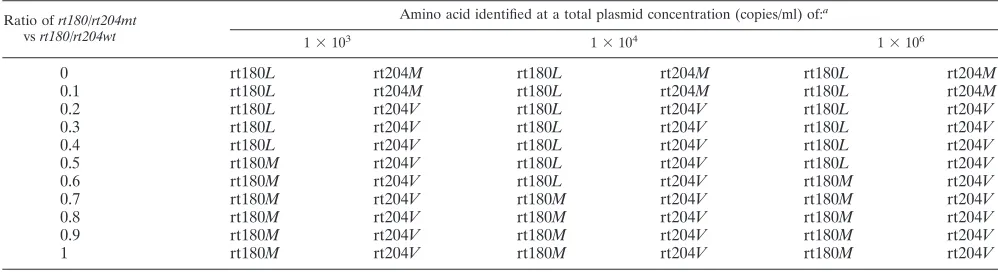
[image:3.585.41.543.81.249.2]Mutant detection in mixed populations. To evaluate the capacity of the reagent to detect mixed populations of viruses and emergence of resistance mutations, we tested noninfected plasma spiked with different ratios of 2 plasmids with either a wild-type HBV genome or mutant codons at positions rt180 and rt204 (2). The total plasmid concentrations in these sam-ples varied from 10e3 to 10e6 copies/ml. Table 3 shows that the results were different according to the position. Depending on the viral load, the highest identification score was obtained for the mutant rtL180M when it represented 50 to 70% of the mixture. At position rt204, the assay detected the valine mu-tant when it represented as little as 20% of the mixture, what-ever the viral load. In the latter case, the microarray had a bias to select viruses with a valine at position rt204.
TABLE 1. Numbers of analyzed positions and polymorphisms
ORFa
Coded protein or promoter
No. of analyzed codons No. of probed polymorphisms
Previous version
Improved
version Previous version
Improved version
P Polymerase terminal protein (tp) 2 0 2 (deletions) 0
Polymerase spacer (sp) 2 2 10 10
Polymerase reverse transcriptase (rt) 26 66 70 197
S Envelope (PreS1) 1 3 4 6
Envelope (PreS2) 2 6 6 16
Envelope (S) 54 98 150 (⫹3 deletions) 339
Basal core promoter (BCP nucleotides) 15 33 38 (⫹16 deletions and insertions) 112
PreCore (preC) 12 14 35 (⫹4 deletions) 55
Core (C) 11 21 27 (⫹1 insertion and 1 deletion) 115
X X 18 55 81 (⫹1 deletion) 144
Total 143 298 433 994
a
[image:3.585.302.541.539.675.2]ORF, open reading frame.
FIG. 1. Concordance between sequencing and the microarray for genotyping according to viral load.
TABLE 2. Genotyping performance
Genotype (sequencing)
No. of samples
Mean Id score
Highest/ second-highest Id score ratio
Sensitivity
(%)a
Specificity
(%)b
A 54 89.3 1.2 87 99.3
B 17 72.1 1.24 94.1 100
C 15 70.2 1.17 93.3 96
D 54 70.3 1.26 96.3 98.5
E 23 61.5 1.23 100 99.4
F 12 55.2 1.26 100 100
G 1 70.2 1.63 100 99.5
H 7 55.2 1.28 100 100
A⫹C 3 84.6c 1.13 66.7 100
A⫹G 4 48.9d 1.25 100 100
a
Sensitivity was calculated as the percentage of samples referenced as a given genotype by sequencing that were identified as the same genotype by the array.
b
Specificity was calculated as the percentage of samples identified as a given genotype by the array and a different genotype by sequencing.
c
Detected as A or C.
d
Detected as A or G.
on May 16, 2020 by guest
http://jcm.asm.org/
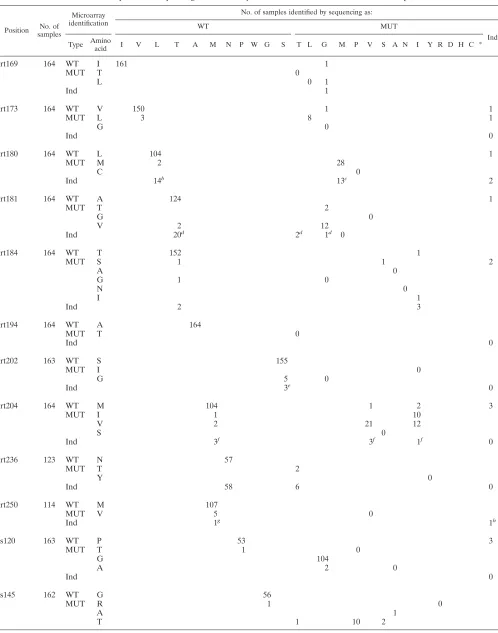
[image:3.585.44.284.611.705.2]Mutation detection. A panel of 253 samples was used to analyze the performance of the microarray for the identifica-tion of nucleotide and amino acid changes in HBV genomes. A total of 20,771 codons were resequenced with the microarray in the sample panel. Considering that 298 codons are rese-quenced by the microarray for each sample, this assay can potentially detect changes at an additional 54,623 positions. Results were considered indeterminate by the microarray when no amino acid could be identified, i.e., when no probe in the set designed to identify each nucleotide of a codon gener-ated a fluorescent signal significantly higher than the other three (0.57% of 20,771 codons, including 63 indeterminate results at position rt236) or when a sample sequence contained an unexpected polymorphism that was not included in the design of the probes. The observed indeterminate rates were 1.2 and 7.1%, respectively, for sequencing and the microarray. The percentage of concordant results between the two tech-niques was 95.7%. This percentage was 92.8% for the previous version of the array (34). For the rt (66 positions), S (98 positions), and pre-C (14 positions) regions, the concordances were, respectively, 96.5%, 97.9%, and 93.6%. These percent-ages were 94.1%, 92.0%, and 94.6% with the previous version. The concordance percentages were 98.6% for X (55 positions), 95.4% for C (21 positions), and 70.8% for pre-S2 (6 positions). No reference results were available for pre-S1. BCP posi-tions were not included in this analysis, since, although it over-laps the X reading frame, by itself it is noncoding. Due to the large number of codons analyzed for mutations, every sample tested produced at least one discrepancy. Since it was not feasible to retest every sample, we opted not to retest samples producing discrepant results. As the assay is able to identify 994 mutations, it was not possible to assemble a panel of samples covering all of them. We established a short list of positions with the highest relevance for HBV biology and dis-ease monitoring (10, 23, 37). The results obtained at these positions are presented in Table 4 and detailed below.
Lamivudine, emtricitabine, telbivudine, and famciclovir re-sistance.At positions rt169, rt173, rt180, and rt204, sequencing and the microarray agreed on 596 codons (519 wildtype and 77 mutants) out of 656 (90.9%). The indeterminate rates were 5.3 and 1.7% for the microarray and sequencing, respectively. The microarray detected 10 additional mutants, 8 of them
identi-fied as wild type and 2 as indeterminate by sequencing. Se-quencing detected 21 additional mutants, 4 of them identified as wild type and 17 as indeterminate by the microarray (most of them at position rt180). For codon rt173, which was also analyzed by Tran et al., (34), the concordance percentage in-creased from 96.1 to 96.3%. For position rt204, which was found to be difficult in the previous test, this percentage in-creased from 60.8 to 82.3%. Conversely, the concordance was higher with the previous version at position rt180 (93.5% ver-sus 81.7%), reflecting the higher number of indeterminate results for this codon with the improved version.
Adefovir resistance. At positions rt181 and rt236, the two techniques agreed on 197 codons (181 wild type and 16 mu-tants) out of 287 (68.6%). The indeterminate rates were 30.3 and 0.3% for the microarray and sequencing, respectively. The microarray detected 2 additional mutants identified as wild type by sequencing, whereas sequencing detected 9 additional mutants, all of them indeterminate with the microarray. At position rt236, we observed that the microarray-based assay correctly detected codons with a C at the third position (either the wild-type AAC [Asn] or the mutant ACC [Thr]) but was unable to differentiate between the codons with a T at the third position (wild-type AAT [Asn] and mutant ACT [Thr]). This resulted in 64 indeterminate results (no amino acid identified) and may be related to the low GC content in this region of the HBV genome, which may lower hybridization efficiency (see Discussion).
Entecavir resistance. At positions rt184, rt202, and rt250, the two techniques agreed on 416 codons (414 wild type and 2 mutants) out of 441 (93.9%). The indeterminate rates were 2.3 and 0.7%, respectively, for the microarray and sequencing. The microarray detected 14 additional mutants (12 wild type and 2 indeterminate by sequencing). Sequencing detected 4 addi-tional mutants (2 wild type and 2 indeterminate by microar-ray).
Tenofovir resistance. At position rt194, the concordance between the two techniques was 100% for the detection of the Ala wild-type amino acid.
[image:4.585.42.541.81.217.2]Globally, in the rt region, microarray and sequencing to-gether detected 109 mutants. The microarray detected 26 ad-ditional mutants (85% of them wild type by sequencing), TABLE 3. Detection of wild-type and mutant mixtures by the microarray
Ratio ofrt180/rt204mt
vsrt180/rt204wt
Amino acid identified at a total plasmid concentration (copies/ml) of:a
1⫻103
1⫻104
1⫻106
0 rt180L rt204M rt180L rt204M rt180L rt204M
0.1 rt180L rt204M rt180L rt204M rt180L rt204M
0.2 rt180L rt204V rt180L rt204V rt180L rt204V
0.3 rt180L rt204V rt180L rt204V rt180L rt204V
0.4 rt180L rt204V rt180L rt204V rt180L rt204V
0.5 rt180M rt204V rt180L rt204V rt180L rt204V
0.6 rt180M rt204V rt180L rt204V rt180M rt204V
0.7 rt180M rt204V rt180M rt204V rt180M rt204V
0.8 rt180M rt204V rt180M rt204V rt180M rt204V
0.9 rt180M rt204V rt180M rt204V rt180M rt204V
1 rt180M rt204V rt180M rt204V rt180M rt204V
aTwo plasmids with the whole HBV genome were constructed:rt180/rt204wt, with leucine and methionine at positions rt180 and rt204, respectively, andrt180/rt204mt,
with methionine and valine at positions rt180 and rt204, respectively. Mixtures of the two plasmids were assembled at different total plasmid concentrations and ratios ofrt180/rt204mtversusrt180/rt204wt.The italicized letters indicate the amino acids that were identified by the microarray.
on May 16, 2020 by guest
http://jcm.asm.org/
TABLE 4. Comparison of sequencing and microarray for detection of amino acids at 16 selected positionsa
Position No. of
samples
Microarray identification
No. of samples identified by sequencing as:
WT MUT
Ind
Type Amino
acid I V L T A M N P W G S T L G M P V S A N I Y R D H C *
rt169 164 WT I 161 1
MUT T 0
L 0 1
Ind 1
rt173 164 WT V 150 1 1
MUT L 3 8 1
G 0
Ind 0
rt180 164 WT L 104 1
MUT M 2 28
C 0
Ind 14b 13c 2
rt181 164 WT A 124 1
MUT T 2
G 0
V 2 12
Ind 20d 2d 1d 0
rt184 164 WT T 152 1
MUT S 1 1 2
A 0
G 1 0
N 0
I 1
Ind 2 3
rt194 164 WT A 164
MUT T 0
Ind 0
rt202 163 WT S 155
MUT I 0
G 5 0
Ind 3e 0
rt204 164 WT M 104 1 2 3
MUT I 1 10
V 2 21 12
S 0
Ind 3f 3f 1f 0
rt236 123 WT N 57
MUT T 2
Y 0
Ind 58 6 0
rt250 114 WT M 107
MUT V 5 0
Ind 1g 1h
s120 163 WT P 53 3
MUT T 1 0
G 104
A 2 0
Ind 0
s145 162 WT G 56
MUT R 1 0
A 1
T 1 10 2
Continued on following page
on May 16, 2020 by guest
http://jcm.asm.org/
whereas sequencing detected 34 additional mutants (44% wild type with the microarray).
Vaccine and immune therapy escape.At position s120 (wild-type Pro), the two techniques agreed on 157 codons out of 163 (96.3%). The microarray detected 1 additional variant: a Thr that was identified as Pro by sequencing. Two variants were identified as Gly by sequencing but as Ala with the microarray. Finally, the results were indeterminate for 3 samples by se-quencing and there were no indeterminates with the microar-ray. Concordance increased from 90.9% to 96.3% with this version of the assay compared to the previous one (34).
At position s145 (wild-type Gly), the concordance rate was 87.0%. The microarray detected 1 Arg mutant that was tified as Gly by sequencing. Different amino acids were iden-tified by the two techniques in 14 samples. Finally, sequencing gave an indeterminate result for 5 samples, whereas the mi-croarray had no indeterminate result. Concordance increased from 75.2 to 87% between the two versions.
In the S region, the two techniques together detected 189 variant amino acids. The microarray detected 2 additional vari-ants, including 1 G145R mutant.
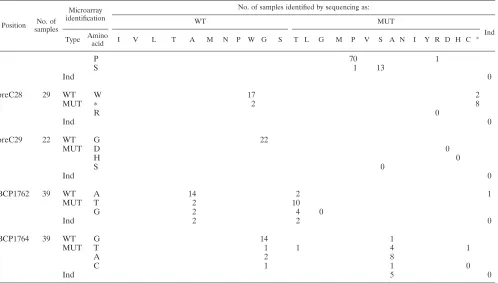
PreC mutants: pre-C28 and pre-C29.At position pre-C28, two additional stop codons were detected with the microarray
on one hand and sequencing on the other hand. At positions pre-C28 and pre-C29, the two techniques agreed on 47 codons out of 51 (92.2%).
Basal core promoter.At positions BCP1762 and BCP1764, sequencing and the microarray agreed on 47 codons out of 78 (60.3%). This concordance was 57.6% with the preceding ver-sion of the assay (34). The microarray detected 8 additional mutants, all wild type by sequencing. Sequencing also detected 8 additional mutants (3 wild type and 5 indeterminate with the microarray). The indeterminate rates were 11.5% and 1.3%, respectively, for the microarray and sequencing.
DISCUSSION
The improved version of the microarray assay includes sev-eral new features compared to the previous version (24, 34) (Table 1).
[image:6.585.46.544.81.364.2]Probes have been added to identify the recently described genotype H and 561 additional important mutations, such as rtN236T/Y, which signifies resistance to adefovir. Overall, the microarray has been designed to detect 994 mutations at 298 positions along the HBV genome, making it a compre-hensive tool to monitor disease evolution and treatment TABLE 4—Continued
Position No. of
samples
Microarray identification
No. of samples identified by sequencing as:
WT MUT
Ind
Type Amino
acid I V L T A M N P W G S T L G M P V S A N I Y R D H C *
P 70 1
S 1 13
Ind 0
preC28 29 WT W 17 2
MUT ⴱ 2 8
R 0
Ind 0
preC29 22 WT G 22
MUT D 0
H 0
S 0
Ind 0
BCP1762 39 WT A 14 2 1
MUT T 2 10
G 2 4 0
Ind 2 2 0
BCP1764 39 WT G 14 1
MUT T 1 1 4 1
A 2 8
C 1 1 0
Ind 5 0
a
Samples with a reference Sanger sequence were tested with the microarray. The numbers of samples with a reference differ according to the codon and are indicated
for each position. For each codon, either a wild type or one of the possible mutants (MUT) was identified by sequencing or the microarray. Ind, indeterminate;ⴱ, stop
codon.
b
Eleven arginines, 2 phenylalanines, 1 proline.
c
Twelve arginines, 1 lysine.
d
Twenty-three prolines.
e
One valine, 1 cysteine and 1 glutamic acid.
f
Seven glycine.
g
Alanine.
h
Isoleucine by sequencing and threonine with the microarray.
on May 16, 2020 by guest
http://jcm.asm.org/
efficacy. It will also be useful to rapidly detect a source of contamination or the spread of viral strains that resist treat-ment or vaccination. Finally, it will help researchers to gain insights into pathology mechanisms. The microarray com-bines a PCR approach that allows the amplification of the whole virus genome in a single tube with a high multidetec-tion capacity, providing significant advantages over alterna-tive techniques. Classical Sanger sequencing requires at least 5 amplification reactions to cover the same number of genome positions. Line probe assays can detect only a lim-ited number of mutations. Finally, the improved version includes new software and computer engine versions that allow an automated analysis of mutations. This improve-ment avoids human errors during the selection of tiles in a list, as in the first version of the assay. It is also an improve-ment over Sanger sequencing, which requires human read-ing and interpretation of electropherograms.
Tran et al., (34) have reported that natural polymor-phisms, perhaps underrepresented in the sequence align-ments, in the vicinity of interrogated codons may have an impact on the identification capacity of the microarray as-say. This was especially the case at positions rt204 and s145. Probes with the variant sequences were added to solve this problem, and they improved performance significantly at both positions. On the other hand, the improved assay per-formed less well for the detection of polymorphisms at po-sition rt180: the observed concordance with sequencing was reduced from 93.5% to 82.3%. At rt180, the array often detects an arginine, whereas sequencing identifies the ex-pected wild-type (Leu) or mutant (Met) codon. This is prob-ably due to the fact that Arg and Leu can be encoded by an unusually large number of codons (CGN and AGR for Arg; CTN and TTR for Leu). Residue rt180L is usually encoded by a CTC codon. Through G/T wobble base pairing, the CGC codon for Arg can stably hybridize to the CTC codon for Leu. Similarly, the AGG codon for Arg can hybridize to the ATG codon for Met. This problem can probably be overcome by analyzing the fluorescence values for probes containing the Arg CGC and AGG codons.
Overall, the concordance between sequencing and the mi-croarray improved from 92.8% (tested on 11,335 codons) to 95.7% (tested on 20,771 codons) between the two versions of the assay.
Although the indeterminate rate was lower for sequencing on our panel, it may be underestimated, as we included mostly specimens with available reference sequence data. We do not know how many samples had an indeterminate or wrong result among all those initially analyzed by sequenc-ing. The Sanger sequencing method has significant error rates. For example, an error rate of approximately 7% has been reported for Sanger sequencing of human diploid DNA (25, 30).
Indeterminate microarray results are more frequent at some positions (rt180, rt181, rt236, BCP1762, BCP1764, and s120), probably resulting from a weak hybridization effi-ciency that does not allow one probe to be distinguished among the four or generates an unexpected result. A low GC content is known to reduce hybridization efficiency. This is the case at positions rt236, BCP1762, and BCP1764, where the percentage of guanine and cytosine bases (%GC;
Chargaff coefficient) is around 30% in more than two-thirds of the designed probes whereas this percentage is close to 50% in the rest of the genome. G/T wobble base pairing may also affect the results. To reduce the possibility of wrong results, we established a cutoff fluorescence value below which results are automatically marked as indeterminate. A possible solution to overcome this difficulty and improve performance at these positions in a future version of the microarray would be to synthesize longer probes (25-mer), at least in areas with low GC content. Although not sensitive to hybridization problems, sequencing also has technical problems linked to the enzymes, which are especially af-fected by single-nucleotide stretches. Cross-hybridizations generating an indeterminate or a false result due to second-ary structures, palindromes, or nonspecific binding to probes with similar sequences may also occur. However, looking for such sequences by BLAST was not successful (data not shown).
Multiple viruses with different sequences may also be the origin of discrepant results between sequencing and the microarray. Sequencing may preferentially detect one virus of the mixture while the microarray detects another. We observed that the microarray preferentially detected Val compared to Met at position rt204 in a mixture of plasmids designed to simulate a mixture of viruses (Table 2). This is probably due to the fact that the Val mutation usually cre-ates a GTG codon, and hybridization to this probe is intrin-sically superior to hybridization with a probe containing the Met ATG codon. However, we have no explanation as to why 12 samples of our panel have a Val (codons GTN) at that position whereas sequencing detects an isoleucine (codons ATY) (Table 4).
A major obstacle to the use of this tool for routine clinical diagnosis applications is the difficulty of assembling specimen panels to validate its sensitivity and specificity for the detection of all claimed mutations. However, this is also the case for sequencing, for which performance also varies according to the codons. Repeated sequences (35) and insertions and deletions longer than 5 bp (36) were not encountered in the panel used for our study.
A limitation of our study regarding genotyping determina-tion is that only a few specimens have been tested for geno-types G and H. However, this is representative of the preva-lence of these subtypes worldwide (13, 21).
The concordance between sequencing and the microarray observed in this study for genotyping (94% on a panel of 183 samples) is lower than that reported by Tran et al. (34) and Pas et al. (24) using the previous version of the microarray (98% and 97.5%, respectively). This slight variation may simply be due to sampling.
There is no explanation for the 12 discrepant results ob-served between sequencing and the microarray in this study.
The existence of viruses that are recombinant between dif-ferent genotypes has been reported (9, 12, 29, 32). Sequencing usually targets only one genomic region (rt/S or pre-C/BCP/C) and may miss recombinant viruses that include sequences cor-responding to another genotype in other genomic regions. On the other hand, the microarray uses 816 positions along the whole HBV genome and theoretically may be able to detect
on May 16, 2020 by guest
http://jcm.asm.org/
recombinant viruses, although we did not use specimens con-taining such viruses in our evaluation.
The presence of several viruses with different genotypes, due to multiple HBV infections, may also explain differences be-tween the two techniques. Sequencing and the microarray may preferentially identify only one of the viruses.
We believe that the algorithm we propose for genome am-plification makes the assay valuable for the intended clinical use. It allows full analysis of most specimens with more than 5,000 genome copies/ml. For those with lower viral loads, down to approximately 400 genome copies/ml, genotype determina-tion and detecdetermina-tion of most resistance mutadetermina-tions is still possible. Notably, all specimens with a viral load below 1,000 copies/ml could be genotyped, whereas 2/3 of those specimens could not be with the previous version of the assay (34). Recent recom-mendations of the European Association for the Study of the Liver state that under interferon therapy, virological response is effective below 2,000 IU/ml (approximately 10,000 copies of the HBV genome/ml), and under nucleotide therapy, virolog-ical breakthrough is considered to have occurred if the viral load increases by more than 1,000 IU/ml (or 5,000 copies/ml) above the nadir (7).
Another limitation of this study is the lack of clinical infor-mation on the patients from whom samples were taken. How-ever, it was a comparison of the microarray assay and sequenc-ing on a panel of stored samples, and validation of the clinical utility of the assay requires additional work.
Our work shows that the microarray technology has charac-teristics and performance that make it a valuable tool for clinical, epidemiological, and research applications regarding hepatitis B virus. This technology has been used to analyze the genome of the virus in cohorts of patients with dual HIV-HBV infections (14) and in patients from sub-Saharan Africa (35). The present version of the assay implements several improve-ments, and although problems linked to the low GC content observed at some positions reduce the performance for the diagnosis of resistance to adefovir, as well as mutations in the BCP, its main advantage compared to Sanger sequencing is that it can provide exhaustive information at multiple positions along the whole 3.2-kb genome in a single reaction.
ACKNOWLEDGMENTS
We thank Christian Pichoud (INSERM, Unit 871, Lyon, France) for recombinant plasmids; Maurizia Brunetto (Azienda Ospedaliera, Pisa, Italy), Krzysztof Bielawski (Intercollegiate Faculty of Biotechnology, Gdansk, Poland), and Deusilene Viera and Juan Miguel Villalobos Salcedo (Centro de Pesquisa em Medicina Tropical and Instituto de Pesquisa em Patologias Tropicais, Porto Velho, Brazil) for clinical samples and providing sequences; and Thibault Martin, Fre´de´rick Las-net, Alain Laurent, and Ali Laayoun (bioMe´rieux, Grenoble, France) for cleavage and labeling optimization.
This work was supported by grants from the European Community (ViRgil Excellence Network, EC FP6, contract LSHM-CT-2004-503359).
REFERENCES
1.Arauz-Ruiz, P., H. Norder, B. H. Robertson, and L. O. Magnius.2002. Genotype H: a new Amerindian genotype of hepatitis B virus revealed in
Central America. J. Gen. Virol.83:2059–2073.
2.Brunelle, M. N., A. C. Jacquard, C. Pichoud, D. Durantel, S. Carrouee-Durantel, J. P. Villeneuve, C. Trepo, and F. Zoulim.2005. Susceptibility to antivirals of a human HBV strain with mutations conferring resistance to
both lamivudine and adefovir. Hepatology41:1391–1398.
3.Brunetto, M. R., M. Giarin, G. Saracco, F. Oliveri, P. Calvo, G. Capra, A.
Randone, M. L. Abate, P. Manzini, M. Capalbo, et al.1993. Hepatitis B virus unable to secrete e antigen and response to interferon in chronic hepatitis B.
Gastroenterology105:845–850.
4.Buti, M., I. Elefsiniotis, R. Jardi, V. Vargas, F. Rodriguez-Frias, M. Schap-per, S. Bonovas, and R. Esteban.2007. Viral genotype and baseline load predict the response to adefovir treatment in lamivudine-resistant chronic
hepatitis B patients. J. Hepatol.47:366–372.
5.Cooreman, M. P., G. Leroux-Roels, and W. P. Paulij.2001. Vaccine- and hepatitis B immune globulin-induced escape mutations of hepatitis B virus
surface antigen. J. Biomed Sci.8:237–247.
6.Delaney, W. E. T., and K. Borroto-Esoda.2008. Therapy of chronic hepatitis
B: trends and developments. Curr. Opin. Pharmacol.8:532–540.
7.European Association for the Study of the Liver.2009. EASL clinical
prac-tice guidelines: management of chronic hepatitis B. J. Hepatol.50:227–242.
8.Gu¨nther, S.2006. Genetic variation in HBV infection: genotypes and
mu-tants. J. Clin. Virol.36(Suppl. 1):S3–S11.
9.Hannoun, C., K. Krogsgaard, P. Horal, and M. Lindh.2002. Genotype mixtures of hepatitis B virus in patients treated with interferon. J. Infect. Dis.
186:752–759.
10.Jardi, R., F. Rodriguez, M. Buti, X. Costa, A. Valdes, H. Allende, M. Schaper, R. Galimany, R. Esteban, and J. Guardia.2004. Mutations in the basic core promoter region of hepatitis B virus. Relationship with precore variants and HBV genotypes in a Spanish population of HBV carriers.
J. Hepatol.40:507–514.
11.Kao, J. H., N. H. Wu, P. J. Chen, M. Y. Lai, and D. S. Chen.2000. Hepatitis
B genotypes and the response to interferon therapy. J. Hepatol.33:998–1002.
12.Kay, A., and F. Zoulim. 2007. Hepatitis B virus genetic variability and
evolution. Virus Res.127:164–176.
13.Kramvis, A., M. Kew, and G. Francois.2005. Hepatitis B virus genotypes.
Vaccine23:2409–2423.
14.Lacombe, K., V. Massari, P. M. Girard, L. Serfaty, J. Gozlan, G. Pialoux, P. Mialhes, J. M. Molina, C. Lascoux-Combe, D. Wendum, F. Carrat, and F. Zoulim.2006. Major role of hepatitis B genotypes in liver fibrosis during
coinfection with HIV. AIDS20:419–427.
15.Liu, S., H. Zhang, C. Gu, J. Yin, Y. He, J. Xie, and G. Cao.2009. Associations between hepatitis B virus mutations and the risk of hepatocellular
carci-noma: a meta-analysis. J. Natl. Cancer Inst.101:1066–1082.
16.Locarnini, S.2003. Hepatitis B viral resistance: mechanisms and diagnosis.
J. Hepatol39(Suppl. 1):S124–S132.
17.Lok, A. S., F. Zoulim, S. Locarnini, A. Bartholomeusz, M. G. Ghany, J. M. Pawlotsky, Y. F. Liaw, M. Mizokami, and C. Kuiken.2007. Antiviral drug-resistant HBV: standardization of nomenclature and assays and
recommen-dations for management. Hepatology46:254–265.
18.Lok, A. S., F. Zoulim, S. Locarnini, A. Mangia, G. Niro, H. Decraemer, G. Maertens, F. Hulstaert, K. De Vreese, and E. Sablon.2002. Monitoring drug resistance in chronic hepatitis B virus (HBV)-infected patients during lami-vudine therapy: evaluation of performance of INNO-LiPA HBV DR assay.
J. Clin. Microbiol.40:3729–3734.
19.Lupberger, J., and E. Hildt.2007. Hepatitis B virus-induced oncogenesis.
World J. Gastroenterol.13:74–81.
20.Nguyen, D. H., L. Ludgate, and J. Hu.2008. Hepatitis B virus-cell
interac-tions and pathogenesis. J. Cell. Physiol.216:289–294.
21.Norder, H., A. M. Courouce, P. Coursaget, J. M. Echevarria, S. D. Lee, I. K. Mushahwar, B. H. Robertson, S. Locarnini, and L. O. Magnius.2004. Ge-netic diversity of hepatitis B virus strains derived worldwide: genotypes,
subgenotypes, and HBsAg subtypes. Intervirology47:289–309.
22.Ogata, N., R. H. Miller, K. G. Ishak, and R. H. Purcell.1993. The complete nucleotide sequence of a pre-core mutant of hepatitis B virus implicated in fulminant hepatitis and its biological characterization in chimpanzees.
Vi-rology194:263–276.
23.Osiowy, C.2006. Detection of HBsAg mutants. J. Med. Virol.78(Suppl.
1):S48–S51.
24.Pas, S. D., N. Tran, R. A. de Man, C. Burghoorn-Maas, G. Vernet, and H. G. Niesters.2008. Comparison of reverse hybridization, microarray, and sequence
analysis for genotyping hepatitis B virus. J. Clin. Microbiol.46:1268–1273.
25.Quinlan, A. R., and G. T. Marth.2007. Primer-site SNPs mask mutations.
Nat. Methods4:192.
26.Sato, S., K. Suzuki, Y. Akahane, K. Akamatsu, K. Akiyama, K. Yunomura, F. Tsuda, T. Tanaka, H. Okamoto, Y. Miyakawa, and M. Mayumi.1995. Hepatitis B virus strains with mutations in the core promoter in patients with
fulminant hepatitis. Ann. Intern. Med.122:241–248.
27.Shaw, T., A. Bartholomeusz, and S. Locarnini.2006. HBV drug resistance:
mechanisms, detection and interpretation. J. Hepatol.44:593–606.
28.Sheldon, J., B. Rodes, F. Zoulim, A. Bartholomeusz, and V. Soriano.2006. Mutations affecting the replication capacity of the hepatitis B virus. J. Viral
Hepat.13:427–434.
29.Simmonds, P., and S. Midgley.2005. Recombination in the genesis and
evolution of hepatitis B virus genotypes. J. Virol.79:15467–15476.
30.Stephens, M., J. S. Sloan, P. D. Robertson, P. Scheet, and D. A. Nickerson.
2006. Automating sequence-based detection and genotyping of SNPs from
diploid samples. Nat. Genet.38:375–381.
31.Stuyver, L. J., S. A. Locarnini, A. Lok, D. D. Richman, W. F. Carman, J. L.
on May 16, 2020 by guest
http://jcm.asm.org/
Dienstag, and R. F. Schinazi. 2001. Nomenclature for antiviral-resistant human hepatitis B virus mutations in the polymerase region. Hepatology
33:751–757.
32.Sugauchi, F., E. Orito, T. Ichida, H. Kato, H. Sakugawa, S. Kakumu, T. Ishida, A. Chutaputti, C. L. Lai, R. Ueda, Y. Miyakawa, and M. Mizokami.
2002. Hepatitis B virus of genotype B with or without recombination with
genotype C over the precore region plus the core gene. J. Virol.76:5985–
5992.
33.Tang, H., N. Oishi, S. Kaneko, and S. Murakami.2006. Molecular functions
and biological roles of hepatitis B virus x protein. Cancer Sci.97:977–983.
34.Tran, N., R. Berne, R. Chann, M. Gauthier, D. Martin, M. A. Armand, A. Ollivet, C. G. Teo, S. Ijaz, D. Flichman, M. Brunetto, K. P. Bielawski, C. Pichoud, F. Zoulim, and G. Vernet.2006. European multicenter evaluation of
high-density DNA probe arrays for detection of hepatitis B virus resistance
mutations and identification of genotypes. J. Clin. Microbiol.44:2792–2800.
35.Vray, M., J. M. Debonne, J. M. Sire, N. Tran, B. Chevalier, J. C. Plantier, F. Fall, G. Vernet, F. Simon, and P. S. Mb.2006. Molecular epidemiology of
hepatitis B virus in Dakar, Senegal. J. Med. Virol.78:329–334.
36.Weber, B.2005. Genetic variability of the S gene of hepatitis B virus: clinical
and diagnostic impact. J. Clin. Virol.32:102–112.
37.Zoulim, F.2004. Mechanism of viral persistence and resistance to nucleoside and nucleotide analogs in chronic hepatitis B virus infection. Antiviral Res.
64:1–15.
38.Zoulim, F., X. Zhang, C. Pichoud, and C. Trepo.1996. Heterogeneity of hepatitis B virus (HBV) core gene in a patient with HBV-associated cirrhosis
and serum negativity for anti-HBc. J. Hepatol.24:155–160.