0095-1137/10/$12.00 doi:10.1128/JCM.02014-09
Copyright © 2010, American Society for Microbiology. All Rights Reserved.
Development of a DNA Microarray for Detection and Serotyping of
Enterotoxigenic
Escherichia coli
䌤
Quan Wang,
1,2,3Suriguga Wang,
1,2,3Lothar Beutin,
4Boyang Cao,
1,2,3Lu Feng,
1,5,6and Lei Wang
1,2,3,5,6*
TEDA School of Biological Sciences and Biotechnology, Nankai University, TEDA,1Key Laboratory of Molecular Microbiology and
Technology2and The Engineering and Research Center for Microbial Functional Genomics and Detection Technology,3
Ministry of Education, Tianjin Key Laboratory of Microbial Functional Genomics,5and Tianjin Research Center for
Functional Genomics and Biochip,6Tianjin, China, and National Reference Laboratory for Escherichia coli,
Federal Institute for Risk Assessment (BfR), Diedersdorfer Weg 1, D-12277 Berlin, Germany4
Received 14 October 2009/Returned for modification 26 January 2010/Accepted 5 March 2010
Enterotoxigenic Escherichia coli (ETEC) is a common pathogen worldwide causing infectious diarrhea,
especially traveler’s diarrhea. Traditional physiological assays, immunoassays, and PCR-based methods for the detection of ETEC target the heat-labile enterotoxin and/or the heat-stable enterotoxin. Separate serotyping methods using antisera are required to determine the ETEC serogroup. In this study, we developed a DNA microarray that can simultaneously detect enterotoxin genes and the 19 most common O serogroup genes in ETEC strains. The specificity and reproducibility of this approach were verified by hybridization to 223 strains: 50 target
reference or clinical strains and 173 other strains, including those belonging to otherE. coliO serogroups and
closely related species. The sensitivity of detection was determined to be 50 ng of genomic DNA or 108CFU per ml
of organisms in pure culture. The random PCR strategy used in this study with minimal bias provides an effective alternative to multiplex PCR for the detection of pathogens using DNA microarrays. The assay holds promise for applications in the clinical diagnosis and epidemiological surveillance of pathogenic microorganisms.
EnterotoxigenicEscherichia coli(ETEC) is the leading bac-terial cause of infectious diarrhea in the developing world, causing infantile or cholera-like disease in all age groups (2). It is among the major etiologic agents, leading to an estimated 1.5 million deaths per year worldwide (13, 14). ETEC is also a major cause of traveler’s diarrhea (3, 8, 11) and the most common pathogen among the six recognized diarrheagenic categories ofE. coli, especially in the developing world (18). ETEC strains produce one or both of the following two toxins: heat-labile enterotoxin (LT) and heat-stable entero-toxin (ST). Two classes of STs—STa and STb—and two vari-ants of STa—STp (initially discovered in isolates from pigs) and STh (initially discovered in isolates from humans)—have been described. Theelt,estA, andestBgenes encode the entero-toxins LT, STa, and STb, respectively (6, 23, 26).
The O antigen comprises the outermost domain of the lipo-polysaccharide molecule and is attached to the core oligosac-charide on the surfaces of Gram-negative bacteria (20). O antigens are among the most variable cellular constituents, imparting antigenic specificity. The composition of the O chain differs from strain to strain; more than 180 O-antigen struc-tures are produced by differentE. colistrains (25). The most common O serogroups reported in ETEC are O6, O8, O11, O15, O25, O27, O78, O85, O114, O115, O126, O128, O139, O148, O149, O159, O166, O167, and O173 (5, 18, 19, 31).
Detection of ETEC has long relied on detection of the enterotoxins LT and/or ST by physiological assays and
immu-noassays, and serotyping has depended on assays using O-serogroup-specific antisera. These traditional approaches are slow and labor-intensive, and assays using antisera can be im-peded by cross-reactivity. PCR assays, which are more rapid, sensitive, and specific, have also been widely used for ETEC diagnosis (15, 24). However, molecular methods for the sero-typing of ETEC have not been developed.
Molecular detection and typing by PCR and microarray techniques have many advantages over traditional methods. DNA microarrays provide an efficient approach for the parallel detection and analysis of a large number of pathogenic micro-organisms. This technique has been applied to the detection of pathogens from all kinds of biological samples, including wa-ter, food, and soil (4, 7, 12, 17, 21).
In this study, we developed a DNA microarray for the de-tection and typing of ETEC. The genes encoding the entero-toxins LT and ST were used for the detection of ETEC, and the serogroup-specific geneswzxand/orwzywere used for the typing of the 19 most common ETEC O serogroups. The mi-croarray was examined for its specificity and sensitivity, and the findings of this study indicate that it is highly sensitive and reproducible.
MATERIALS AND METHODS
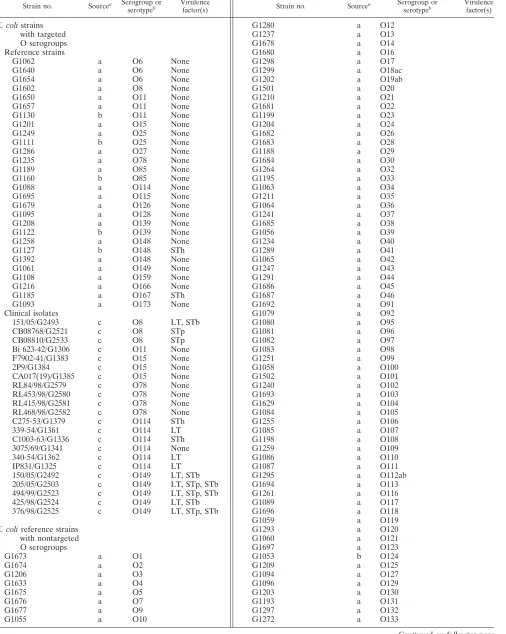
Bacterial strains.The 223 strains used in this study are listed in Table 1. They include 28 reference strains and 22 clinical strains of the 19 targetedE. coliO serogroups (O6, O8, O11, O15, O25, O27, O78, O85, O114, O115, O126, O128, O139, O148, O149, O159, O166, O167, and O173) and 150 reference strains of otherE. coliO serogroups. Also included in this study were 13 reference strains of differentShigellaO serogroups and 10 reference strains of differentSalmonella O serogroups. All strains were grown overnight in Luria-Bertani medium at 37°C with shaking.
Genomic DNA extraction.Bacterial genomic DNA was extracted using the TIANamp Bacteria DNA kit (Tiangen, Beijing, China).
* Corresponding author. Mailing address: TEDA School of Biolog-ical Sciences and Biotechnology, Nankai University, TEDA, Tianjin 300457, China. Phone: 86-22-66229588. Fax: 86-22-66229596. E-mail: [email protected].
䌤Published ahead of print on 29 March 2010.
2066
on May 16, 2020 by guest
http://jcm.asm.org/
TABLE 1. Strains used in this study
Strain no. Sourcea Serogroup or
serotypeb
Virulence
factor(s) Strain no. Source
a Serogroup or
serotypeb
Virulence factor(s)
E. colistrains G1280 a O12
with targeted G1237 a O13
O serogroups G1678 a O14
Reference strains G1680 a O16
G1062 a O6 None G1298 a O17
G1640 a O6 None G1299 a O18ac
G1654 a O6 None G1202 a O19ab
G1602 a O8 None G1501 a O20
G1650 a O11 None G1210 a O21
G1657 a O11 None G1681 a O22
G1130 b O11 None G1199 a O23
G1201 a O15 None G1204 a O24
G1249 a O25 None G1682 a O26
G1111 b O25 None G1683 a O28
G1286 a O27 None G1188 a O29
G1235 a O78 None G1684 a O30
G1189 a O85 None G1264 a O32
G1160 b O85 None G1195 a O33
G1088 a O114 None G1063 a O34
G1695 a O115 None G1211 a O35
G1679 a O126 None G1064 a O36
G1095 a O128 None G1241 a O37
G1208 a O139 None G1685 a O38
G1122 b O139 None G1056 a O39
G1258 a O148 None G1234 a O40
G1127 b O148 STh G1289 a O41
G1392 a O148 None G1065 a O42
G1061 a O149 None G1247 a O43
G1108 a O159 None G1291 a O44
G1216 a O166 None G1686 a O45
G1185 a O167 STh G1687 a O46
G1093 a O173 None G1692 a O91
Clinical isolates G1079 a O92
151/05/G2493 c O8 LT, STb G1080 a O95
CB08768/G2521 c O8 STp G1081 a O96
CB08810/G2533 c O8 STp G1082 a O97
Bi 623-42/G1306 c O11 None G1083 a O98
F7902-41/G1383 c O15 None G1251 a O99
2P9/G1384 c O15 None G1058 a O100
CA017(19)/G1385 c O15 None G1502 a O101
RL84/98/G2579 c O78 None G1240 a O102
RL453/98/G2580 c O78 None G1693 a O103
RL415/98/G2581 c O78 None G1629 a O104
RL468/98/G2582 c O78 None G1084 a O105
C275-53/G1379 c O114 STh G1255 a O106
339-54/G1361 c O114 LT G1085 a O107
C1003-63/G1336 c O114 STh G1198 a O108
3075/69/G1341 c O114 None G1259 a O109
340-54/G1362 c O114 LT G1086 a O110
IP831/G1325 c O114 LT G1087 a O111
150/05/G2492 c O149 LT, STb G1295 a O112ab
205/05/G2503 c O149 LT, STp, STb G1694 a O113
494/99/G2523 c O149 LT, STp, STb G1261 a O116
425/98/G2524 c O149 LT, STb G1089 a O117
376/98/G2525 c O149 LT, STp, STb G1696 a O118
G1059 a O119
E. colireference strains G1293 a O120
with nontargeted G1060 a O121
O serogroups G1697 a O123
G1673 a O1 G1053 b O124
G1674 a O2 G1209 a O125
G1206 a O3 G1094 a O127
G1633 a O4 G1096 a O129
G1675 a O5 G1203 a O130
G1676 a O7 G1193 a O131
G1677 a O9 G1297 a O132
G1055 a O10 G1272 a O133
Continued on following page
on May 16, 2020 by guest
http://jcm.asm.org/
DNA amplification and labeling using the random PCR method.The first step was performed as follows: a reaction mixture containing 1 l of 100-ng/l genomic DNA, 1l of 100M primer A (5⬘-GTTTCCCAGTCACGATCNNN NNNNNN-3⬘) (22), and 8l of Milli-Q water was first incubated at 95°C for 5 min and then cooled to 4°C for 2 to 5 min. The reaction mixture was then made up to 30l by the addition of 4l of 10⫻PCR buffer (500 mM KCl, 100 mM Tris-HCl [pH 8.3], 5 mM MgCl2), 1l of 10 mM deoxynucleoside triphosphates
(dNTPs), 2.5 U ofTaqDNA polymerase, and an appropriate volume of Milli-Q water. The mixture was kept at 4°C for 10 s. Then the primer was allowed to anneal by slowly increasing the temperature from 4 to 72°C over a 10-min period,
followed by an extension step at 72°C for 1 min. The steps described above were repeated once, and the PCR products were then purified using the Montage centrifugal filter device kit (Millipore Corporation, MA).
The second step was performed with a 20-l reaction mixture consisting of 6
[image:3.585.46.537.76.581.2]l of the purified PCR product from the first step, 1⫻PCR buffer, 0.2 mM dNTPs, 0.1 U ofTaqDNA polymerase, 2M primer B (5⬘-GTTTCCCAGTC ACGATC-3⬘), and Milli-Q water (22). The reaction parameters were as follows: 95°C for 5 min; 35 cycles of 95°C for 30 s, 45°C for 30 s, 55°C for 30 s, and 72°C for 1 min; and a final extension at 72°C for 5 min. A 2-l aliquot of the resulting PCR product was run on an agarose gel to check if the amplified DNA appeared TABLE 1—Continued
Strain no. Sourcea Serogroup or
serotypeb
Virulence
factor(s) Strain no. Source
a Serogroup or
serotypeb
Virulence factor(s)
G1626 a O48 G1102 a O150
G1277 a O49 G1103 a O151
G1688 a O50 G1104 a O152
G1218 a O51 G1105 a O153
G1066 a O52 G1273 a O154
G1067 a O53 G1106 a O155
G1245 a O54 G1197 a O156
G1284 a O55 G1704 a O157
G1068 a O56 G1107 a O158
G1069 a O57 G1109 a O160
G1248 a O58 G1254 a O161
G1070 a O59 G1283 a O162
G1627 a O60 G1244 a O163
G1071 a O61 G1225 a O164
G1290 a O62 G1698 a O165
G1072 a O63 G1090 a O168
G1073 a O64 G1278 a O169
G1279 a O65 G1091 a O170
G1074 a O66 G1270 a O171
G1215 a O68 G1092 a O172
G1628 a O69 G1609 c O174
G1635 a O70 G1606 c O177
G1194 a O71 G2258 c O180
G1057 a O73
G1231 a O74 Strains of other bacterial
G1689 a O75 species (n⫽23)
G1220 a O76 Shigellaspecies
G1075 a O77 Shigella flexneriG1661 a Type 1a
G1690 a O79 S. flexneriG1663 a Type 2a
G1076 a O80 S. flexneriG1665 a Type 3a
G1217 a O81 S. flexneriG1668 a Type 4a
G1196 a O82 S. flexneriG1669 a Type 4b
G1691 a O83 S. dysenteriaeG1252 a Type 2
G1205 a O84 S. dysenteriaeG1281 a Type 3
G1275 a O86 S. dysenteriaeG1213 a Type 5
G1260 a O87 Shigella boydiiG1296 a Type 4
G1262 a O88 S. boydiiG1236 a Type 9
G1077 a O89 S. dysenteriaeG1018 d Type 1
G1078 a O90 S. dysenteriaeG2547 b Type 1
G1253 a O134 S. dysenteriaeG2548 b Type 1
G1239 a O135 Salmonella enterica
G1265 a O136 G1440 a Serotype Dakar
G1276 a O137 G1441 a Serotype Utrecht
G1242 a O138 G1450 a Serotype Anatum
G1097 a O140 G1459 a Serotype Hvittingfoss
G1230 a O141 G1460 a Serotype Jangwani
G1098 a O142 G1462 a Serotype II 47:b:1,5
G1288 a O143 G1465 a Serotype Urbana
G1099 a O144 G1467 a Serotype Niarembe
G1100 a O145 G1481 a Serogroup D1
G1101 a O146 G1805 a Serotype Marseille
G1229 a O147
aLowercase letters represent sources as follows: a, Institute of Medical and Veterinary Science, Adelaide, Australia; b, National Center for Medical Culture
Collection, China; c, Federal Institute for Risk Assessment (BfR), Berlin, Germany; d, National Institute for Communicable Disease Control and Prevention, Beijing, China.
bSerogroups are given forE. colistrains.
on May 16, 2020 by guest
http://jcm.asm.org/
as a 250- to 1,000-bp smear. This DNA was then used as the template for labeling.
The third step was performed with a 40-l reaction mixture consisting of 5l of the PCR product from the first step, 1⫻PCR buffer, 0.25 mM dNTPs, 2.5M primer B, 0.125 UTaqDNA polymerase, and 0.3125 nM Cy3-dUTP. The reac-tion parameters were the same as those described for the second step.
Oligonucleotide probe design.For each serogroup, two probes were designed for OligoArray, version 2.0, based on sequences in the GenBank database and an in-house database consisting of all 34 of the O-antigen gene clusters ofShigella and 175 O-antigen gene clusters ofE. coli. For each virulence gene (elt,estAp,
estAh, andestB), two probes were designed. Two probes based on therfpBgene
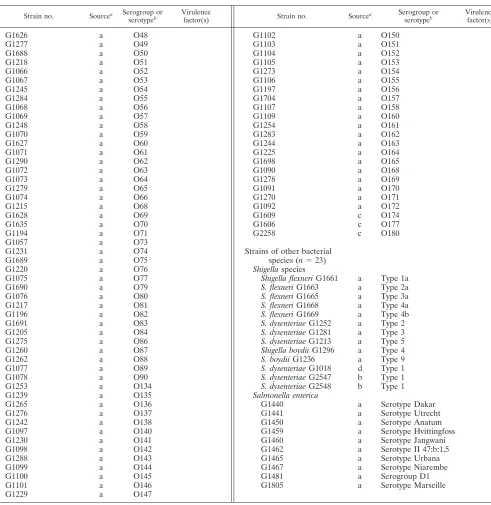
ofShigella dysenteriaetype 1 were designed to differentiateE. coliO148 fromS. dysenteriaetype 1. One probe based on bacterial 16S rRNA genes was designed as a positive control. A probe containing 40 poly(T) oligonucleotides was used as a negative control. A probe labeled with Cy3 at the 3⬘end was used as the positional reference and printing control. Each probe was 5⬘amino modified, and 10 poly(T) oligonucleotides were added [for the probe based on 16S rRNA genes, 15 poly(T) oligonucleotides were added]. All of the oligonucleotide probes used are listed in Table 2.
[image:4.585.45.542.79.578.2]DNA microarray preparation.The probes were dissolved in 1⫻spotting buffer (3 M betaine, 3⫻SSC [0.45 M NaCl plus 0.045 M sodium citrate]) to a final concentration of 1g/l and were printed on aldehyde group-modified glass TABLE 2. Oligonucleotide probes used in this study
Probe Targeted gene (serogroup)
Source/GenBank
accession no. Tm(°C)a Sequence (5⬘–3⬘)
OA-2443 wzx(O6) NC_004431 79.86 CCATGTTGTTCATCTTAAACCTAATGAATGCATTGTGGAA
OA-2444 wzy(O6) NC_004431 79.62 TCGTAGTGAAGCTATAACGTTTCTTTTAACGGTTACATGT
OA-2445 wzm(O8) AB010150 79.41 TCACACCCATTGTTTATGTACTGAATTCATTACCTGC
OA-2446 wzt(O8) AB010150 79.73 GCCGATAAACAAAATCAGTCCATTAAACAAGTTGAGCATA
OA-2801 wzy(O11) Laboratory stock 80.91 CGTTCAAGGTGGCAATTATATATTTCCATTGGTCACACTG OA-2695 wzy(O11) Laboratory stock 79.51 CAGATGGAGTGTTTATGTATGTTCATTTATGCTAGGGGTA
OA-2700 wzx(O15) AY647261 76.6 GAGTCATTGGTGTATCGAATTTTGGTGATCTGAGTTTTTC
OA-2701 wzx(O15) AY647261 81.53 GCAATAAGTCAGGGTGCCAATTACCTACTGCCATTATTAA
OA-2452 wzy(O25) Laboratory stock 79.73 ATCCAGAACTTAACGATGTTAGTAGGCATTGTGATTAGTG OA-2802 wzx(O25) Laboratory stock 80.99 AAATTAAGCCATGCAAGTAGTTTTACAGCGTCATATGCAG OA-2453 wzx(O27) Laboratory stock 79.55 TCCTGTGCTATTTATGGGTTAGTTCTGATCAATTAACCTT OA-2454 wzy(O27) Laboratory stock 82.2 TTGCTCTGTTCATAAAAGGCATTAGCACTTATTATGTCGT OA-2697 wzx(O78) Laboratory stock 79.23 TCTTTTATCACATTGATTGGTGTTTGTTTTCTCTACCCAA OA-2698 wzy(O78) Laboratory stock 79.03 TTATGAAAGGCTAACTGTTTACTTCGAATTTTCTCATGCT OA-2666 wzy(O85) Laboratory stock 80.13 TTTCAGTACGTTAACTTTTGGTTGAGTGATGAACAACGTA OA-2667 wzy(O85) Laboratory stock 79.54 AGTATTAACTCGTTTAGAAACCTTACAAGCTGGGAATGAT
OA-2806 wzx(O114) AY573377 80.82 TCATAGGAAAGGATTAGAACATTGCTACAAGTGGTGGATT
OA-2809 wzy(O114) AY573377 79.78 GGATGGAATGTTAATGGGTTATTTATTTCAGAAGCATGGG
OA-2670 wzy(O115) Laboratory stock 79.02 CAGTTTAGATGTTGTCCGATGGATTAATATAACGCTGTTT OA-2671 wzy(O115) Laboratory stock 80.79 AGGCAGAAGGATGTTTGCTGTTATTTAATTGTATGCATGT OA-2674 wzy(O126) Laboratory stock 79.22 ACGTAGTATTCTAATAATCGTGCTAACAATATGTGCGCTA OA-2675 wzy(O126) Laboratory stock 79.59 TGGCATCTAAAATTATAAGTTCGTTAGGATTAGTGGCGAT
OA-2703 wzx(O128) AY217096 79.21 GCCCATTGCATTCCTAAATTTGAAATGATTAATGCTATCC
OA-2460 wzy(O128) AY217096 82.02 GCTAGGTATTTAGCAAATTCAACAGATTTGGCTGACTTTG
OA-2707 wzx(O139) DQ109552 79.35 GGATTTCAGGGCCAATATTTTATGAGTTTTGTAGCCTTAT
OA-2708 wzy(O139) DQ109552 81.03 ATGGAACCGTATGTACAATACTTTATAATCATGGGCCTGG
OA-2464 wzy(O148) DQ167407 79.01 GCAATATTTGATACGTTAAGGGTTTATCTTTTCTCGGGAT
OA-2811 wzy(O148) DQ167407 80.22 CAATGAGCAATATTTCGTACCATTAAGTGCAACAACCTTG
OA-2676 wzx(O149) DQ868764 79.96 TATGGTATGCAATTACTGATTCATTAAGATTTGGAGGCGT
OA-2677 wzx(O149) DQ868764 79.89 CGGTGCAAAGTTAATTCCGCTAACGATAATATGTTGTTTT
OA-2466 wzy(O159) EU294176 79.13 GTTATAATGACAGTAGATTCAATCCTTTTCTTGGGTTGCA
OA-2812 wzx(O159) EU294176 80.08 GCACTGAGCTATTTGGGTGTTAATTATTATGGTGTATGGA
OA-2680 wzx(O166) Laboratory stock 79.39 GCATGATGGTTTATTTTAGAGTGGATCGGTATTTTGTTGA OA-2816 wzy(O166) Laboratory stock 79.64 TAGGAACAATAGTTTCGTTTCGAGATATAAGCGTTGATCG
OA-2684 wzx(O167) EU296408 79.35 GCCATATATACTTCTGCAAATAAAATATTACAGGCGGCTC
OA-2685 wzx(O167) EU296408 79.2 ACCGCAGTTGTTAATATCAGTAGTGGCAGTATATATCATT
OA-2689 wzx(O173) Laboratory stock 79.31 AGCTGTACTAATGTCATCATACACGATGGTAATTGGTATT OA-2691 wzy(O173) Laboratory stock 79.58 TCTTAGAAAAGTTAGAGTTCCACCTCTTTTAGCATTGTGT OA-2467 rfpB(S. dysenteriae
type 1)
S73325 79.16 TGGGAGAAGAAAGTTATAAGTTAGCAAGAGAAAGATTCGA
OA-2468 rfpB(S. dysenteriae
type 1)
S73325 79.86 AATTTATTATACTTGGCGCTATAGATAAGGAAAACCCCGG
OA-2469 elt S60731 79.8 ACACATTAAGAATCACATATCTGACCGAGACCAAAATTGAb
OA-2470 elt S60731 80.16 GCAAAAGAGAAATGGTTATCATTACATTTAAGAGCGGCGb
OA-2471 estAp M25607 79.74 TTATCTTTCCCCTCTTTTAGTCAGTCAACTGAATCACTTGb
OA-2817 estAp M25607 76.7 CGTTTAACTAATCTCAAATATCCGTGAAACAACATGACGG
OA-2473 estAh AY342059 76.5 GTAGCAATTACTGCTGTGAATTGTGTTGTAATCCTGCTTG
OA-2819 estAh AY342059 78.5 TTTCACCTTTCGCTCAGGATGCTAAACCAGTAGAGTCTTC
OA-2475 estB AY028790 79.11 TTCTATTGCTACAAATGCCTATGCATCTACACAATCAAAb
OA-2476 estB AY028790 78.1 AGGTTTTTTAGGGGTTAGAGATGGTACTGCTGGAGCATGb
OA-1993 16S rRNA X80725 71.9 TTGTACACACCGCCCGTCACACCAT
wl_4006 TTTTTTTTTTTTTTTTTTTTTTTTTTTTTTTTTTTTTTTT
aT
mwas predicted using OligoArray software, version 2.0, except for probes OA-2700, OA-2817, OA-2473, OA-2819, and OA-1993, for whichTmwas predicted using
Primer Premier, version 5.0.
bProbe used in our previous study (12).
on May 16, 2020 by guest
http://jcm.asm.org/
slides (CapitalBio Corporation, Beijing, China) using the SpotArray 72 system (Perkin-Elmer Corporation, Waltham, MA). Each probe was spotted in tripli-cate. The printed slides were dried for 24 h at room temperature and were then cross-linked using a UV cross-linker (UVP Corporation, Upland, CA). The microarray slides were prehybridized at 45°C for 1 h in 100 ml of prehybridiza-tion buffer (containing 25 ml of 20⫻SSC, 10% sodium dodecyl sulfate [SDS], and 10 mg/ml bovine serum albumin [BSA]), washed twice in 0.1⫻SSC for 5 min each time, washed in Milli-Q water for 30 s, dried, and stored at room temper-ature in the dark. A schematic diagram of the probe positions on the microarray is shown in Fig. 1.
Hybridization procedure.A 40-l aliquot of labeled PCR product was incu-bated at 65°C until dry; then it was resuspended in 20l of hybridization buffer (30% formamide, 5⫻SSC, 0.1% SDS, 0.001% salmon sperm DNA). After denaturation at 95°C for 5 min, 20l of the labeled target DNA was hybridized with the probes at 45°C for 16 h. After hybridization, the slide was washed once with solution A (2⫻SSC, 0.1% SDS) for 5 min, twice with solution B (0.1⫻SSC, 0.1% SDS) for 5 min each time, once with solution C (0.1⫻SSC) for 4 min, and finally once with solution D (0.01⫻SSC) for 15 s. The slide was then dried under a gentle air stream before it was scanned. For each DNA sample, at least three independent hybridization reactions were carried out to verify the reproducibility of the microarray method.
Data acquisition and analysis.The hybridized microarray was scanned with a laser at 532 nm using the GenePix personal 4100A microarray scanner (Axon Instruments, Union City, CA), and the signals were calculated using GenePix Pro software, version 6.0. The data were analyzed, and the results were reported using the Bactarray Analyzer software (version 1.0) developed in-house.
Nucleotide sequence accession numbers.The DNA sequences of theE. coli O25 and O27 O-antigen gene clusters have been deposited in the GenBank database under accession numbers GU014554 and GU014555, respectively.
RESULTS
O-antigen gene clusters within the E. coli serogroups of
interest.The O-antigen gene cluster sequences ofE. coli
se-rogroups O6, O8, O15, O114, O115, O126, O128, O139, O148, O149, O159, O167, and O173 were retrieved from the GenBank database (Table 2). The O-antigen gene cluster se-quences ofE. coliserogroups O11, O78, O85, and O166 were determined previously in our lab (unpublished data), and the sequences ofE. coliserogroups O25 and O27 were obtained in this study. DNA sequencing between thegalFandgndgenes was carried out for strains belonging to these two serogroups, and 17,566 bp (14 open reading frames [ORFs]) and 9,510 bp (7 ORFs) of sequence were obtained, respectively. The functions of each ORF in these O-antigen gene clusters were predicted on the basis of homology by searching the available databases.
Specific genes used for the detection and serotyping of
ETEC.Four genes that have been reported as virulence genes
and used for the identification of ETEC,elt,estAp,estAh, and
estB, were used as ETEC-specific genes in this study. Thewzx
and wzy genes have been reported as O-serogroup-specific genes in many studies and were therefore considered specific to each of the 19 serogroups targeted: O6, O8, O11, O15, O25, O27, O78, O85, O114, O115, O126, O128, O139, O148, O149, O159, O166, O167, and O173 (Table 2). TherfpB gene was used to differentiateE. coliserogroup O148 fromS. dysenteriae
type 1, because thewzxandwzygenes share almost 99% iden-tity in these two serogroups (10).
Random PCR amplification method.To amplify one or two
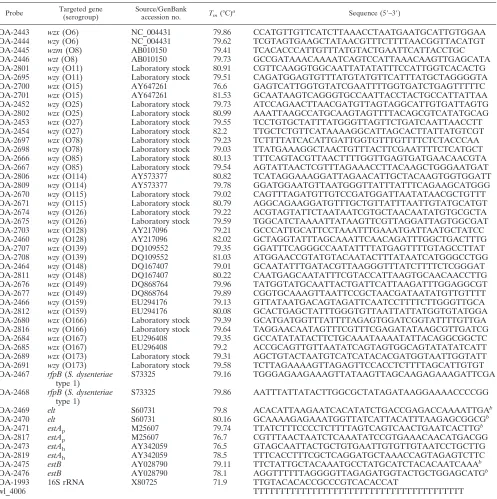
O-serogroup-specific genes and four ETEC-specific virulence genes simultaneously in the ETEC strains belonging to the 19 targeted serogroups, a random PCR amplification method was used. A partially degenerate primer (9 bp at the 3⬘end) was used in the first step of the procedure to randomly amplify fragments of DNA covering the entire genome, and a “tag” (17 bp at the 5⬘end) was added to the amplified DNA at the same time. In the second step, a primer (with the same sequence as the tag) was used to further amplify the DNA synthesized in the first step, resulting in an exponential increase in the num-ber of DNA molecules covering the whole genome. The am-plification resulted in a DNA smear of fragments ranging from 250 to 2,000 bp (Fig. 2). The amplified DNA was then labeled with Cy3 in the third step to be used for hybridization with the probes printed on the microarrays.
Specificity of the DNA microarray. The DNA microarray
was tested using 28 reference strains belonging to the 19
tar-FIG. 1. Schematic diagram of the microarray, showing the positions of immobilized probes spotted within a single well. Cy3 is a fluorescent dye. dmso, dimethyl sulfoxide. The sequences of the probes immobilized at each location are shown in Table 2.
FIG. 2. Agarose gel electrophoresis of the random PCR products amplified fromE. colistrains andS. dysenteriaetype 1. Lanes 1 and 9, DNA markers of 100 bp, 250 bp, 500 bp, 750 bp, 1 kb, and 2 kb; lane 2,E. coliO6 (G1062); lane 3,E. coliO8 (G1602); lane 4,E. coliO11 (G1650); lane 5,E. coliO15 (G1201); lane 6,E. coliO114 (G1088); lane 7,E. coliO139 (G1208); lane 8,S. dysenteriaetype 1 (G1018).
on May 16, 2020 by guest
http://jcm.asm.org/
[image:5.585.301.543.568.672.2]getedE. coliO serogroups, 150 reference strains belonging to otherE. coliO serogroups, and 23 reference strains of other, closely related species, including 13 Shigella strains and 10
Salmonellastrains (Table 1). Through hybridization reactions with multiple strains from different sources representing each of the targeted serogroups, other serogroups, and other spe-cies, 51 specific probes were selected for inclusion in the mi-croarray. These included 40 probes for O-serogroup-specific genes, 8 probes for virulence genes, 1 probe as a positive
[image:6.585.80.505.69.553.2]control, 1 probe as a negative control, and 1 probe as a posi-tional reference and printing control (Table 2). All of the strains belonging to the 19 targeted serogroups or carrying virulence genes consistently hybridized to their corresponding probes with 100% specificity, indicating that the probes are effective at detecting their corresponding targeted serogroups and virulence genes. The hybridization results are shown in Fig. 3. ForS. dysenteriaetype 1, probes for the O148wzygene, the rfpB gene, the positive control, and the printing control
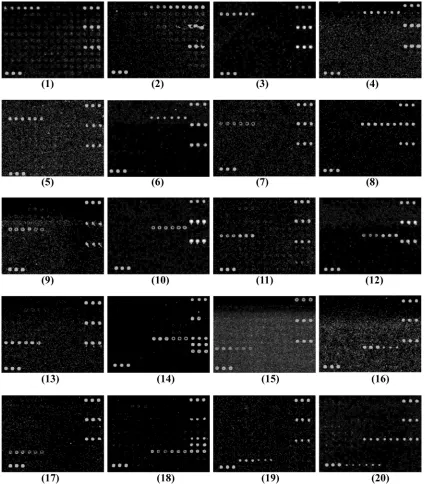
FIG. 3. Microarray differentiation of reference strains belonging to differentE. coliO serogroups andS. dysenteriaetype 1. Panels: 1,E. coli
O6 (G1062); 2,E. coliO8 (G1602); 3,E. coliO11 (G1657); 4,E. coliO15 (G1201); 5,E. coliO25 (G1111); 6,E. coliO27 (G1286); 7,E. coliO78 (G1235); 8,E. coliO85 (G1160); 9,E. coliO114 (G1088); 10,E. coliO115 (G1695); 11,E. coliO126 (G1679); 12,E. coliO128 (G1095); 13,E. coliO139 (G1658); 14,E. coliO148 (G1127); 15,E. coliO149 (G1061); 16,E. coliO159 (G1108); 17,E. coliO166 (G1216); 18,E. coliO167 (G1185); 19,E. coliO173 (G1093); 20,S. dysenteriaetype 1 (G1018).
on May 16, 2020 by guest
http://jcm.asm.org/
hybridized to the microarray. For strains belonging to nontar-geted serogroups of E. coli, and for Shigellaand Salmonella
strains, only the positive control and the printing control hy-bridized. A few of theE. colistrains belonging to nontargeted serogroups hybridized with probes to theeltgene, and none of the serogroup-specific probes hybridized (data not shown).
Double-blind test to verify the microarray.A double-blind
test was performed in order to verify the stability and specific-ity of the microarray. The test was carried out with 22 clinical isolates (Table 1) that had been characterized for O serotypes with specific antisera and for virulence genes by conventional PCR techniques at the Federal Institute for Risk Assessment (BfR) in Berlin, Germany. The hybridization patterns for rep-resentative clinical isolates are shown in Fig. 4. The detection results obtained with the microarray were consistent with the results obtained by conventional methods, indicating that the microarray assay is specific and reliable.
Detection sensitivity of the microarray. Serial dilutions of
genomic DNAs (500, 100, 50, and 10 ng) ofE. coliserogroup O15 strain G1383 and serogroup O85 strain G1160 were used as probes to test the sensitivity of the microarray. Strong hy-bridization signals were observed at DNA levels of 50 ng or higher (Fig. 5). We selected 50 ng of DNA as the most appro-priate probe concentration for microarray detection. E. coli
serogroup O15 strain G1383 was also serially diluted from 101 to 108CFU/ml. Positive hybridization signals were obtained at 108CFU/ml. By using 50 ng of DNA or 108CFU/ml, all of the reference strains and clinical strains belonging to the 19 tar-geted serogroups could be detected correctly (data not shown).
DISCUSSION
Molecular methods for the detection of ETEC have been developed; however, these methods are based on PCR
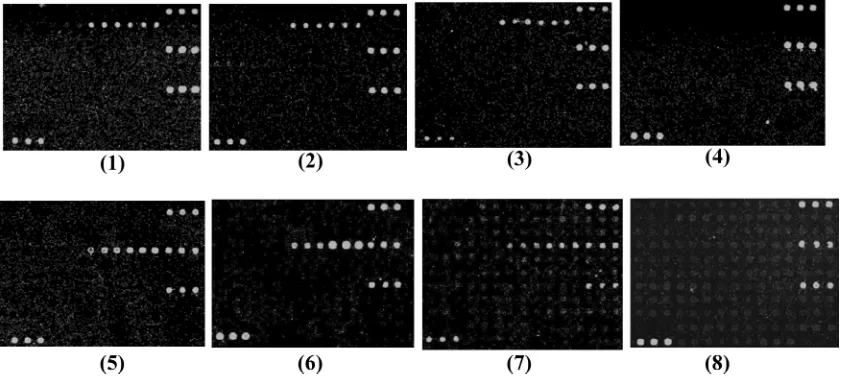
[image:7.585.136.448.68.250.2]ampli-FIG. 4. Microarray differentiation of some clinical isolates ofE. coli. Panels: 1,E. coliO8 (G2493); 2,E. coliO8 (G2533); 3,E. coliO114 (G1336); 4,E. coliO114 (G1362); 5,E. coliO149 (G2525); 6,E. coliO149 (G2524).
FIG. 5. Sensitivity of the microarray for the detection of genomic DNA fromE. coliO15 strain G1383 at 500 ng (panel 1), 100 ng (panel 2), 50 ng (panel 3), and 10 ng (panel 4) and fromE. coliO85 strain G1160 at 500 ng (panel 5), 100 ng (panel 6), 50 ng (panel 7), and 10 ng (panel 8).
on May 16, 2020 by guest
http://jcm.asm.org/
[image:7.585.82.504.517.706.2]fication of enterotoxin genes, so subsequent serotyping meth-ods are required in order to fully characterize strains. Current serotyping methods for ETEC involve antiserum agglutination tests. Separate detection and serotyping methods increase the time and work required for pathogen identification. To our knowledge, this study is the first to develop a molecular assay for the parallel analysis of enterotoxin and serotyping genes in ETEC.
Information on the O serogroup of strains is a good indica-tor of strain variability and has been widely accepted as an epidemiological marker for the pathogenicity ofE. colistrains. For example, serogroups O6, O8, O78, and O128 account for about half of the 988 ETEC isolates from 18 different countries (31). O serogroup differences amongE. colistrains are almost entirely due to genetic variations in their O-antigen gene clus-ters, which include three groups of genes: nucleotide sugar synthesis genes, glycosyltransferase genes, and O-antigen-pro-cessing genes, includingwzxandwzy. Thewzxand wzygenes are usually specific to individual serogroups. PCR assays tar-geting these genes for the detection of pathogenic E. coli
strains belonging to serogroups O157, O111, O123, and O86 have been reported (1, 9, 27, 28). In order to obtain all thewzx
andwzygenes for ETEC serotyping, the O-antigen gene clus-ters ofE. coliserogroups O25 and O27 were sequenced (the sequences of the O-antigen gene clusters of other ETEC se-rogroups were available through previous studies or from un-published data generated by our lab).
DNA microarray technology is a relatively new methodology with many potential applications, one of which is the rapid and sensitive detection of bacterial pathogens. In comparison with traditional and PCR-based methods, microarrays offer the po-tential for high-throughput, specific, sensitive data collection, and microarray analysis has been successfully applied to the molecular typing of pathogenic microorganisms such as Strep-tococcus pneumoniae(29), group B streptococci (30), and Shi-gella (16). Two different amplification strategies, multiplex PCR and random amplification, have been reportedly used in these molecular typing studies to prepare DNA for hybridiza-tion to DNA microarrays. Multiplex PCR has been the stan-dard method most commonly employed. However, multiplex PCR has several disadvantages vis-a`-vis random amplification. First, the number of multiplex PCR primer pairs is limited because of cross-reactivity and primer-primer interactions. On the other hand, random amplification provides a highly com-parable analysis but is not limited with regard to the number of genes that can be targeted; it is limited only with regard to the throughput of probes in the microarray. Also, random ampli-fication does not require optimization of the primers them-selves or of the quantity of primers used in the PCR, reducing the complexity and cost of amplification. Second, multiplex PCR can cause large amplification skews, which increase the risk of false-negative results, especially when the concentration of the template DNA is low. Random PCR, in contrast, is a relatively unbiased method and provides a more uniform ge-netic locus representation. Thus, random PCR is more effec-tive than multiplex PCR at amplifying many gene locations. Third, to expand the spectrum of pathogens that can be de-tected by a multiplex PCR assay, extensive changes and reop-timization of the whole amplification procedure are likely re-quired, whereas with random PCR, it is easy to add probes to
the microarray in order to expand the detection spectrum without changing the steps prior to hybridization. In summary, compared with multiplex PCR, random PCR allows for ampli-fication with minimal bias, providing an effective alternative for detecting pathogens using DNA microarrays. However, de-spite its advantages, random amplification is less sensitive than amplification via multiplex PCR. Still, the lower sensitivity of this method (50 ng of genomic DNA or 108CFU/ml of organ-isms in pure culture) was not a problem in this case, because the strains used could easily be cultured to the required con-centration.
The efficient detection of pathogenic microorganisms is cru-cial for the prevention and effective treatment of disease and, in some cases, for the safety of the wider community. The development of efficient and accurate detection methods is therefore of the utmost importance. The DNA microarray developed in this study has been shown to provide high-throughput, specific, and reliable detection and serotyping of ETEC. This approach has promising applications in clinical diagnosis and epidemiological surveillance. The strategy of using random PCR makes it easy to expand the detection range of the microarray by including more pathogens and/or serogroups; this will be the focus of future studies.
ACKNOWLEDGMENTS
This study was supported by grants from the National Natural Sci-ence Foundation of China (30900255, 30788001, and 30870070), the National 863 Program (2007AA02Z106 and 2007AA021303), the Na-tional 973 Program (2009CB522603), and the NaNa-tional Key Programs for Infectious Diseases of China (002, 2008ZX10004-009, 2009ZX10004-108, 2008ZX10003, and 2008ZX10001-004).
REFERENCES
1.Beutin, L., Q. Wang, D. Naumann, W. Han, G. Krause, L. Leomil, L. Wang, and L. Feng.2007. Relationship between O-antigen subtypes, bacterial sur-face structures and O-antigen gene clusters inEscherichia coliO123 strains carrying genes for Shiga toxins and intimin. J. Med. Microbiol.56:177–184. 2.Black, R. E.1993. Epidemiology of diarrhoeal disease: implications for
control by vaccines. Vaccine11:100–106.
3.Black, R. E.1990. Epidemiology of travelers’ diarrhea and relative impor-tance of various pathogens. Rev. Infect. Dis.12(Suppl. 1):S73–S79. 4.Blanco, M., N. L. Padola, A. Kruger, M. E. Sanz, J. E. Blanco, E. A.
Gonzalez, G. Dahbi, A. Mora, M. I. Bernardez, A. I. Etcheverria, G. H. Arroyo, P. M. Lucchesi, A. E. Parma, and J. Blanco.2004. Virulence genes and intimin types of Shiga-toxin-producingEscherichia coliisolated from cattle and beef products in Argentina. Int. Microbiol.7:269–276. 5.Coimbra, R. S., F. Grimont, P. Lenormand, P. Burguiere, L. Beutin, and
P. A. Grimont.2000. Identification ofEscherichia coliO-serogroups by re-striction of the amplified O-antigen gene cluster (rfb-RFLP). Res. Microbiol. 151:639–654.
6.Dallas, W. S.1990. The heat-stable toxin I gene fromEscherichia coli18D. J. Bacteriol.172:5490–5493.
7.Eom, H. S., B. H. Hwang, D. H. Kim, I. B. Lee, Y. H. Kim, and H. J. Cha. 2007. Multiple detection of food-borne pathogenic bacteria using a novel 16S rDNA-based oligonucleotide signature chip. Biosens. Bioelectron.22:845– 853.
8.Ericsson, C. D.2003. Travellers’ diarrhoea. Int. J. Antimicrob. Agents21: 116–124.
9.Feng, L., W. Han, Q. Wang, D. A. Bastin, and L. Wang.2005. Characteriza-tion ofEscherichia coliO86 O-antigen gene cluster and identification of O86-specific genes. Vet. Microbiol.106:241–248.
10.Feng, L., A. V. Perepelov, G. Zhao, S. D. Shevelev, Q. Wang, S. N. Senchen-kova, A. S. Shashkov, Y. Geng, P. R. Reeves, Y. A. Knirel, and L. Wang.2007. Structural and genetic evidence that theEscherichia coliO148 O antigen is the precursor of theShigella dysenteriaetype 1 O antigen and identification of a glucosyltransferase gene. Microbiology153:139–147.
11.Gorbach, S. L., B. H. Kean, D. G. Evans, D. J. Evans, Jr., and D. Bessudo. 1975. Travelers’ diarrhea and toxigenicEscherichia coli. N. Engl. J. Med. 292:933–936.
12.Han, W., B. Liu, B. Cao, L. Beutin, U. Kruger, H. Liu, Y. Li, Y. Liu, L. Feng, and L. Wang.2007. DNA microarray-based identification of serogroups and
on May 16, 2020 by guest
http://jcm.asm.org/
virulence gene patterns ofEscherichia coliisolates associated with porcine postweaning diarrhea and edema disease. Appl. Environ. Microbiol. 73: 4082–4088.
13.Huilan, S., L. G. Zhen, M. M. Mathan, M. M. Mathew, J. Olarte, R. Espejo, U. Khin Maung, M. A. Ghafoor, M. A. Khan, Z. Sami, et al.1991. Etiology of acute diarrhoea among children in developing countries: a multicentre study in five countries. Bull. World Health Organ.69:549–555.
14.Kosek, M., C. Bern, and R. L. Guerrant.2003. The global burden of diar-rhoeal disease, as estimated from studies published between 1992 and 2000. Bull. World Health Organ.81:197–204.
15.Lang, A. L., Y. L. Tsai, C. L. Mayer, K. C. Patton, and C. J. Palmer.1994. Multiplex PCR for detection of the heat-labile toxin gene and Shiga-like toxin I and II genes inEscherichia coliisolated from natural waters. Appl. Environ. Microbiol.60:3145–3149.
16.Li, Y., D. Liu, B. Cao, W. Han, Y. Liu, F. Liu, X. Guo, D. A. Bastin, L. Feng, and L. Wang.2006. Development of a serotype-specific DNA microarray for identification of someShigellaand pathogenicEscherichia colistrains. J. Clin. Microbiol.44:4376–4383.
17.Maynard, C., F. Berthiaume, K. Lemarchand, J. Harel, P. Payment, P. Bayardelle, L. Masson, and R. Brousseau.2005. Waterborne pathogen de-tection by use of oligonucleotide-based microarrays. Appl. Environ. Micro-biol.71:8548–8557.
18.Nataro, J. P., and J. B. Kaper.1998. DiarrheagenicEscherichia coli. Clin. Microbiol. Rev.11:142–201.
19.Pen˜aranda, M. E., D. G. Evans, B. E. Murray, and D. J. Evans, Jr.1983. ST:LT:CFA/II plasmids in enterotoxigenic Escherichia coli belonging to serogroups O6, O8, O80, O85, and O139. J. Bacteriol.154:980–983. 20.Reeves, P. R., and L. Wang.2002. Genomic organization of LPS-specific loci.
Curr. Top. Microbiol. Immunol.264:109–135.
21.Sergeev, N., M. Distler, S. Courtney, S. F. Al-Khaldi, D. Volokhov, V. Chizhikov, and A. Rasooly.2004. Multipathogen oligonucleotide microarray for environmental and biodefense applications. Biosens. Bioelectron. 20: 684–698.
22.Shivaswamy, S., and V. R. Iyer.2007. Genome-wide analysis of chromatin status using tiling microarrays. Methods41:304–311.
23.Spicer, E. K., and J. A. Noble.1982.Escherichia coliheat-labile enterotoxin. Nucleotide sequence of the A subunit gene. J. Biol. Chem.257:5716–5721. 24.Stacy-Phipps, S., J. J. Mecca, and J. B. Weiss.1995. Multiplex PCR assay and simple preparation method for stool specimens detect enterotoxigenic Escherichia coliDNA during course of infection. J. Clin. Microbiol.33:1054– 1059.
25.Stenutz, R., A. Weintraub, and G. Widmalm.2006. The structures of Esch-erichia coliO-polysaccharide antigens. FEMS Microbiol. Rev.30:382–403. 26.Urban, R. G., E. M. Pipper, L. A. Dreyfus, and S. C. Whipp.1990. High-level
production ofEscherichia coliSTb heat-stable enterotoxin and quantification by a direct enzyme-linked immunosorbent assay. J. Clin. Microbiol.28:2383– 2388.
27.Wang, L., H. Curd, W. Qu, and P. R. Reeves.1998. Sequencing ofEscherichia coliO111 O antigen gene cluster and identification of O111 specific genes. J. Clin. Microbiol.36:3182–3187.
28.Wang, L., and P. R. Reeves.1998. Organization ofEscherichia coliO157 O antigen gene cluster and identification of its specific genes. Infect. Immun. 66:3545–3551.
29.Wang, Q., M. Wang, F. Kong, G. L. Gilbert, B. Cao, L. Wang, and L. Feng. 2007. Development of a DNA microarray to identify theStreptococcus pneu-moniaeserotypes contained in the 23-valent pneumococcal polysaccharide vaccine and closely related serotypes. J. Microbiol. Methods68:128–136. 30.Wen, L., Q. Wang, Y. Li, F. Kong, G. L. Gilbert, B. Cao, L. Wang, and L.
Feng.2006. Use of a serotype-specific DNA microarray for identification of group BStreptococcus(Streptococcus agalactiae). J. Clin. Microbiol.44:1447– 1452.
31.Wolf, M. K.1997. Occurrence, distribution, and association of O and H serogroups, colonization factor antigens, and toxins of enterotoxigenic Esch-erichia coli. Clin. Microbiol. Rev.10:569–584.