3. SUSTAINABLE DEVELOPMENT
POLICIES AND MEASURES:
Starting From Development to Tackle
Climate Change
Harald Winkler, Randall Spalding-Fecher,
Stanford Mwakasonda, and Ogunlade Davidson
Introduction
Climate change is a global problem requiring the cooperation of all coun-tries to be addressed effectively. Emissions from the industrialized North have thus far been greater than from the developing South, but they are growing rapidly in the latter.1 The principle of “common, but differenti-ated responsibilities” between industrialized and developing countries is well established in the negotiations. However, cooperation between North and South has been limited in the negotiations under the United Nations Framework Convention on Climate Change (UNFCCC). Climate change is not seen as a priority by developing countries, which are preoccupied by the challenges of meeting basic development needs. As the commitment period beyond the Kyoto targets (2008–12) draws closer, the question of how developing countries might participate in the effort against global warming becomes more urgent.
Participation could take different forms. Participation might range from mandatory requirements, such as quantified emission limitation targets, to pledges to make their development path more sustainable. Dividing a global reduction target among all countries (in a “top-down” manner) is only one possible approach (see Chapter 1).2 The alternative approach is pledge-based (in a “bottom-up” matter). The pledge could be to quanti-fied emission targets, as in the Kyoto process,3 or more qualitative in na-ture. In such an approach, it is clear that countries negotiate in their self-interest, so each tends to propose indicators most beneficial to itself (Grubb
et al. 1999). Extending the Kyoto regime globally would involve pledges by developing countries (see Chapter 2).
This chapter outlines and proposes a pledge by developing countries to implement sustainable development policies and measures (SD-PAMs). Development is a key priority for decision-makers in developing coun-tries, and therefore building climate change policy on development pri-orities would make it attractive to these stakeholders. Starting from velopment objectives and then describing paths of more sustainable de-velopment that also address climate change may be the easiest way for many developing countries to take the first steps in longer-term action on climate change. The approach has a basis in the Climate Convention, which, together with a proposed reporting structure, would provide suffi-cient stringency for a first step.
We begin by outlining the SD-PAMs approach, including its main fea-tures and assumptions. In Section II, we apply this approach to South Africa to illustrate the steps taken in practice. Section III considers how this approach might be extended to other countries and which kinds of countries might find it attractive, particularly compared to other ap-proaches. We then consider the relationship of this approach to the ulti-mate objective of the UNFCCC in Section IV. The conclusion summa-rizes the major strengths and weaknesses of the SD-PAMs approach.
I.
What Is the SD-PAMs Approach?
SD-PAMs is a pledge-based approach to developing-country participation in mitigating climate change. The approach focuses on implementing poli-cies for sustainable development, rather than setting emission targets. The SD-PAMs approach recognizes as a political reality that concerns with climate change (and, in some cases, even environmental policy more broadly) are marginal for many developing countries, and lower in na-tional priority than economic and development policies.4 It builds on ex-isting commitments and the right to sustainable development enshrined in the Convention.
SD-PAMs differs from the existing “policies and measures” requirements for industrialized countries, which clearly prioritize measures with “im-pacts in affecting GHG [greenhouse gas] emissions and removals” (UNFCCC 1999). Instead, SD-PAMs starts with the development objec-tives and needs of developing countries. Countries begin by examining their development priorities and identifying how these could be achieved more sustainably, either by tightening existing policy or implementing
new measures. The next step is to identify synergies between sustainable development and climate change, that is, those SD-PAMs that also result in reductions of GHG emissions. To obtain a realistic picture of the im-pact of a set of SD-PAMs, those policies and measures that increase GHG emissions also need to be identified.
Starting from Development, Shifting to Sustainability
The SD-PAMs approach suggests that we work backwards from a desired future state of development. Key development objectives typically include poverty eradication, job creation, food security, access to modern energy services, transport, drinking water, education, health services, and land. Development is needed because the number of houses to be built, mouths to be fed, and dwellings to be lit and heated is growing.
Sustainability, for the purposes of this chapter, is taken to mean provid-ing for these basic human needs in a way that can continue over time, result in less damage to the environment, and provide more social benefits and long-term economic development. Sustainable development must be driven by local and national priorities. Although documents such as the United Nations Millennium Declaration (UN 2000) and the New Part-nership for Africa’s Development (NEPAD 2001) articulate goals at the international and regional levels, each country will have its own set of development priorities. The meaning of sustainable development is shaped by the values of each society, and no single approach is appropriate for all economies (Munasinghe 2001, Sachs 1999, Zhou 2001). One of the strengths of the SD-PAMs approach is that it acknowledges and starts from the premise that development and sustainability are country-spe-cific.
In meeting these basic development needs, different paths are possible, and the aim of SD-PAMs is to shift toward a more sustainable path of development. In describing sustainable paths for meeting development objectives, the hypothesis is that, on balance, GHG emissions will also be reduced relative to a conventional development path (Figure 3.1). Many developing countries are already avoiding emissions through current policy. If countries act early to move to even greater sustainability in their devel-opment path, they will start “bending the curve” (see Raskinet al. 1998) of their emission trajectory.
This hypothesis is supported by the latest findings of the International Panel on Climate Change (IPCC 2001c). According to the IPCC, a low-carbon future is “associated with a whole set of policies and actions that go
Figure 3.1.
Theoretical Impact of Sustainable Development Policies and Measures on Trajectory of Greenhouse Gas Emissions
beyond the development of climate policy itself” (Morita and Robinson 2001). Moving toward a sustainable development path could avoid bur-densome future mitigation efforts and even have a greater long-term im-pact on emissions than climate change policies. Thus, the major contribu-tion of SD-PAMs lies not in promoting mitigacontribu-tion effort per se, but in changing the reference scenario of emissions from “conventional” to “sus-tainable.”5 Likewise, the IPCC also finds that the choice of development path will have a greater impact than climate policy on equity in energy use, suggesting an additional benefit of SD-PAMs (Morita and Robinson 2001, Figure 2.19).
The importance of sustainable development, and its relationship to cli-mate change, has long been recognized in the UNFCCC process. Article 3.4 of the Convention states as a principle that:
Parties have a right to, and should promote, sustainable development. Poli-cies and measuresto protect the climate system against human-induced change should be appropriate to the specific condition of each Party and should be integrated with national development programmes, tak-ing into account that economic development is essential for adopttak-ing measures to address climate change. (UNFCCC 1992, Article 3.4., emphasis added)
The negotiations, however, have tended to focus more on emission targets than sustainable development, due in part to the predominance of the interests of Northern countries. The links between sustainable develop-ment and climate change have received increasing attention in the recent
time Conventional development Sustainable development policies GHG emissions
literature.6 The IPCC’s Working Group III has broadened the analysis of climate change mitigation to the context of “development, equity and sustainability” in its contribution to the Third Assessment report (Banuri and Weyant 2001). The challenge considered in this chapter is to turn the conceptual link between sustainable development and climate change into a workable approach.
Global Frameworks and National Circumstances
Climate change policy can be designed to achieve a certain desirable level of atmospheric concentration of GHGs in order to meet the UNFCCC objective of “the stabilization of greenhouse gas concentrations in the atmo-sphere at a level that would prevent dangerous anthropogenic interfer-ence with the climate system” (UNFCCC 1992, Article 2). Given this objective of the Convention, many “top-down” global schemes “backcast” from an assumed GHG concentration target,7 and then allocate the nec-essary reductions accordingly across countries.8 To be successful, those approaches will need to demonstrate how they address the needs of coun-tries and people who face poverty on a significant scale. Such global schemes work out well mathematically, but may have unacceptable consequences for some developing countries.
The impacts of allocation schemes on developing countries are directly correlated with the structure of their energy economies. Primary energy requirements depend on factors such as level of industrialization, economic structure (e.g., presence of energy-intensive industries), level of motoriza-tion (car density), average climate (space heating and cooling demands), and domestic energy endowment (predominantly coal, hydro, etc). These national circumstances vary widely among countries and determine na-tional interests and therefore negotiating positions.
The national character of the SD-PAMs approach avoids a “one-size-fits-all” approach to allocating targets. Instead of “backcasting” from a future climate-policy goal, SD-PAMs starts from a country’s future devel-opment needs and then identifies the most sustainable path of meeting those needs. Starting from a sustainable development perspective “imme-diately reveals that countries differ in ways that have dramatic implica-tions for scenario baselines and the range of mitigation opimplica-tions that can be considered” (Banuri and Weyant 2001, 76). The SD-PAMs approach, by design, integrates the national development priorities of the country into its approach to climate change. The SD-PAMs approach would be particularly attractive to countries such as South Africa, for which
top-down internationally allocated targets may be difficult to agree to or achieve (Winkleret al. 2001).
As the SD-PAMs approach is national in character, it does not have links to international emissions trading. However, implementation of SD-PAMs that reduce GHG emissions are likely to be good candidates for investment under the Clean Development Mechanism (CDM).9 The CDM requires that projects reduce emissions and promote the sustainable de-velopment objectives of the host country; thus, the CDM has a clear syn-ergy with the SD-PAMs approach. Through the CDM and the tradable emission credits generated, developing countries would have some link to the emerging market for carbon credits. The prospect of a Sector-CDM (see Chapter 4) adds further potential because actions under the SD-PAMs approach would involve broader policies (e.g., changes in prices of en-ergy) that could not currently qualify as CDM projects.
Steps in Applying the SD-PAMs Approach
In practice, a country might undertake five steps in considering its com-mitment to SD-PAMs:
1. Outline future development objectives,10 where possible quantifying the expected benefits and possible risks. If a long-term vision has been articulated, backcasting to immediate action is possible. Otherwise, the country may outline shorter-term goals.
2. Identify policies and measures that would make the development path more sustainable, primarily for reasons other than climate change (e.g., greater social equity and local environmental protection while main-taining or enhancing economic growth). The sustainable development benefits should be quantified as far as possible. These SD-PAMs may be the following:
a. Existing sustainable development policy that is not fully imple-mented; or
b. New policies and / or more stringent measures.
3. Quantify the changes in GHG emissions of particular SD-PAMs, which should be reported in accordance with the Convention or other re-porting provisions.
4. Compare the results from steps 2 and 3 to show which SD-PAMs cre-ate synergies between sustainable development objectives and climcre-ate change policy, and which conflict.
5. Summarize the net impact of a basket of SD-PAMs on development benefits and GHG emissions.
Many developing countries already identify development objectives in step 1 through a National Strategy for Sustainable Development, or Agenda 21 plans. To estimate the difference in emissions with and without SD-PAMs, a projection of baseline emissions will be needed in the second step.11 The information relating to climate change benefits will be useful in implementing and funding SD-PAMs, as those offering greater GHG emission reductions can potentially attract climate change-related fund-ing. Those with greater sustainable development benefits but no climate benefits need to attract other funding. The next section applies this ap-proach to the situation in South Africa. The scope of this chapter does not allow for a full quantification or costing of either the development objectives or the GHG reductions, but examples are provided.
II. Applying SD-PAMs: South Africa as an Illustrative Example
What will the impact of more sustainable development policies and mea-sures in South Africa be on its GHG emissions? To provide a context for this discussion, some background on South Africa’s emissions profile is useful.Context of South Africa’s Emissions Profile
South Africa is a semi-industrialized country with an emissions profile that in some respects is not typical of other developing countries. Key characteristics of its economy and energy sector are not favorable in terms of GHG emissions:
•
Among major developing countries, South Africa’s emissions intensity is relatively high; in 1999, it emitted 0.96 kg of CO2 per dollar of GDP, expressed in terms of purchasing power parity (PPP),12 compared to an average of 0.61 among other non-OECD) countries.13 Reasons for South Africa’s high emissions intensity include reliance on coal resources for electricity production, the comparatively low price of electricity,14 the production of synthetic liquid fuels, a high proportion of energy-inten-sive industry and mining, and the inefficient use of energy (Winkler and Mavhungu 2001; Spalding-Fecher 2001). Coal-fired power stations account for 93 percent of South Africa’s electricity generation.15•
Similarly, emissions per capita are high at 8.22 tons of CO2 (tCO2) percapita, four times higher than the non-OECD value of 2.11 tCO2 and higher than several OECD countries (IEA 2001).
•
South Africa’s share of historical cumulative emissions (1915–95) is somewhat lower (1.17 percent) than its share of 1999 emissions (1.51percent), reflecting more recent industrialization than in the North (Winkleret al. 2001).
•
While South Africa’s GDP per capita16 lies below the world average ($3,160, compared to the global average of $4,890),17 this figure hides the gap between black and white, and rich and poor, within the coun-try.Development Priorities
The first step in the SD-PAMs approach is to identify South Africa’s de-velopment priorities. South Africa’s dede-velopment objectives focus on growth, job creation, and access to key services (including housing, water, sanitation, transport, telecommunications, energy services, and land re-form). An overview of South Africa’s development objectives was set out in the African National Congress’ Reconstruction and Development Programme (RDP) (ANC 1994). It outlined job creation through public works and meeting a range of basic needs as key priorities. However, a new macroeconomic policy, the Growth, Employment and Redistribution (GEAR) strategy, has superseded the RDP (DTI 1996). As the name sug-gests, GEAR emphasizes economic growth and jobs, while still seeking to redistribute resources. The policy highlights the financial constraints on achieving development objectives, departing from the greater emphasis on social development objectives in the RDP.
Job creation is perhaps South Africa’s most important development objective, and is closely related to economic growth. The RDP envisaged large public works programs, which have not materialized. A key element of the vision of GEAR is “a competitive fast-growing economy which cre-ates sufficient jobs for all work-seekers” (DTI 1996), aiming at 6 percent growth and the creation of 400,000 jobs per year.18 GEAR argues that growth of 3 percent per annum fails to reverse unemployment.
To achieve economic growth, the government aims to reform the labor market, reach inflation targets between 3 and 6 percent, reduce the defi-cit, accelerate tariff reduction, tighten monetary policy, and limit increases in private- and public-sector wages. Trade liberalization and the privatization of state-owned enterprises19 are seen as critical mechanisms to promote competitiveness and achieve growth. Spatial development ini-tiatives give a regional focus to the overall objective of economic growth. These initiatives are based in locations where the government hopes to facilitate industrial development through public-private partnerships, the improvement of infrastructure, the establishment of strategic anchor
projects, and the creation of industrial clusters and industrial parks (Davis and Wamukonya 1999).
Key to South Africa’s development objectives is access to services that meet basic human needs. For the purpose of illustrating the SD-PAMs approach, this chapter focuses on two areas from those listed above—en-ergy and housing.20 A more comprehensive analysis would require signifi-cant effort by a team familiar with all development sectors. Housing and energy are two sectors in which development objectives and GHG changes have been quantified in previous studies. Energy accounted for 78 percent of South Africa’s total GHG emissions in 1994 (Van der Merwe and Scholes 1998); housing is a sector in which large sustainable development benefits can be expected.
Energy development priorities
The major objectives of government policy for the energy sector, spelled out in the 1998 Energy White Paper (DME 1998), are the following:
•
Increasing access to affordable energy services.•
Improving energy governance.•
Stimulating economic development.•
Managing energy-related environmental impacts.•
Securing energy supply through a diversity of energy sources. Electrification has been a major means of extending access. The first phase of the National Electrification Programme (1994–99) increased ac-cess to electricity from 36 percent in 1993 to 66 percent by 1999.21 The program was internally funded by Eskom, the South African national util-ity, at a total cost of about R7 billion (Borcherset al. 2001). In 2000 and 2001, a further 734,000 connections have been made (NER 2000, Mlambo-Ngcuka 2002). The government plans to take direct responsibility for fur-ther electrification in a restructured power sector. Provision of energy ser-vices is not limited to grid electricity. An off-grid rural concessions pro-gram has been launched, aiming to provide a total of 350,000 solar home systems in seven concession areas. Proposals have been made to extend the concept to a package that would also include liquefied petroleum gas (LPG) for cooking and other uses (DME 2001a).A major change in governance of the energy sector is reform of the electricity industry. The way in which restructuring happens in the elec-tricity sector will have significant impact on delivery of services, as well as the future role of energy efficiency and renewable energy (Winkler and
Mavhungu 2001). Opportunities exist for independent power producers to sell renewable energy, but entry into the market is difficult under the current vertically-integrated monopoly system. Public-benefit energy effi-ciency is likely to be reduced significantly, since private investors have little incentive to invest in measures that reduce revenue (Clark and Mavhungu 2000, Dubash 2002).
In promoting greater diversity in supply, increasing the percentage of renewable energy in the electricity generation mix is a particular goal. The government strategy aims to generate 5 percent of the national grid-supplied power—including import/export—from renewable technologies, mainly from micro-hydro, biomass-fueled turbines, solar thermal, wind turbines, and photovoltaics.22 The target may be included in the govern-ment policy in the White Paper, soon to be published.
Housing development priorities
Addressing the backlog of housing is a South African development prior-ity. Estimates of the backlog of houses vary, with Hendler (2000) estimat-ing the number at 2.6 million houses in 1998 and current newspaper re-ports suggesting a backlog of between two and three million houses (Majola 2002). Roughly three quarters of the housing backlog is urban, and one quarter is rural (Hendler 2000). To meet this challenge, the aim in 1994 was to build 300,000 new units each year of the initial 5-year RDP (ANC 1994). The government provided a housing subsidy of R17,500 for first-time homeowners. The Department of Housing indicates that there were 945,555 “top structures completed or under construction” between April 1994 and July 2000.23 The RDP outlined that houses should meet basic standards, providing at minimum “protection from weather, a durable struc-ture and reasonable living space and privacy” and access to services, namely “sanitary facilities, storm-water drainage, household energy supply … and convenient access to clean water” (ANC 1994).
Shifts to Greater Sustainability
Given South Africa’s overall development objectives, its sectoral devel-opment priorities, and its emphasis on local community develdevel-opment, a number of further shifts to sustainability are possible (step 2 of the SD-PAMs approach). As illustrated in Figure 3.2, current policy probably lies somewhere between a conventional development path and sustainability. Managing energy-related environmental impacts is already part of policy, for example, and is being implemented through programs to promote
en-ergy efficiency and renewable enen-ergy—even if progress in some areas is still slow (Spalding-Fecher 2001, 10–15). Business as usual (BAU) refers in this chapter to development as stated in current policies, already an improvement on the conventional development path. Emission reduc-tions from BAU therefore do not include GHG changes due to current policy relative to a more conventional development path.
This section outlines possible SD-PAMs for the energy and housing sec-tors.
SD-PAMs: Electricity
As discussed, the energy sector is a major focus of the government’s devel-opment objectives. SD-PAMs promoting greater efficiency, increasing the share of cleaner energy, protecting public benefits in liberalizing markets, and providing free electricity can achieve these objectives in more sus-tainable ways.
i. Efficiency
A national target for greater efficiency in electricity consumption can lead to energy savings, local environmental benefits, and GHG reductions. A recent study (Laitner 2001), using an input-output model of the South African economy, showed that a 5 percent increase in electricity efficiency in 2010 would lead to a net increase of some 39,000 jobs and labor income of about R800 million. The primary reason for the increases is that spend-ing is diverted away from sectors with lower wage and salary multipliers
Figure 3.2.
Theoretical Impact of Current South Africa Policy on Trajectory of Greenhouse Gas Emissions Relative to Conventional and Sustainable Development Paths time Sustainable development policies GHG emissions Current SA policy (BAU) Conventional development
toward construction, finance, and manufacturing, which have higher in-come multipliers. While not analyzed in detail, a national drive toward energy efficiency of this scale would reduce emissions of carbon dioxide by about 5.5 million tons of CO2 (MtCO2) in 2010.24
End-use energy efficiency by electricity consumers is another measure that saves energy and also reduces GHG emissions. Where energy efficiency reduces overall electricity consumption, it also reduces the overall need for installed capacity.25 Apart from savings of energy costs, industry often benefits through increased process control and increased productivity. Analysis of one energy efficiency scenario against business as usual by Howells (2000) estimated annual CO2 reductions of 8 MtCO2 by 2010 and 19 MtCO2 by 2025.26
An example of a program to improve end-use energy efficiency is Eskom’s Efficient Lighting Initiative, which aims to install 18 million compact fluorescent lights (CFLs) to reduce energy demand in the residential sec-tor (Eskom 2000a). Assuming that the CFLs require only 20 percent of the power for the equivalent incandescent and are used 6 hours per day, Eskom estimates a total energy savings of 4,000 gigawatt-hours (GWh) per year, although this depends on the extent of the “take-back effect.”27 The system average emissions of 0.85 kg CO2 per kilowatt-hours (kWh) (Eskom 2000b) would imply annual savings of 3.4 MtCO2.28
ii. Increasing share of cleaner electricity
The Minister of the Department of Minerals and Energy (DME) has re-cently re-stated that “renewable energy plays an important role in the energy mix and increases supply security through diversification” (Mlambo-Ngcuka 2002). Achieving this goal has focused so far on developing the Southern African Power Pool, planning increased imports of hydropower, and developing gas markets. Future policy might aim at increasing the share of renewable electricity, which so far has remained in the research, development, and demonstration phase.
A study for the South Africa Country Study on Climate Change (Howells 2000) analyzed the impact on GHG emissions of a cleaner gen-eration mix for bulk energy supply, with a proposed mix consisting of 10 percent nuclear, 10 percent combined-cycle gas turbines, 10 percent im-ported hydropower, and 1 percent renewables by 2025. Reductions in an-nual CO2 emissions against a business-as-usual case were estimated to be 33 MtCO2 by 2010 and 70 MtCO2 by 2025. The costs of the new plants were found to be higher than that of the business-as-usual projection, and
the mitigation cost would be about US$2.70 per tCO2.29 The emission reductions stem primarily from the increased nuclear, hydropower, and gas capacity, assuming that no GHG emissions are associated with hydropower sources.
A more aggressive policy would be a Renewable Electricity Portfolio Standard. Such a standard might require a basket of options that meets the DME’s target of 5 percent of renewable electricity generation by 2010 (Mlambo-Ngcuka 2002). This target may be formalized in a Renewable Energy White Paper, which was under discussion in 2002. The South Af-rican Climate Action Network, a group of nongovernmental organiza-tions (NGOs) concerned with climate change, has called for a renewable energy contribution of 10 percent to electricity generation by 2012 (i.e., within 10 years of the World Summit on Sustainable Development) and at least 20 percent by 2020 (SA-CAN 2002).
A first approximation of the impacts of such targets can start with the same baseline emission projection for the bulk energy sector used above. The key assumptions are 2.8 percent annual increase in electricity de-mand, no climate policy, and new generation capacity, which follow the patterns of the past (Howells 2000). The BAU scenario departs from such conventional development in that it already assumes more advanced and cleaner fossil fuel technologies, an increased share of gas, and more im-ported hydropower. Assuming that the renewable energy for electricity generation has no emissions and displaces a 2010 generation mix similar to the present (93 percent coal-fired), then the reduction of CO2 emis-sions due to 5 percent renewables by 2010 is 10 MtCO2. A shift of 20 percent renewables by 2025 would yield reductions of 57 MtCO2. These reductions are lower than the cleaner generation mix, since that scenario assumed 31 percent of energy supply was low-emissions (i.e., nuclear-gas-hydropower), while this approach proposes increases to only 20 percent. The reductions are significant in the context of 1999 CO2 emissions from fossil fuel combustion of 346.3 MtCO2 (IEA 2000). The comparative costs of such a portfolio, as well as the impacts on job creation and local eco-nomic development, need to be included in future analysis.
iii. Protecting environmental public benefits under restructuring
Greater sustainability in energy governance means maintaining or enhanc-ing public benefits (both environmental and social public goods) in the context of the electric power-sector restructuring process. Determining the GHG impact of such policy interventions is also necessary.
Restruc-turing must provide for new forms of regulation that promote energy effi-ciency and renewable energy. Distributors may be required to commit a percentage of their total investment to energy efficiency, although the lack of financial viability makes this unlikely in the short term (Winkler and Mavhungu 2001). As of 2002, Eskom was conducting a study on its contribution to sustainability. No estimates of changes in GHG emissions attributable to these policies are available in the literature.
Restructuring also potentially opens access to the grid to independent power producers (IPPs) of renewable energy. Policies and measures required to ensure this happens would include standard contracts for IPPs and non-discriminatory access to the grid. The adoption of a Renewable Energy White Paper with quantified targets for renewable energy generation could set a target.
iv. Providing free electricity—the poverty tariff
The government has committed itself to providing between 20 and 60 kWh of free electricity per month to low-income households. Implement-ing this “poverty tariff” would provide enough power for poor customers to have access to lighting and entertainment services. If extended to all cus-tomers in a broad-based approach,30 the poverty tariff might at most in-crease emissions by 0.122 MtCO2, under the assumption that all the free electricity would be additional to existing energy use (UCT 2002). In prac-tice, electricity is likely to displace existing use of paraffin, coal, wood, candles, batteries, and other fuels to some extent. This upper-bound esti-mate represents 0.03 percent of total GHG emissions, but about 1.6 per-cent of residential sector emissions in 1994.
SD-PAMs: Housing
How could the delivery of housing be achieved in a more sustainable man-ner? The DME suggested that “50 percent of all new houses built (includ-ing RDP houses) … incorporate climate conscious solar passive design principles in their construction (thereby eliminating the need for space heating and cooling)” (DME 2001b).
A previous study by the Energy & Development Research Centre (EDRC, an academic research institute based at the University of Cape Town) examined the energy savings, local environmental benefits, and GHG reductions from energy efficiency interventions in low-cost housing (Winkleret al. 2000).31 The interventions examined focused primarily on improving the energy efficiency in a standard 30-square-meter house32 and
included installing a ceiling, roof insulation, wall insulation, optimizing window size, and adding a partition, as well as a package of all these mea-sures. Interventions in row houses and shacks, as well as lighting and wa-ter heating, were also included. The additional cost of these inwa-terventions was on the order of R1,000 to R2,000 per household.
The major local sustainable development benefit from these interven-tions is reduced household expenditure on energy. While small in abso-lute terms, these savings are significant for low-income households, which devote a relatively large proportion of household expenditure to energy. The interventions also contribute to improved health, because they re-duce or eliminate indoor air pollution from burning coal or wood, as well as paraffin fires and poisoning caused by ingestion of paraffin. Energy effi-ciency may also increase employment if implemented in a labor-intensive program (Irurah 2000).
Energy efficiency reduces energy consumption, and thereby avoids CO2 emissions from burning fossil fuels, both in homes and in power stations. Avoided emissions were calculated based on the energy savings at the house-hold level using South African emission factors. Interventions that save the most energy for the household (ceilings, wall insulation, solar water heating) also avoid the most emissions.
Taking each intervention and aggregating to the national level, the potential GHG reduction ranges between 0.05 and 0.6 MtCO2 per year, depending on the intervention (Winkleret al. 2000). Although this is a small contribution to potential national emission reductions, the advan-tage of these mitigation options is their low cost and their significant de-velopment benefits.
Changes in GHG Emissions
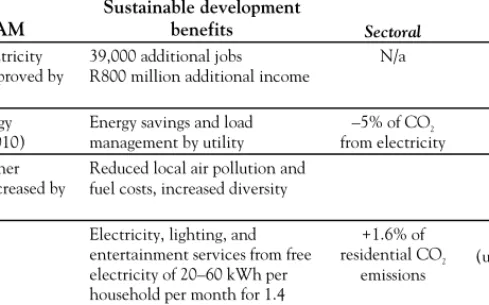
The third step in the SD-PAMs approach is to consider the changes in GHG emissions resulting from SD-PAMs. These changes in emissions have been outlined for each of the SD-PAMs individually in the previous sec-tion and are summarized in Table 3.1. The table also reports the sustain-able development benefits and contextualizes the GHG changes, by com-paring them with national and, where appropriate, sectoral CO2 emis-sions in 1999. On the basis of such information, policymakers could choose the SD-PAMs that best meet multiple objectives.
A Basket of SD-PAMs?
The SD-PAMs in Table 3.1 are not a comprehensive set; they focus only on two sectors and selected policies. From this initial consideration, how-ever, it appears that most SD-PAMs have more potential for reducing GHG emissions than increasing them. The change in an energy price—that is, the poverty tariff—is the only example of an increase here, yet its impact on overall emissions is small. Since SD-PAMs already include a shift to greater sustainability relative to conventional development,33 synergies are more likely.
The examples of SD-PAMs from the energy and housing sectors have illustrated some measures with strong sustainable development benefits, some with potential for GHG emission reductions, and some that meet both objectives. Conducting a complete analysis across all sectors would
Table 3.1. Summary of Changes in CO2 Emissions for Selected Sustainable Development Policies and Measures (SD-PAMs) in South Africa
Percentage of CO2 emissions,
1999 SD-PAM
Sustainable development
benefits Sectoral National
National electricity efficiency improved by 5% (2010)
39,000 additional jobs R800 million additional income
N/a –2%
End-use energy efficiency (2010)
Energy savings and load management by utility –5% of CO2 from electricity –2% Share of cleaner electricity increased by 5% by 2010
Reduced local air pollution and fuel costs, increased diversity
–3%
Poverty tariff Electricity, lighting, and entertainment services from free electricity of 20–60 kWh per household per month for 1.4 million poor households
+1.6% of residential CO2 emissions +0.2% (upper bound estimate) Energy efficiency in low-cost housing
Household energy savings, reduced indoor air pollution, improved health, and increased levels of comfort –0.6% to –7% of residential CO2 emissions –0.01% to –0.2%
Sources: See text on individual SD-PAMs.
Note: The latest estimate of South Africa’s total greenhouse gas (GHG) emissions is for 1994; thus, more recent emissions data, covering CO2 only, are used. CO2 contributed more than 80 percent of South Africa’s total GHG emissions in both the 1990 and 1994 inventories.
require an interdisciplinary team and significant time and data. Many non-Annex I countries would require assistance in conducting such analyses.
A number of synergies between shifts in sustainable development and GHG reductions are apparent in the energy sector. Energy efficiency is the clearest example, saving on energy costs while reducing GHG emis-sions. SD-PAMs that promote national electricity efficiency achieve elec-tricity savings, create jobs, add to income, and reduce GHG emissions. A relatively small additional investment in housing for poor communities creates more comfort and reduces household energy costs while cutting emissions from the residential sector.
The poverty tariff provides an example of a conflict between sustain-able development and GHG reductions. However, the magnitude of the effect is uncertain, since the degree to which electricity replaces other fuel use is not well known.
Cost has not been explicitly considered in this analysis. In combining SD-PAMs in a basket of measures, some measures that require additional investment have net negative costs over their lifetime. Savings made through energy efficiency could potentially be used to promote a cleaner energy mix. The incremental costs of measures with net costs could be offset against those with net benefits in a basket of SD-PAMs.
Taking the SD-PAMs Approach Further
The last step in the SD-PAMs approach is to consider the overall effect on GHG emissions of a basket of SD-PAMs. Given that this initial study has not covered sectors comprehensively and that some of the SD-PAMs con-sidered here do not have quantified estimates of changes in GHG emis-sions associated with them, this last step has not been undertaken. Even without this step, the approach identifies areas in which developing coun-tries could act. If, however, this approach is to be linked to a target of global emissions, then this data-intensive step becomes important.
A refinement of the SD-PAMs approach would be to compare stated policy objectives to the country’s track record in implementing policies. Projecting this forward (including a gap between stated intentions and actual achievement) might create a more realistic future development sce-nario. Having illustrated the SD-PAMs approach with the South African example, we consider how this approach could be extended to other de-veloping countries.
III. Extending and Formalizing the Approach
Formalizing the SD-PAMs approach is important not only to monitor whether the commitments are actually implemented but also to challenge perceptions that developing countries are doing nothing on climate change. The materials to formalize the approach can already be found in the Con-vention and Protocol. Implementing the approach, however, would re-quire some new provisions, including reporting, oversight, and financing.
The Basis of SD-PAMs Commitments
As described in the introduction to this chapter (and in Chapter 1), de-veloping-country participation can take several forms. The Kyoto Proto-col sets targets for industrialized countries in the form of binding emission reductions or limits. These commitments are subject to strict monitoring and reporting requirements and mandatory consequences for instances of non-compliance.34 The SD-PAMs approach suggests a different kind of pledge. As described above, the “commitment” would be to implementing and accelerating national sustainable development plans. Such commit-ments would initially be voluntary, although they could be made manda-tory for at least some developing countries.
The basis for such a commitment is found in the Climate Convention, to which almost all developing countries are signatories. Under Article 4.1(b), all Parties commit themselves to “formulate, implement, publish and regularly update national and, where appropriate, regional programs containing measures to mitigate climate change by addressing anthropo-genic emissions by sources and removals by sinks of all greenhouse gases.”35 Using SD-PAMs as a pledge to implement policies for sustainable devel-opment would be consistent with Article 10 of the Protocol, which re-affirms existing Convention commitments and aims to “advance the imple-mentation of these commitments in order to achieve sustainable develop-ment” (UNFCCC 1997a). This commitment is currently not quantified for developing countries in the same way as for industrialized countries listed in Annex B of the Kyoto Protocol.
Reporting Provisions
While the SD-PAMs commitment would initially be voluntary, a simple reporting system should be established to formalize the commitment of those countries that pledge to implement SD-PAMs. This would require a decision of the Conference of the Parties to establish a registry of SD-PAMs, regular reporting by Parties on their SD-SD-PAMs, and support from
the Secretariat for maintaining records of implementation. If voluntary commitments prove successful, a next step would be to make SD-PAMs mandatory for a group of middle-income developing countries. Some de-veloping countries might view this as intergovernmental control over na-tional policymaking, which could present a political obstacle.
This reporting would be similar in spirit to Article 12.4 of the Conven-tion,36 which says that developing countries may voluntarily propose miti-gation projects. The proposed reporting would extend to all SD-PAMs, including those that are not project-based. If countries choose to pledge SD-PAMs, they must report on them and open them for review. In order to assess progress against SD-PAMs pledges, a system of indicators for sus-tainable development could be adapted from various sources.37
Reporting of SD-PAMs could be included in national communications. This would have the advantage that the information would be addressed in the in-depth reviews. However, the process of national communica-tions has become highly politicized, in particular around the provision of technical and financial resources.38 Given that some developing countries are not submitting their initial national communications, it might be pref-erable to separate the register of SD-PAMs from this process.
Financing SD-PAMs: Who Pays?
A key barrier to the implementation of SD-PAMs in developing countries is the lack of financial resources. Determining who pays for SD-PAMs is integrally related to the question of formalizing the pledge in the manner suggested above. Countries are unlikely to fulfill pledges unless they have the resources for implementation. Under Article 4.3 of the Convention, developed-country Parties are already committed to paying “full agreed incremental costs” for implementing measures under Article 4.1. If SD-PAMs are adopted under Article 4.1b, the question of payment should in principle be decided already. Where incremental costs are not sufficient, supplementary funding from multilateral institutions, bilateral aid, for-eign direct investment, and domestic investment may be needed. For those SD-PAMs with no net implementation costs (e.g., some end-use energy efficiency), only program costs would require funding.39 Costs of reporting and review should be funded to the “agreed full cost.” The commitment to funding is repeated in Article 11 of the Protocol. The challenge is to en-sure that funds actually flow.
The sources of funding would differ between those SD-PAMs that have synergies with GHG reduction and those that are neutral or conflict.
SD-PAMs with GHG reduction potential should receive climate change-re-lated funding, including investment through the CDM and Sectoral CDM, climate change funds through the Global Environmental Facility (GEF), and the nascent funds established under the Convention (special climate change fund, least developed country fund) and Protocol (adaptation). Some of these funds would be most suited to projects (CDM), others to enabling activities (GEF) or policy changes (e.g., under Sectoral CDM; see Chapter 4).40 Providing funding for such projects would be a major incentive for developing countries to take action on climate change. De-veloping countries could use the SD-PAMs framework to steer financial flows from multiple sources toward climate-friendly sustainable develop-ment projects.
SD-PAMs that do not decrease GHG emissions could not draw on cli-mate change funding. They would depend on funding for sustainable de-velopment from multilateral institutions, bilateral aid, foreign direct in-vestment, and domestic investments. SD-PAMs also has the potential to harness domestic investment. Further work is needed on the funding of SD-PAMs, especially for implementation.
Which Developing Countries Might Be Particularly Interested in SD-PAMs?
The SD-PAMs approach should be attractive to all developing countries, since its starting point is their own development objectives. The approach should be particularly interesting for developing countries such as South Africa, for which a global allocation provides no surplus credits to sell (and, hence, little incentive to join the system). These are likely to be countries that have already industrialized to a significant extent or, as a result of their particular endowment of energy resources (e.g., large fossil fuel reserves), have used up significant portions of their share of accept-able emissions in a per capita convergence approach (see Chapter 8).
Two ways of indicating which countries might fall into this group would be ranking them by emissions intensity (CO2 per unit of GDP) and order-ing developorder-ing countries by ability to pay (GDP per capita). The political criteria to apply to such a grouping would be to include only developing countries and to exclude economies in transition (including the former Soviet republics). Members of the Organization of Petroleum Exporting Countries (OPEC) would rank high in emissions intensity and ability to pay but might nonetheless prefer SD-PAMs pledges to mandatory emis-sion limitation targets. In negotiating developing-country participation,
particular attention should be paid to the fact that “global CO2 mitigation is likely to negatively affect countries that are largely dependent on coal and oil for energy production or export revenues” (Berket al. 2001, 18). SD-PAMs can offer a “just transition” for communities that would be nega-tively affected by climate change mitigation.
The approach should also be attractive to least developed countries. The attraction is based on the particularly urgent need for development of least developed countries. A focus on sustainable development would make more sense than any commitment to reductions or limitations of GHG emissions from least developed countries, which are small by international standards.
IV. Relationship to the Climate Convention Objectives
The SD-PAMs approach is a response to climate change starting from development, rather than a commitment to quantified emission limita-tions targets. While this should be attractive to most developing coun-tries, how does the approach relate to the ultimate objective of the UNFCCC?
Starting from Development
The greatest strength of the SD-PAMs approach is that it starts from a country’s development needs and moves toward greater sustainability. Article 2 of the UNFCCC requires that the path to stabilization of con-centrations enable “economic development to proceed in a sustainable manner” (UNFCCC 1992). Most developing countries are already com-mitted to doing this. Indeed, they are looking for resources to accelerate this shift.
The approach focuses on the first steps that developing countries might take, rather than offering a one-step solution to the global problem of climate change. Because it matches countries’ own priorities, it provides incentives for early action on climate change. Each country would need to consider its own development policies and how those policies could be made more sustainable. The process of formulating development objec-tives and implementation plans will strengthen coordination between or-ganizations. In this way, the SD-PAMs process will build capacity (politi-cally, techni(politi-cally, financially, and institutionally) in developing countries to tackle policies that reduce emissions. Developing countries can learn by doing by pursuing innovation, development, and transfer of cleaner technologies.
Even within the country, there will be differing views on what the shift to sustainability should entail. Local community benefits—both environ-mental and developenviron-mental—should drive the approach. Tensions between the views of stakeholders from government, business, and civil society are likely to arise. Also, barriers to implementing sustainable practices need to be overcome.
Internationally, a country-specific approach avoids the drawbacks of top-down approaches, which seek to address all countries in the same way and are, invariably, not appropriate to the circumstances of some countries. As long as SD-PAMs can realize the pledge to implementing sustainable de-velopment, it has the advantage of starting from each country’s unique situation.
Will SD-PAMs Prevent Dangerous Climate Change?
The ultimate objective of the Convention is to prevent dangerous inter-ference with the climate system (UNFCCC 1992, Article 2). This objec-tive is to be achieved in a way that allows ecosystems to adapt, ensures food security, and enables economic development in a sustainable man-ner. The SD-PAMs approach clearly meets the last condition of achieving the ultimate objective, but does it contribute to stabilization of GHG con-centrations?
The answer to this question is indeterminate. The South African ex-ample showed that a difficult step is to aggregate the impacts of all the policies and measures. At a global level, the uncertainty is likely to be even larger. It not only requires comprehensive analysis across all devel-opment sectors but it is also sensitive to assumptions about the path of future development (which no one knows). This step is critical if one wants to compare the result from SD-PAMs to other approaches. It is possible that SD-PAMs would lead to a reduction from business-as-usual emissions but not reduce emissions to “safe” levels if pursued indefinitely.41 If this were the case, it would undermine the sustainable development of devel-oping countries in particular since they are most vulnerable to the impacts of climate change. Without quantified targets for GHG emission limita-tions, the SD-PAMs approach cannot guarantee a specific level of global GHG emissions.
On the other hand, striving for a world oriented toward sustainable development will make it easier to meet stringent climate goals, as dis-cussed in Chapter 1, Section I (IPCC 2000a; Berket al. 2001). If SD-PAMs are really successful, this may even be all that is needed. There is
good reason to believe that greater sustainability in development paths will “bend the curve” of emissions. Framing the approach in terms of sus-tainable development puts incremental decisions in a framework consis-tent with longer-term targets (see Corfee-Morlot 2002). SD-PAMs can be pursued, even if the net impact on GHG emissions is unknown.
V. Summary
The major strength of the SD-PAMs approach is that it acknowledges each country’s unique situation and starts from its own development ob-jectives. The key weakness, from a global climate change perspective, is that it does not guarantee a global reduction in GHG.
The approach may be a useful first step toward developing country par-ticipation in climate change mitigation and a learning strategy. If early action on sustainable development leads to effective new markets, tech-nologies, and creative policy solutions, developing countries may later be in a better position to accept other kinds of commitments that quantify emission limitations.
As outlined in Chapter 2, Annex I Parties themselves initially adopted non-binding pledges in the late 1980s and 1990s before accepting quanti-fied and legally binding commitments under the Kyoto Protocol. If SD-PAMs proves robust and successful in reducing GHG emissions, it may be all that is needed in the long term. Moving onto a more sustainable path will build trust for considering other forms of commitments in the future (e.g., third or fourth commitment period). The approach advocates for doing what is possible now and working toward a long-term solution through a series of gradual steps.
Notes
1. IPCC (2001c, 89, but note the caution about use of annual emission for comparison on page 90).
2. Other approaches to developing country commitments are examined in this volume and previous literature (Baumertet al. 1999, Sari 1998).
3. The political process at the Third Conference of the Parties in Kyoto followed a pledge-based approach, rather than a rule-based allocation scheme. Each Annex I country proposed a commitment it might be likely to adopt and, through horse-trading, agreements were struck to reach the final percentage. Characteristics of the industrial and energy economy shaped their national interests which in turn drove their negotiating positions. While arguments were often based on such interests, no systematic quantified analysis of these influences was undertaken. This allowed some industrialized countries to negotiate targets greater than 100 percent of 1990 levels
(Australia 108 percent, Iceland 110 percent, Norway 101 percent) (UNFCCC 1997a). The average global reduction of 5.2 percent reflects no systematic assess-ment but is simply an average of the voluntary commitassess-ments of Annex I countries. 4. See, for example, Mwandosya (2000, 147), Sokonaet al. (1999), Berket al. (2001:
11).
5. In the language of the IPCC emission scenarios, implementing SD-PAMs would help ensure that we are on the path of a more environmentally friendly B1 or B2 world, rather than an A1 world.
6. See, for example, Byrneet al. (1998), Davidson and Nakicenovic (2001), Davidson et al. (2001), ENDA-TM (2001), Munasinghe (2001), and UCS (2001).
7. The IPCC has not defined an atmospheric concentration of greenhouse gases that constitutes “dangerous interference.” Different benchmarks are used for illustrative purposes, sometimes the “doubling of CO2” (about 550 parts per million) or the 450-ppm mark.
8. See, for example, Claussen and McNeilly (1998), Gupta and Bhandari (1999), Redefining Progress (1999), Sijmet al. (2000), Torvanger and Godal (1999). 9. The CDM allows industrialized countries to meet their emission reduction targets by
investing in mitigation projects in developing countries, which have no targets. CDM projects must meet the sustainable development objectives of the developing country. Credits for emission reductions are effectively sold to the industrialized country.
10. The default would be to examine development objectives for all sectors. However, some pre-screening of sectors that are deemed most likely to show synergies between sustainable development and climate change could help limit the analysis to a more manageable subset of sectors.
11. Emissions would be reduced in relation to emission projections based on current policy. The biggest problem with doing this relates to high levels of uncertainty about future emissions in developing countries. For SD-PAMs that are project-based, baseline methodologies are being developed through the CDM. For SD-PAMs that require sectoral, multisectoral, or national baselines, further method-ological work is needed (see Chapter 4 on sectoral baselines). Politically, such baselines might be seen as similar to a formal commitment, detracting from the voluntary nature of SD-PAMs.
12. Purchasing power parity dollars, using 1990 prices and exchange rates.
13. The previous version of the International Energy Agency (IEA) data—for 1998— showed a more dramatic difference, with South Africa at 1.81 kg CO2 per dollar of GDP (PPP) compared with a non-OECD average of 0.70 kg CO2. One reason for
the difference may be a change from a base year of 1990 to 1995.
14. Electricity prices in South Africa are low compared with other countries. This does not, however, take into account external costs or the fact that most investments have been paid off. Prices are likely to rise in future.
15. Based on net energy sent out; by installed capacity, the coal share is 89 percent (NER 2000).
16. GDP per capita is not directly part of the emissions profile, but it is a key character-istic shaping a country’s ability to pay for mitigation and adaptation.
17. Reported as GNP per capita using exchange rates, based on 1999 dollars, by the World Bank Atlas method (World Bank 2000). South Africa was ranked 86th by this
method and 69th when purchasing power parity is used.
18. This objective has not been achieved in past years. The unemployment rate was officially estimated at 25.8 percent for September 2000 (South Africa Reserve Bank 2001), with 11.9 million people employed in February 2000 (Majola 2002). 19. The focus of privatization is on the four big parastatals: Eskom (electricity utility),
Transnet (transport), Telkom (telecommunications), and Denel (arms).
20. Several other objectives, for example, providing all citizens with 50 to 60 liters of clean, safe water per person per day; or redistributing 30 percent of land and settling land claims, are not elaborated here. A complete study would need to gather data on all sectors, in particular to complete the fifth step of evaluating the net effect of a basket of SD-PAMs.
21. Access in 1999 remained lower in rural areas (46 percent) than in urban areas (80 percent).
22. The Department of Minerals and Energy produced a draft strategy for Renewable Energy, which is currently being turned into a White Paper (DME 2001b). 23. Department of Housing website, http://www.housing.gov.za/Pages/Indicators/
July%202000/wpeD.gif
24. Laitner (2001) gives the figure in units of carbon, that is, 1.5 MtC.
25. In some cases, households may spend energy savings on increasing their consump-tion, a phenomenon known as the take-back effect. See note 27.
26. A business-as-usual scenario assumed a 2.8 percent increase in demand per year, no climate policy, and new generation capacity following the trends of the past (Howells 2000).
27. One of the major challenges to energy efficiency analysis, especially for the residential sector, is the question of the “take-back,” or “rebound,” effect: Because energy-efficiency interventions essentially decrease the price of energy services, consumers might spend some of their savings on more of that energy service—so energy consumption may not decline nearly as much as would be predicted on the basis of the technical potential of an intervention. In many developing countries, and particularly in their poorest communities, the level of energy services in poor households is often very low with inadequate lighting, space-heating, and other services, so the rebound effect could be high (Davidson and Sokona (2001), Mehlwana and Quase (1999), Roy (2000), and Simmonds and Mammon (1996)). For the energy-efficient lighting program, the households already have incandescent electric lighting. Given that lighting is often the only electricity service that is affordable for the poor, and that even poor households have several bulbs per household, take-back would be expected to be relatively small (Spalding-Fecheret al., 2002).
28. The baseline against which energy savings from the efficient lighting project are measured would make a significant difference. An earlier study considering different baselines (weighted average or 10th percentile; fuel-specific or sectorwide) found
savings ranging between 0.8 and 37 MtCO2 per year. The simple calculation shown here falls toward the low end of this range.
29. R15 per ton of CO2, converted by the exchange rate for the base year of the data, 1998—R5.53 per dollar (South Africa Reserve Bank 2001)—is the equivalent of US$2.71 per ton of CO2.
30. The study also considered scenarios in which the poverty tariff is extended only to self-targeted households, resulting in lower incremental emissions.
31. Winkleret al. (2000) is part of a larger research project (Irurah 2000). 32. The standard for RDP houses was initially 30 square meters, but due to strong
householder resistance to small units, slightly larger homes (e.g., 42 square meters) have also been built.
33. This argument is strengthened if we consider SD-PAMs against baselines that allow growth. This is explicitly allowed in the CDM rules (UNFCCC 2001, para. 46, p. 37), since the “specific circumstances” of developing countries require development. Analysis of baselines at the project level has suggested that credit should be given for reductions in a situation of suppressed demand (Winkler and Thorne 2002). 34. Monitoring and reporting provisions are outlined in Articles 5, 7, 8, and 18 of the
Protocol and have been the subject of detailed negotiations since 1998. 35. UNFCCC (1992, Article 4.1b). The heading of Article 4 is “Commitments.” 36. Article 12 deals with national communications, and paragraph 4 reads, “Developing
country Parties may, on a voluntary basis, propose projects for financing, including specific technologies, materials, equipment, techniques or practices that would be needed to implement such projects, along with, if possible, an estimate of all incremental costs, of the reductions of emissions and increments of removals of greenhouse gases, as well as an estimate of the consequent benefits.”
37. Existing work on indicators for sustainable development in the climate change context includes guidelines and methods developed by the Commission on Sustainable Development (CSD 1995). There is also an ongoing process in the UNFCCC negotiations on “good practices” in policies and measures. For the energy sector, the Helio network has developed and applied sustainable energy indicators (Helio International 2000). A practical method applied to CDM projects (Thorne and La Rovere 1999) could potentially be extended to use at the national level. Chapter 1 of the IPCC’s Working Group III Third Assessment Report summarizes the broader debate on sustainable development and climate change, and Chapter 10 focuses on decision analytical frameworks (IPCC 2001c).
38. See the language in UNFCCC (1992, Article 12.7).
39. SD-PAMs would not all be no-regrets or negative-cost options. Indeed, the point of SD-PAMs is to switch the primary focus from emission reductions to sustainable development. This implies assessing cost-effectiveness not only in terms of emis-sions, but rather in terms of socioeconomic and local environmental benefits.
40. CDM investment is linked to projects and therefore unlikely to fund policy changes, for example, energy policy reforms or industrial strategy. Yet, such policy changes may well be critical to limiting GHG emissions. The Sectoral CDM approach (Chapter 4) would overcome this limitation.
41. Berk et al. (2001, 25) make a similar, but more quantified, argument in relation to the emissions intensity approach: “If the group of countries adopting quantified commitments after the first commitment period would be limited to middle income developing countries, and these countries would initially only take on efficiency improvement targets, and if this would set a precedent for relatively poor, but major developing countries like India and China, CO2 stabilisation levels of 550 ppmv or