Electronic copy available at: http://ssrn.com/abstract=2460301 Electronic copy available at: http://ssrn.com/abstract=2460301
Evidence from the
TASTE Project
Entrepreneurship in Italy:
Electronic copy available at: http://ssrn.com/abstract=2460301 Electronic copy available at: http://ssrn.com/abstract=2460301
Executive summary 1
Empirical analyses 4
Companies’ general characteristics 5
Shareholders and entrepreneurial teams 13
Individual shareholders 15
Financial shareholders 17
Public shareholders 18
Industrial shareholders 20
Companies’ innovation and growth strategies 21
Innovation 21 Internationalization 26 Companies’ performances 27 Survival rate 27 Annual revenues 29 Milestones 33 Conclusions 34 References 35 Appendix 37 Methodological note 37
contents
Evidence from the TASTE Project
Technical Report
June 2014
Daniela Bolzani, Riccardo Fini*, Rosa Grimaldi, Simone Santoni, Maurizio Sobrero University of Bologna, Italy
We kindly acknowledge research support from Maria Vittoria Amaduzzi, Antonella Bedini, Alessia Bernardi, Annamaria Caprioli, Fabio Ceneri, Denise Falchetti, Adele Gori, Salvatore La Malfa, Andrea Maisto, Antonio Menna, Massimo Monesi, Leone Navacchia, Cecilia Piombini, and Michel Ventura.
We also thank Enrico Forti and Francesco Lissoni for sharing their insights on, respectively, Italian (project IRIS – http://patiris.uibm.gov.it/home) and European (project APE-INV – http://www.esf-ape-inv.eu/) patenting by Italian academics.
The TASTE project (TAking STock: External engagement by academics, #303502, PI: Riccardo Fini - www.project-taste.eu) is financed by the European Commission under the FP7-PEOPLE-2011-CIG scheme of the EU’s Seventh Framework Programme (FP7) for the period 2012 – 2016.
Executive summary
Over the last 20 years, academic institutions have been heavily investing in the commercialization of their research results all over the world. Knowledge transfer has gained momentum because of a more general research fund shortage, which has fostered universities to look for alternative sources of financing. At the same time, there has been a widespread belief that the commercialization of research results is useful and desirable for enhancing the economic and technological development of countries.
As a result, policymakers have been implementing legislation to stimulate the involvement of universities in the commercialization of research and, more generally, to create conducive conditions to promote it. An important part of this effort has been dedicated to stimulating the creation of new research-based ventures (i.e., academic spin-off companies), which is the focus of the present report. Academic spin-offs matter because they embody scientific knowledge and allow for the creation and development of the most important technologies, which can then be transferred to larger, more established companies. Generally speaking, knowledge-based and innovative firms are regarded as precious engines for growth in terms of industrial productivity and job creation (Kauffman Foundation, 2010; OECD, 2013).
Large differences exist in the entrepreneurial processes in academia around the world due to differing institutional features and the idiosyncratic organization of academic research. In particular, there is often a contrast between policy measures undertaken to encourage the commercialization of academic research activities and the reluctance to give more autonomy to universities. This is the reason why deep differences can be found between the US and European systems (e.g., see Fini et al., 2010; Wright et al., 2007) and why it is relevant for researchers to undertake in-depth analyses of academic entrepreneurship in different contexts.
In Italy, this phenomenon has increased significantly in the last 15 years (Baldini et al., 2014), following the introduction of a new dedicated regulatory framework focused on supporting scientific and technological research, knowledge transfer, and researchers’ mobility (Law 297/1999 and Ministerial Decree 593/2000). The creation of academic spin-off companies is therefore a consolidated phenomenon in the country. As highlighted by the Netval Reports (e.g. Report 2014 by Bax et al., 2014, but also see Balderi et al., 2011), this process started during the ’70s and evolved through a series of phases that gradually led to acceptance, enthusiasm, development, and differentiation of such initiatives.
The attention to science- and technology-based entrepreneurship now plays a significant role in Italian policy orientations aimed at promoting growth. In addition to the interest in research-based entrepreneurship, Italy has moved towards policies to support innovative start-ups (e.g., Law 221/2012), entitling these companies to a series of benefits, such as tax credits, flexible labor arrangements, and easier access to financial instruments (e.g., seed and venture capital, equity crowdfunding, bank guarantees).
Because public and private money is increasingly going to be invested to sustain these initiatives, understanding how the process of commercialization of public research operates and assessing its impact are relevant for policymakers and managers. We therefore need credible, rich and open data that address academic entrepreneurship in order to better comprehend its determinants and gauge its effectiveness.
Thus, the TASTE (Taking Stock: External engagement by academics) project aims at offering such information in a structured and longitudinal way (http://www. project-taste.eu). TASTE has been and continues to be carried out within the Department of Management of the University of Bologna (UNIBO). Starting in the year 2000, TASTE systematically collects information on the population of 95 Italian universities, including multilevel-longitudinal data on their personnel, internal policies, departments, patenting and spinout activities, and the characteristics and entrepreneurial support mechanisms of the 20 Italian regions (see Methodological Note in Appendix).
In this report, updated to 2013, we focus on the 1,010 firms that have spun-off from Italian universities1 and on their shareholders (5,423 shareholders in 2013). Specifically, we provide a
general description of these companies, their main characteristics, some of the strategies they employ to grow and serve the markets (e.g., innovation and internationalization), and their performances.
The main findings are the following:
- 1,010 academic spin-off companies have been founded in Italy between 1978 and 2013.
- 935 spin-offs (92.3%) have been founded after the introduction of Law 297/1999 (i.e., after 2000).
- On average, the spin-offs in the population are 7 years old (average year of establishment = 2006).
- 97% of spin-offs are established as limited liability entities.
- The majority of companies (53.5%) are established in the North of Italy.
- The most active universities in the creation of spin-offs are Università di Bologna (n = 67), Università di Padova (n = 58), Politecnico di Torino (n = 50), and Politecnico di Milano (n = 40).
- 79% of academic spin-offs operate in the service sector: specifically, offering professional, scientific, and technical services and information and communication services.
- 864 spin-offs were active as of December 31st, 2013. Of these, 152 (17.6%) were registered as innovative start-ups (i.e., responding to the requirements of Law 221/2012).
- As also found in other studies (e.g., Shane, 2004; Spinouts UK, 2014), academic spin-offs are rare entities: only 1.4 out of 10,000 registered companies in Italy are academic spin-offs.
1 We define academic entrepreneurship here as the creation of new businesses based on university-developed knowledge. It includes spin-off companies based on university-assigned intellectual property as well as that not assigned to the institution (Shane, 2004).
- As of 2013, the 812 companies founded between 2000 and 2013 still in operation have an average of 6 shareholders who have contributed with a nominal equity of about 53K/€. Although this value represents only the nominal values of shares, it might be a signal of the low capital available to spin-offs.
- Between 2000 and 2013, on average, the individual shareholders of the spin-offs founded from 2000 to 2013 owned 55% of the company, followed by industrial shareholders (32%), financial institutions (10%), and public institutions (3%). - In time, the relative equity contribution of individual and public shareholders has increased whereas that of financial and industrial shareholders has decreased.
- Spin-offs’ entrepreneurial teams at start up have a high level of human capital in terms of education (46% of individual founders hold a Ph.D.). Founders previously worked either only in academia (38%), only in industry (22%), or both (40%).
- Around 42% of spin-offs are based on patent-related knowledge (i.e., they are assignees of a patent, they are participated by an academic inventor, or both). - 59% of spin-offs collaborate with Universities or Public Research Centers, mainly for training and research activities.
- After 3 years since inception, 58% of spin-offs participate in international markets, mostly targeting exports in European countries.
- Since establishment, 12.3% of the companies failed, 1.2% was acquired or merged, and 1% was transformed to another company.
- From 2000 to 2012, the total revenues produced by spin-offs established between 2000 and 2012 increased constantly, reaching more than 170M/€ in 2012, with an average turnover per company of about 230K/€.
- Since establishment, companies present growing yearly revenues, especially within the first 6 years of existence, during which they also achieve the most significant business-related milestones, such as commercialization on the Italian and foreign markets, employment of personnel, obtaining external financing, patenting or collaboration with other companies.
- There are, however, differences between best- and worst-performing spin-offs in terms of yearly revenues, associated with the geographical location, the sector of activity and the legal form adopted.
The remainder of this report first presents the empirical analyses about Italian academic spin-offs. In particular, four dedicated sections focus on companies’ general characteristics; shareholders and entrepreneurial teams; companies’ innovation and growth strategies; and companies’ performances. The report then highlights some key conclusions and points of discussion for researchers, practitioners, and policymakers. The Appendix provides insights into the TASTE project, illustrates the methodology used to build the TASTE database, and discusses some of the research outcomes achieved thus far.
Empirical analyses
How do the Italian
academic spin-offs
look like?
Companies’ general
characteristics
We start our analyses by considering some key aspects, using secondary data available for each spin-off. Figure 1 presents the year of foundation for the population of 1,010 companies. Beginning in the year 2000, the number of established companies increased, followed by a slight decrease until year 2003, after which it almost doubled every year. The number of firms reported for 2013 is lower than the previous years because the process of data collection generates a lag in the available information for the last 10 months thus, we can consider our data to be reliable on the number of established firms up until the end of 2012. Of the total population considered in our research, 935 spin-offs (92.3%) have been founded after 2000 (i.e., following the new regulatory frameworks released in that period and the subsequent adoption by Universities )2 (see also Bax et al., 2014). During the last decade, the idea of supporting business
start-ups has gained relevance to and attention from policymakers and institutions, as seen in the launch of business-plan competitions, creation of incubators, scientific and technological parks, and granting of financial support from public sources. The number of established academic spin-offs in Italy is comparable to that of United Kingdom3 . In fact, during
the same observation period, about 1,800 spin-offs were founded in the United Kingdom originating at 87 Universities (average per University = 21) and 1,010 spin-offs were founded in Italy at 56 Universities (average per University = 18).
As we will see later, 864 of these companies are still in operation; 146 have ceased to exist for different reasons. Within the population of active firms, at the end of 2013, 152 companies were registered as innovative start-ups at the business registers, taking advantage of the new regulation defined in Law n. 221/20124 . They represent 7.7% of the population
of innovative start-ups. Considering that one of the minimum requirements to be met was of being in operation no more than 4 years, only those companies established after 2009 and still in operation could apply to be entered into the register (i.e., 346 firms). Therefore, the data show that around 44% of the spin-offs established since 2009 adopted this measure.
Figure 1 – Number of spin-off companies by year of establishment
2 Introduction of a new legislation regarding the support of scientific and technological research, knowledge transfer, and mobility for researchers (D. Lgs. 297/1999) and the procedures to obtain the support (D. M. 593/2000).
3 We use data from SpinOuts UK by Young Company Finance - http://www.spinoutsuk.co.uk/
4 Introduction of a new law to support economic growth in Italy with a special focus on entrepreneurship through the introduction of “innovative start-ups” as a new typology of company. Innovative start-ups are characterized by the following criteria: established less than 4 years ago; headquartered in Italy; annual revenues < 5M/€; not distributing profits; active in the development and commercialization of innovative and high-tech products/services; not being born from other companies (e.g., M&A or transformation of other companies); able to certify their innovative activity (e.g., through certain criteria about R&D expenses; level of education of employees; and patenting).
Figure 2 represents the geographical localization of academic spin-off companies in Italy at foundation, using the NUTS 2 classification of territories5 . For firms with more than one office, we used the location of the headquarters. The
majority of companies (53.5%) are established in the North of the country, where we count a greater number of public research bodies and institutions to support business start-up, such as investors, incubators, and accelerators; science and technology parks; co-working spaces; and startup competitions (Italia Startup, 2013). We compared our data to those from other studies regarding innovative or high-tech start-ups (e.g., Italia Startup, 2013; Colombo et al., 2012); in particular, with those regarding innovative start-ups as defined by Law n. 221/2012 registered by December 31st, 2013. As highlighted by the comparison of Figures 2 and 3, it is interesting to note that the number of spin-offs established in Southern Italy is greater than the that of innovative start-ups, denoting a greater vitality of the territories due to the action taken by universities for the creation of companies. To this regard, the tendency for the South of Italy to close the gap with the North in terms of spin-off creation in the last years is also confirmed by the Netval Report 2014 (Bax et al., 2014).
Figure 2 – Localization of academic spin-off companies in Italy
As shown in Figure 4, the Universities in the North of Italy were already more active in the establishment of spin-off companies before the changes in the regulatory environment (1999). In the period 2000-2013, it is interesting to note the strong drop in the number of established firms in the North of Italy from 2008-2009, during which the number of founded firms almost equaled that of the other two macro-areas. This might be explained by the fact that some Universities in the North of Italy (e.g., Università di Bologna) temporarily stopped the process of spin-off creation to update their internal organization and policies on the issue.
They are entitled to access benefits such as tax credits, flexible labor arrangements, and easier access to financial instruments, as described in the documents available at the website of the Ministry of Economic Development – http://www.sviluppoeconomico.gov.it – or at the website of the Italian Chamber of Commerce system – http://startup.registroimprese.it
5 The NUTS classification (Nomenclature of Territorial Units for Statistics) is a hierarchical system for dividing up the economic territory of the EU for the collection, development and harmonization of EU regional statistics and the socio-economic analyses of regions. NUTS 1 distinguish major socio-economic regions (for Italy groups of Regions); NUTS 2 identifies basic regions for the application of regional policies (for Italy the Regions level); NUTS 3 distinguish small regions for specific diagnoses (for Italy the Provinces level) – see http://ec.europa.eu/eurostat/ramon/
Figure 3 – Localization of innovative start-up companies in Italy
In Table 1, we provide a more fine-grained analysis of the presence of spin-off companies in each Italian administrative region, proposing a comparison with the number of innovative start-up companies as defined by Law n. 221/2012 that had been registered by December 31st, 2013.
It is worth investigating what is the relative relevance of academic spin-off companies for the Italian business system. Along these lines, we have compared the number of operating spin-offs to the total number of registered and active firms in Italy on December 31st, 2013. As a further comparison criterion, we compare their relative importance with that of innovative start-ups.
NUTS 2 code REGION NAME SPIN-OFFs START-UPs
N. % N. %
ITC1 Piedmont 90 8.9% 121 8.3%
ITC2 Aosta Valley 0 0.0% 3 0.2%
ITC3 Liguria 37 3.7% 25 1.7%
ITC4 Lombardy 136 13.5% 295 20.2%
ITC Northwestern Italy 263 26.0% 444 30.5%
ITD1-ITD2 Trentino - Alto Adige 14 1.4% 69 4.7%
ITD3 Veneto 71 7.0% 128 8.8%
ITD4 Friuli - Venezia Giulia 58 5.7% 54 3.7%
ITD5 Emilia-Romagna 134 13.3% 161 11.0%
ITD Northeastern Italy 277 27.4% 412 28.3%
NORTH 540 53.5% 856 58.7%
ITE1 Tuscany 96 9.5% 100 6.9%
ITE2 Umbria 29 2.9% 18 1.2%
ITE3 Marche 40 4.0% 63 4.3%
ITE4 Lazio 56 5.5% 146 10.0%
ITE Central Italy 221 21.9% 327 22.4%
CENTER 221 21.9% 327 22.4% ITF1 Abruzzo 21 2.1% 30 2.1% ITF2 Molise 10 1.0% 8 0.5% ITF3 Campania 48 4.8% 70 4.8% ITF4 Apulia 84 8.3% 62 4.3% ITF5 Basilicata 1 0.1% 8 0.5% ITF6 Calabria 25 2.5% 16 1.1%
ITF South Italy 189 18.7% 194 13.3%
ITG1 Sicily 27 2.7% 44 3.0%
ITG2 Sardinia 33 3.3% 37 2.5%
ITG Insular Italy 60 5.9% 81 5.6%
SOUTH 249 24.7% 275 18.9%
ITALY 1,010 100.0% 1,458 100.0%
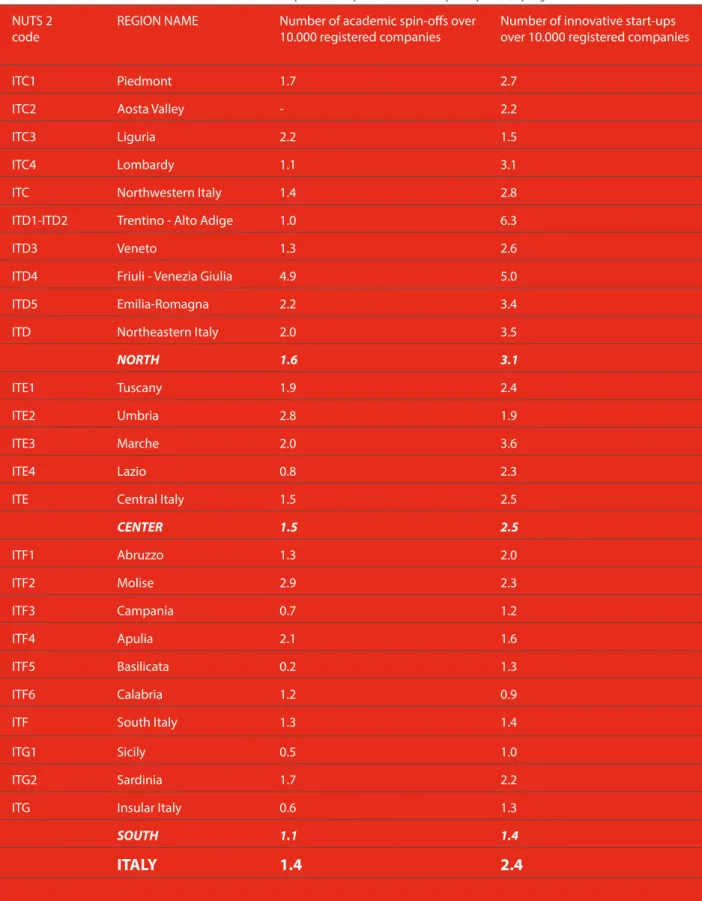
As shown in Table 2, the regions in the North of Italy are the ones with the highest density of academic spin-offs and innovative start-ups over the total number of established companies. Although the highest numbers of academic spin-offs over the total of companies appear in the Friuli–Venezia Giulia (4.9%), Molise (2.9%) and Umbria (2.8%) regions, for innovative start-ups, the highest numbers are in the Trentino–Alto Adige (6.3%), Friuli–Venezia Giulia (5%), and Marche (3.6%) regions. These numbers indicate that both academic spin-offs and innovative start-ups are rare entities. In fact, in Italy only 1.4 and 2.4 companies per 10,000 are academic spin-offs or innovative start-ups, respectively. These findings are in line with other studies (e.g., Shane, 2004; Wright et al., 2007).
NUTS 2
code REGION NAME Number of academic spin-offs over 10.000 registered companies Number of innovative start-ups over 10.000 registered companies
ITC1 Piedmont 1.7 2.7
ITC2 Aosta Valley - 2.2
ITC3 Liguria 2.2 1.5
ITC4 Lombardy 1.1 3.1
ITC Northwestern Italy 1.4 2.8
ITD1-ITD2 Trentino - Alto Adige 1.0 6.3
ITD3 Veneto 1.3 2.6
ITD4 Friuli - Venezia Giulia 4.9 5.0
ITD5 Emilia-Romagna 2.2 3.4
ITD Northeastern Italy 2.0 3.5
NORTH 1.6 3.1
ITE1 Tuscany 1.9 2.4
ITE2 Umbria 2.8 1.9
ITE3 Marche 2.0 3.6
ITE4 Lazio 0.8 2.3
ITE Central Italy 1.5 2.5
CENTER 1.5 2.5 ITF1 Abruzzo 1.3 2.0 ITF2 Molise 2.9 2.3 ITF3 Campania 0.7 1.2 ITF4 Apulia 2.1 1.6 ITF5 Basilicata 0.2 1.3 ITF6 Calabria 1.2 0.9
ITF South Italy 1.3 1.4
ITG1 Sicily 0.5 1.0
ITG2 Sardinia 1.7 2.2
ITG Insular Italy 0.6 1.3
SOUTH 1.1 1.4
ITALY 1.4 2.4
We analyze the number of spin-off companies that originated at each of the public universities. As specified above, a spin-off is affiliated with a university when the institution appears among the equity shareholders of the company, or when one of the employees or research collaborators of the institution is a shareholder of the company. First, when more than one institution participates in a spin-off, it is associated with the institution that owns the majority of equity shares. This is not a common phenomenon in the population. For example, of the 864 active companies in 2013, only 8 companies had more than one university participating. Five out of these 8 companies had participation from universities in the same region. Second, if the shareholders come from different research institutions, the spin-off is associated with the institution of the shareholder with the majority of equity shares. This case seems to be more relevant, signaling that a good percentage of academic entrepreneurs network among research institutions and territories. For example, 13% of the 864 companies active in 2013 had individual shareholders belonging to different universities in the same region; 4% had individual shareholding teams affiliated with universities located in different regions.
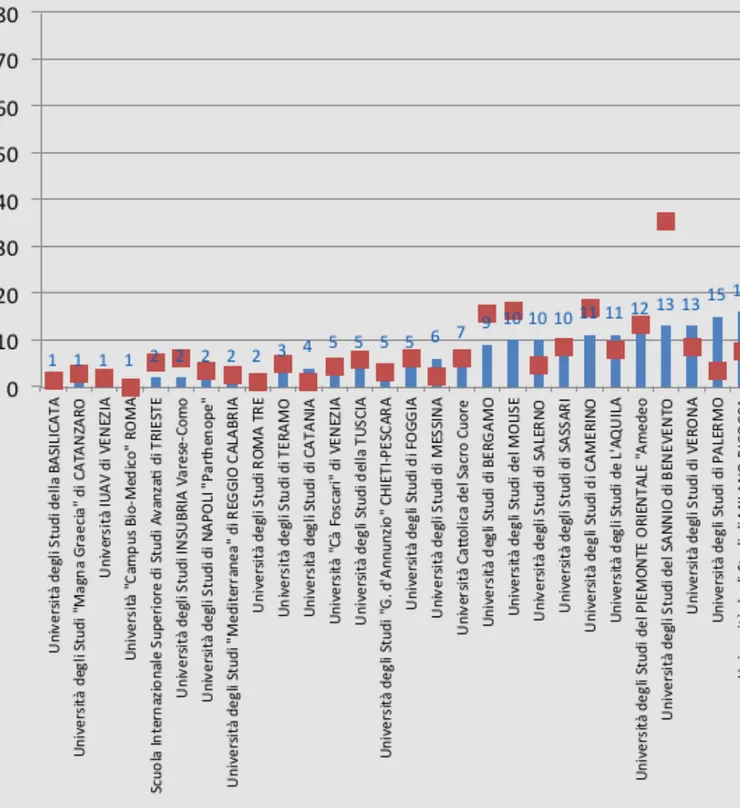
The spin-offs originated from 56 universities. The most active ones are Università di Bologna, Università di Padova, Politecnico di Torino e Politecnico di Milano (similarly to Bax et al., 2014). A different picture, however, appears if we normalize the number of established companies by the number of research staff employed by each university (the number of full, associate, and assistant professors, research fellows, and doctoral students employed between 2001 and 20126 ). As shown in Figure 5, the most productive universities are those with a small but very productive pool of
scientific personnel, such as Scuola Superiore di Sant’Anna (37 spin-offs starting from a research staff of around 320 people per year), Università del Sannio e Benevento (13 spin-offs starting from a research staff of around 230 people per year) or Politecnico delle Marche (29 spin-offs starting from a research staff of around 800 people per year). By contrast, universities with a larger base of research personnel result in relatively lower production of spin-offs, such as Università di Bologna (67 spin-offs starting from a research staff of around 4,600 people) or Università di Padova (58 spin-offs starting from a research staff of around 3,400 people).
6 We used data available from the Ministry of University and Research - http://nuclei.miur.it/sommario/
To date, spin-offs have a legal form characterized by limited liability rather than unlimited liability (see Figure 6) 7. In particular, within the limited liability
setting, the great majority of companies (91%) have a legal form as part of which equity is divided among owners on the basis of shares (s.r.l. - società a responsabilità limitata). Of companies, 3% are public (s.p.a. – società per azioni). To this regard, we verified that the majority (77%) of public companies were established as share-based companies and went through a change in the legal form after foundation. Other companies optioned for a cooperative (2%) or a consortium configuration (1%). Unlimited liability spin-offs were established either by single entrepreneurs (impresa individuale, accounting for 1%) or by two or more owners (s.n.c. – società in nome collettivo, accounting for 1% or by s.a.s - società in accomandita semplice, accounting for 1%). In line with other information on Italian high-tech start-ups (Ministero dello Sviluppo Economico, 2014), those in our sample are more concentrated on service-related activities (79%) rather than manufacturing (18%), commerce (1%), or tourism (2%) (Figure 7). Firms active in manufacturing work in the area of computers, electronics, and optical products (ATECO code 26) and in the production of
machinery (ATECO code 28). In the service field, the majority offers professional, scientific, and technical services (55%): in particular, scientific research and development (ATECO code 72)8 , architectural and engineering activities (ATECO
code 71), management consultancy (ATECO code 70), and other professional, scientific, and technical activities (ATECO code 74). Of the companies, 22% offer information and communication services: specifically, computer programming, consultancy, and related services (ATECO code 62).
Figure 6 – Companies’ legal form
Figure 7 – Companies’ sector of activity
7 For aggregation purposes, taking into account the peculiarities of the Italian legislation about companies and the population of examined spin-offs, we distinguish between limited and unlimited liability legal forms. The following types of company are characterized by shareholders’ limited liability: s.p.a. (società per azioni), s.r.l. (società a responsabilità limitata), soc.coop. (società cooperativa), and consorzio or società consortile. Within the unlimited liability types, we find the following: s.s. (società semplice) or impresa individuale, s.n.c. (società in nome collettivo), and s.a.s. (società in accomandita semplice).
8 We find in this category around 50% of the companies developing services in the field of biotechnology and pharmaceutics, i.e. mainly those not carrying out manufacturing or ICT-related activities.
Who are the shareholders giving life to
academic spin-offs? To what extent do
they contribute to the equity for each
company?
Shareholders and
entrepreneurial teams
Companies are established by a wide range of possible shareholders. We can distinguish between individuals and organizations. Within individuals, we differentiate between academic and non-academic shareholders. Within organizations, we differentiate among three categories: public, financial, and industrial organizations. To make our analyses more meaningful for comparisons, we will focus our attention on the spin-offs established after Law 297/1999 (i.e., starting in 2000).
In terms of quantity, the number of participating shareholders9 , which is linked to the number of established
companies as seen above, has steadily increased since 2000 (see Figure 8a). On average, each company active in 2013 had 6 participating shareholders; in 2000, companies averaged 3 participating shareholders. In absolute numbers, the number of individual owners saw the highest growth during the considered period. In relative terms (see Figure 8b), the percentage of individuals and public institutions in the entrepreneurial teams of companies has increased whereas the number of industrial and financial shareholders has decreased.
Figure 8a – Number of shareholders, by type, per year
We also analyzed the amount of equity invested by shareholders, measured by nominal invested capital. In this regard, as a methodological note, we acknowledge that this is a quite raw measure for evaluating the real degree of capitalization of companies. In fact, the nominal equity is not necessarily related to the amount of total assets, to any other form of invested equity, or to the actual paid value of shares by shareholders. Although we are working to obtain more data for future analyses, at present we can only rely on this information available from the business registers.
As shown in Figure 9a, the amount of invested nominal equity has significantly grown since 2000. In 2013, the average amount of available nominal capital in the form of equity for each active firm was around 53K/€. The value of nominal equity invested by individuals and public shareholders has increased its relative share whereas that of industrial and financial shareholders appears to have shrunk over time until 2008 (see Figure 9b). This trend signals a worrying functioning of the capitalization market of spin-offs. After 2008, the relative shares of nominal equity of each shareholder typology appears stable.
Figure 8b – Relative composition of shareholders, by type, per year
Figure 9b – Relative composition of nominal equity by type of shareholder per year
Individual shareholders
We provide a more fine-grained analysis of the contribution of each category of shareholders. Starting with an
investigation about individual shareholders, as seen above, the number of individual shareholders has steadily increased since 2000. As shown in Figure 10a, academics represent only a minority (on average the 37% for the considered
period)10 . Overall, the amount of nominal capital brought to their companies by individual entrepreneurs has grown
since 2000, reaching a value above 26M/€ in 2013 (see Figure10b). The value of nominal equity financed by non-academic entrepreneurs is significantly higher than that of non-academic entrepreneurs. Over time, the average amount of nominal equity that shareholders have contributed to their companies has decreased (the average nominal equity per individual in 2000 was 8K/€; in 2013, it was 6K/€).
Figure 10a – Number of individual shareholders, by type and year
10 An academic entrepreneur is “an academic whose primary occupation, prior to playing a role in a venture start-up, and possibly concurrent with that process, was that of a lecturer or a researcher affiliated with a Higher Education Institute” (Samson & Gurdon, 1990).
Figure 10b – Nominal equity contribution by individual shareholders, by type and year
Figure 11 – Founders’ highest education level
Entrepreneurial teams at foundation
We explore the composition of entrepreneurial teams at foundation, focusing on the 578 firms established by around 2,300 individuals in the period 2000-2008. Of founders, 79% are male, contributing to 77% of total founding equity. We were able to collect detailed data from the CVs of individual founders and codify information about their education and work experience.
Regarding level of education, we could retrieve no information for 52% of the individuals. For those who disclosed this information on their CVs, we found that they are highly educated, holding either a University (51%), a Master (3%), or a Doctoral (46%) degree (see Figure 11) as the highest education title.
Regarding the previous career of the founders, we could retrieve no information for 49% of the individuals. For founders with available information, the majority (40%) had previous work experience both within academia and industry, followed by founders with experience as academics (38%), and with experience only within the industry (22%) (see Figure 12). Of the founders with academic work experience, 42% are currently holding an academic position. Six percent of the founders report being shareholders of other companies.
Figure 12 – Founders’ work experience
Financial shareholders
Turning our attention to financial shareholders, we distinguish among banks, venture capitalists (VCs), and other private financial bodies. Over time, their number has generally increased, especially since 2003 (Figure 13a). Taking a look at the value of nominal invested equity (Figure 13b) during the period, the largest financial shareholder exited one company in 2006. Starting in 2010, VCs increased
their nominal equity participation. Considering the worldwide development of capital markets, equity participation by financial companies (e.g., investment funds) and venture capitalists is weak. For example, in 2013, financial shareholders’ nominal equity in spin-offs was around 2M/€ whereas individual shareholders’ investment was 26M/€. In general, the “funding gap” in start-ups is present even in well-developed business ecosystems like New York and London (Startup Genome-Telefonica, 2012). However, this represents a serious problem for Italian companies (EVCA, 2012; European Commission, 2012), especially regarding investments from VCs and Business Angels (AIFI, 2012; IBAN, 2012). The average nominal equity contributed by banks and VCs increased over time (the average nominal equity in 2013 invested by each bank was around 23K/€ and by VCs was around 93K/€). The average nominal equity brought by other financial institutions has been more stable over time (on average the nominal equity invested by each financial institution in 2013 was about 48K/€)11 .
Figure 13a – Number of financial shareholders, by type and year
11 The nominal equity values from 2000 to 2006 were influenced by one financial institution participating, with around 3.4M/€, in one spin-off that ceased its operations at the end of 2006.
Figure 13b – Nominal equity contribution by financial shareholders, by type and year
Public shareholders
We analyze the relevance of public organizations as shareholders of spin-offs in the population. We can distinguish among incubators, public bodies (e.g., municipalities, provinces, local development agencies, chambers of commerce), scientific/technological parks, research bodies, universities, and Public Research Centers (PRCs). Between 2000 and 2013, there was generally an increase in the number of all typologies of shareholders. In particular, the number of participating universities showed the most significant increase (Figure 14a) especially after 2003 (i.e., after universities adopted Law 297/1999 and arranged the necessary institutional re-organizations). In terms of nominal invested equity, the value of nominal equity invested by each typology of shareholder has increased (see Figure 14b). In terms of average 2013 nominal equity for each type of investor (in parentheses), public bodies have the highest invested shares (~20K/€), followed by science/technological parks (~8K/€), research bodies (~4K/€), PRCs (~4K/€), universities (~3K/€), and, lastly, incubators (~1K/€).
Figure 14a – Number of public shareholders, by type and year
Figure 15b – Nominal equity contribution by industrial shareholders, per year Figure 15a – Number of industrial shareholders per year
Industrial shareholders
With regard to capital contributed by industrial organizations, the number of industrial shareholders investing in spin-offs has increased steadily over time, reaching more than 500 active shareholders in 2013 (Figure 15a). The amount of nominal invested equity has also increased over time, but with a slower trend after 2008 (Figure 15b). However, the average amount of invested nominal equity per shareholder has shrunk over time.
Companies’ innovation
and growth strategies
Above, we discussed some of the characteristics and performances of public research spin-off companies. In this section, we will look at some of the strategies that managers and researchers generally regard as the most relevant for growth (for a discussion of strategies for Italian start-ups, see also the IV Report RITA by Colombo et al., 2012). First, we investigate the degree of innovative activities performed by these companies. We do this by presenting two datasets: patent data from secondary sources (PATSTAT and PATIRIS) and primary data from the survey administered in 2013 (see Methodological Note in Annex). Second, we investigate the degree of internationalization characterizing the spin-off companies surveyed in 2013.
Innovation
We start our investigation by looking at the extent of innovation of these companies, especially exploring three aspects that we have identified as indicative of the tacit and explicit knowledge available at each company. First, we analyze whether spin-offs began with an entrepreneurial team of inventors. Second, we consider whether the companies are assignees of patents. Third, we analyze the extent of university–firm collaboration.
With regard to the first indicator (i.e., whether spin-offs are founded by any inventor), we proxied the extent of tacit innovative knowledge available to the company. To do this, we retrieved secondary data regarding the patenting activities carried out by inventors of patents assigned to Italian universities from the PATIRIS database12 . We matched,
through a dedicated cleaning and disambiguation, the names of the PATIRIS inventors with the names of the TASTE academic entrepreneurs. In this way, we obtained a list of academic entrepreneurs who were also inventors of patent families assigned to any Italian university. Overall, 277 spin-off companies established between 2000 and 2013 (equal to the 29.6%) were founded by academic entrepreneurs inventors of patents. As shown in Figure 16, l’Università di Padova, the Politecnico di Milano, and the Scuola Superiore di Studi e Perfezionamento (SSUP) Sant’Anna di Pisa were the universities that produced more spin-outs with the participation of academic entrepreneurs who were inventors of patents assigned to Italian public research centers.
What strategies do
spin-off companies adopt to
grow?
With regard to the second innovation indicator that we identified (i.e., the number of patents assigned to each company), we used PATSTAT secondary data. We manually retrieved from the EPO (Espacenet) database13 the patents
for which the spin-offs companies in our population were assignees of patents. We identified a total of 206 spin-off companies founded between 2000 and 2013 (22.3%) that were registered as assignees of 458 published patents in any patent office around the world.
On average, each company published 2.2 patents. In the great majority of cases (88%), the patent was filed and assigned to the company after its foundation. The spin-off companies that were registered as assignees of any patent were especially those affiliated with Università di Milano, Università di Ferrara e Politecnico di Torino (Figure 17). The number of patents published and assigned to spin-off companies increased over time. The patents were mainly filed in single patent offices in Europe (48%, mainly in Italy), followed by the World Patent Office (18%), the European Patent Office (16%), the U.S. Patent Office (12%), or in other countries (5%).
To summarize the above findings, we calculated how many spin-offs were based on patented knowledge. This might be signaled by one of the three following conditions: the spin-off was owned by one or more inventors; the spin-off was an assignee of a patent; or the company was owned by inventors and was also an assignee of a patent. Figure 18 exhibits the rate of occurrence. The reported percentage refers to the spin-offs benefitting from patent-based knowledge (on average, 42% of the spin-offs).
To analyze the third innovation indicator that we identified (i.e., the degree of university–firm collaboration), we used primary data from the survey administered in 2013. Specifically, we investigated to what extent the academic spin-offs in our population engaged in collaboration with universities. In fact, we know that universities are seen as new “engines of growth” in a knowledge-based economy (Etzkowitz et al., 2000) and that the relationships between university and industry constitute a “two-way” exchange in terms of both theoretical and applied knowledge (Meyer-Frahmer & Schmoch, 1998).
Figure 19 – University – spin-offs collaborations The data that we used in this section included a
total of 120 academic spin-offs founded in 2000-2008 that had responded to our survey in 2013. We asked companies to report whether they had any collaboration with universities or PRCs since establishment. As shown in Figure 19, 41% of companies reported that they had never carried out any collaboration with universities or PRCs; 59% had collaborated either with only a university or both a university and a PRC. Furthermore, a more fine-grained analysis of these relationships showed that academic spin-off companies privileged collaborations with their parent institution (83% of cases) rather with other “external” universities. The 71 companies that had had at least one collaboration with universities and PRCs since establishment were asked to describe up to three of the most important collaborations. They reported details about 121 collaborations (108 with universities and 13 with PRCs). On average, the spin-offs started to collaborate with Universities and PRCs 4 years after foundation. From the total reported data, spin-offs dedicated, on average, 4 people for a total of around 255 working hours (32 full working days) to each collaboration with PRCs, and, on average, 2 people for a total of around 455 working hours (57 full working days) to each collaboration with universities. A minority of these collaborations were regulated with legal agreements or formal procedures between the spin-off and the university (44% of cases), while slightly more with PRC (50% of cases).
This, together with the fact that the majority of collaborations were carried out with the parent university, signals a high degree of informality in the relationships between the private and the public subjects involved. Looking at what types of collaborations were activated, we can distinguish between research-based collaborations (e.g., producing new scientific evidence, prototyping/experimentation, attendance at and organization of conferences); consultancy; training (e.g., undergraduate or postgraduate training, training of company’s staff); creation of infrastructures; and participation in grant calls. The 121 collaborations could involve more than one type of relationship (on average, 1.8 types of collaborations). As shown in Figure 20a, academic spin-offs collaborating with PRCs were mostly engaged in research activities (59%). As shown in Figure 20b, academic spin-offs collaborating with universities were, instead, mostly engaged in
training activities (44%, regarding especially training of undergraduate or graduate/postgraduate students), followed then by research-related activities (38%). To some extent, the engagement with universities that the companies disclosed was slightly less oriented to the scientific field if compared to that of other countries in Europe, such as in the UK (see Salter et al., 2010). This characteristic might be linked to the most unstable and uncertain career development tracks in academia in Italy (ISTAT, 2008).
Internationalization
We also relied on the 120 respondents to our 2013 survey to analyze how they approached international markets. Seventy-seven firms (64%) reported being involved in business activities abroad. Only 15% of firms started their business activities contemporaneously in Italy and abroad in the year of foundation; 3 years after inception, 58% worked abroad, and 5 years after inception, 79% were internationalized. The first international activity was either reported as export activity (38%) or a partnership with foreign firms (36%). Few firms reported having licensed to foreign companies (9%) or having a foreign branch (8%). The survey did not investigate how much revenue was generated through activities at the national or international levels, so we are not able to provide any details about the significance of these activities on the revenues of the firms and, by extension, to compare our results with other recent studies on the topic (e.g., Balderi et al., 2011; Colombo et al., 2012). The companies operated, on average, on 2 different world markets (distinguishing between Europe, North America, Central-South America, Middle East, Asia and Africa). As shown in Figure 21, the companies operated mainly on the European (mostly EU but also Eastern and Balcanic countries) and Northern American markets. However, overall, they displayed the ability to reach several other markets around the world.
Figure 20a – Types of collaborations with PRCs Figure 20b – Types of collaborations with Universities
How do academic spin-offs
perform?
Companies’ performances
We will debate this issue by taking into account three possible measures of performance: survival rate, revenues, and reaching milestones.
Survival rate
First, as a measure of performance, we considered whether the companies were still operating or not. Along these lines, we looked at whether the company had ceased to exist. In the total population (n = 1,010), 12.3% of the companies (n = 124) had failed, 1.2% (n = 12) had been acquired or merged, and 1% (n = 10) had ceased to exist in order to be legally transformed to another company. As shown in Figure 22, most of the companies that were founded and then ceased in the subsequent years were established between 2004 and 2007. The number of closed companies per year increased significantly since 2010. The mortality rate14 in the population of spin-offs increased from 1% in 2005 to 4% in 2013,
yet this lower than the mortality rate in the population of Italian companies in the same period, which was around 6% (Unioncamere-Infocamere, 2014)15 .
An analysis of the affiliation of ceased companies show that 61% of companies that went out of operations were in the north of Italy, 21% in the center, and 18% in the south (see details per university in Figure 23). Comparing these numbers with the number of founded companies in each area, we find that the closing rate in the north was 16%, in the center 14% and in the south 11%. However, the motivations for closing were also different in each geographical macro-area. In fact, 75% of M&As and 80% of transformations took place for firms in the north of Italy. Of companies that failed, 58% were northern companies and 20% were southern companies.
Figure 22 – Number of firms founded and ceased, per year
14 Calculated as the number of closed companies over the total of active companies per year.
15 It was possible to compare to Italian high-tech start-ups but only for 2010, thanks to the Report RITA 2012 (Colombo et al., 2012). In 2010, start-ups’ mortality rate was around 5.7%; for academic spin-offs, it was around 2.0%.
Spin-offs that ceased operations mostly operated in professional, scientific, and technical services (58%, mostly linked to scientific R&D and architectural/engineering activities), information and communication technology (17%, mainly involving computer programming, consultancy and related services), or manufacturing of computer, electronic, and optical products (16%).
Annual revenues
To measure performance using the yearly revenues of spin-offs, we integrated all information from the business registers with the Aida–Bureau Van Dijk database. We collected data regarding financial statements of spin-offs established from 2000 to 2012 (n = 921)16 . During the data collection, it was not possible to retrieve data for 90 companies (9.6% of the
population), either because the companies had an unlimited liability legal form or because the companies did not comply with the minimum turnover considered eligible for the inclusion in the Aida database.
Ninety-one spin-offs were closed during the observed period. Furthermore, 2.5% of spin-offs could be understood as inactive; they disclosed annual revenues equal to zero in the last 3 years and the data available from the Chamber of Commerce did not contain information concerning any pending failure, merger, acquisition or transformation.
During the period 2000-2012, the total revenues produced by the companies increased constantly (see Figure 24). However, in the period 2008-2011 the total revenue growth was slower than in previous periods, notwithstanding the growth in the number of operating companies. The shrinking in the financial performances during this period is in line with other studies on high-tech start-ups reporting the effects of the economic crisis (Colombo et al., 2012). When examining the average annual revenues per company, the same trend can be described. Although until 2008 the average financial turnover produced by the companies increased, during the period 2008-2011 the companies’ revenues were substantially lower than in previous years, appearing then to increase again in 2012.
We analyzed annual revenues since spin-off establishment (Figure 25). Considering the average year of establishment of the investigated companies, it is interesting to note that the older the companies are, the higher the revenues obtained every year after establishment. We distinguish between the average annual revenues for all firms and for the highest, the median, and the lowest quartiles of revenues.
Figure 24 – Total annual revenues and average revenues per spin-off, by year
It is worth understanding the characteristics of “best performers” (i.e., the companies in the highest revenue quartile) and “worst performers” (i.e., the companies in the lowest revenue quartile). We analyze the spin-offs established between 2000 and 2012 and classify them into best, median, and worst performers on the basis of the last year of available revenue information (e.g., in the case of closed firms, the revenue quartile of the last year of operations; in the case of active firms, the revenue quartile in 2012).
First, some observations about survival rates. Of firms that had ceased operations, 68% were among the worst performers whereas 9% of ceased firms were among the best performers. To distinguish the motivation for stopping operations (see Figure 26), 71% of companies that failed were worst performers as opposed to 8% of best performers. In the same manner, 80% of acquired or merged companies were worst performers. By contrast, firms that were transformed were either median performers (67%) or best performers (33%).
Figure 25 – Annual revenues and average annual revenues per company, since year of establishment
We then consider the relationship between some key firms’ characteristics and their performance in terms of revenues, focusing on active companies. Starting with the legal form chosen by companies, we see that among public companies, 46% are best performers. By contrast, 33% of unlimited liability companies are worst performers (Figure 27).
Figure 27 – Companies’ legal form, by revenue percentile
Looking at the geographical location of spin-offs, best-performers are mainly located in the North of Italy whereas companies in the South of Italy are characterized by the worst performances (Figure 28).
Figure 28 – Companies’ localization, by revenue percentile
To analyze the sector of activity of spin-offs, there were slight differences between best and worst performers in regard to ICT-related activities. Best-performers tended to be more present in manufacturing sectors. Worst-performers, instead, dominated the professional and technical services, other services, and commercial activities (Figure 29).
Looking at the degree of innovation of spin-offs in terms of patent-related knowledge (i.e., whether the spin-off had an inventor in the entrepreneurial team; the spin-off was the assignee of a patent; or both), there seems to be no evident link with performance measured by revenues. In fact, we observed 20% of best-performers among the non-patent based companies and 21% of best-performers in the patent-based spin-offs. A similar trend is observed for worst-performers (Figure 30).
Figure 29 – Companies’ sector, by revenue percentile
Milestones
We analyze which milestones spin-off companies reach during their lives, relying on the 120 respondents to our 2013 survey (see Figure 31)17 . One year after inception, companies started their commercial activity in Italy. Two years after
inception, they started to employ personnel, obtain the first institutional financing (e.g., bank loans, venture capital, etc.), and collaborate with other firms in Italy. In the period between the third and the fourth year after inception, companies presented the first application for a patent and take the first steps in international markets, such as carrying out the first export and starting the first collaboration with a foreign company. Six years after inception, some companies were able to open an office abroad.
Figure 31 – Time for reaching critical milestones and companies’ performance, since establishment
It is interesting to note that both the ability to reach these milestones and the timing of doing so differed among companies on the basis of performance. In particular, worst (vs. best) performers required almost 2 years (vs. less than 1 year) to accomplish their first sale in Italy and 3.5 years (vs. less than 2 years) for their first sale abroad. On the same token, it took 2 years for worst performers (vs. 6 months for best) to start a collaboration with an Italian company and 5.25 years (vs. 1.5 years) to start a collaboration with a foreign company. They started to employ personnel 3 years (vs. less than 1 year) after inception. None of the worst-performers (vs. all of best-performers) who responded to our survey had opened an office abroad.
A long and in-depth effort of data collection has been carried out within the TASTE project to obtain detailed information about academic entrepreneurship in Italy. The key results briefly disclosed in this report suggest several points worthy of discussion for policymakers, entrepreneurs, managers, and researchers.
First, we have seen that the phenomenon of academic entrepreneurship - measured as the creation of companies based on academic research, and thus directly
involving academic institutions or scientists - does not present in large numbers. Academic spin-offs certainly do not represent the largest share of operating businesses in Italy and other countries (e.g., UK or USA) in the way that innovative, technology-based start-ups do. Furthermore, our narrow definition of academic spin-offs does not account for the development of student- or alumni-owned companies, which represent a growing phenomenon around the world (SpinOuts, 2014). Given the increasing numbers of these companies and the fact that some might originate from academic knowledge developed by students during their coursework or while writing graduation thesis (Almalaurea, 2013), it would be important to track them in order to have a better understanding of the real contribution of science to technological development. This would further highlight the role of universities as hubs for the development of new ideas, new technologies, new forms of business engagement, and, ultimately, cultural, social, and economic growth.
Second, on average, these companies presented a limited degree of nominal capital and annual revenues. This is a characteristic that has been highlighted by other studies of academic spin-offs in Italy (e.g., Bax et al., 2014; Balderi et al., 2011). However, there is a need to distinguish between different categories and to reflect on the characteristics of the best and worst performers. In the same vein, it is worrying that, over time, the capital brought by financial, public, and industrial shareholders has diminished whereas the capital from individual shareholders has increased. Although this suggests a structural problem relative to the organization of equity markets in Italy, we need to develop a greater understanding of how this situation could be improved.
Third, when analyzing companies’ performances, we observed that the Italian population of academic spin-offs was characterized by a low share of mergers and acquisitions. Furthermore, our analyses showed that both failures and M&As were among the worst-performing companies. It is worth noticing that the failure rates of these companies were relatively low if compared with other data about failure rates in innovative start-ups. Therefore, we might see this as both a source of future opportunities but also as a critical characteristic of the Italian system.
As a last important point, we have shown that these firms were characterized by high levels of human capital, presence of patent-related knowledge, and international proactiveness. They were able to grow quickly during the first 6 years after
establishment, reaching critical milestones such as entering Italian and international markets, starting collaborations with Italian and foreign companies, and/or applying for patent publications.
How do academic spin-offs
per-References
AIFI (2012), Il mercato italiano del Private Equity e Venture Capital nel 2012, Associazione italiana del private equity e venture capital, available at http://www.aifi.it/IT/PDF/Statistiche/IlmercatoitalianodelPEeVC2012.pdf.
Almalaurea (2013), XV Indagine (2013) - Profilo dei Laureati 2012, Bologna: Consorzio Interuniversitario Almalaurea, available at http://www.almalaurea.it/sites/almalaurea.it/files/docs/universita/profilo/profilo2013/volume_completo.pdf. Balderi, C., Patrono, A., & Piccaluga, A. (2011), La ricerca pubblica e le sue perle: le imprese spin-off in Italia, Quaderni dell’Istituto di Management, 1/2011, Pisa: Scuola Superiore di Sant’Anna.
Baldini, R., Fini R., & Grimaldi R. (2014). The transition towards entrepreneurial universities: an assessment of academic entrepreneurship in Italy, in Al Link, Don Siegel, and Mike Wright, Handbook on Technology Transfer, Chicago: University of Chicago, forthcoming.
Bax, A., Corrieri, S., Daniele, C., Guarnieri, L., Parente, R., Piccaluga, A., Ramaciotti, L., & Tiezzi, R. (2014), Unire i puntini per completare il disegno dell’innovazione, Netval – Network per la Valorizzazione della Ricerca Universitaria, available at http://www.netval.it/contenuti/file/Rapporto%20Netval%202014.pdf.
Colombo, M. G., Quas, A., & Guerini, M. (2012), IV rapporto RITA, Milano: Dipartimento di Ingegneria Gestionale, Politecnico di Milano.
Etzkowitz, H., Webster, A., Gebhardt, C., & Terra, B. (2000), The future of the university and the university of the future: evolution of ivory tower to entrepreneurial paradigm, Research Policy, 29(2), 313-330.
European Commission (2012), Small Business Act, available at http://ec.europa.eu/enterprise/policies/sme/facts-figures-analysis/performance-review/files/countriessheets/2012/italy_it.pdf.
EVCA (2012), Pan-European Private Equity and Venture Capital Activity, available at http://www.evca.eu/uploadedfiles/ home/knowledge_center/evca_research/2012_Pan-European_PE&VC_Activity.pdf.
Fini, R., Lacetera, N., & Shane, S. (2010). Inside or outside the IP system? Business creation in academia. Research Policy, 39(8), 1060-1069.
IBAN (2012), Sintesi Survey 2012, Il mercato italiano del capitale di rischio informale, Italian Business Angel Network, available at http://www.iban.it/Sintesi_Survey_2012.pdf.
ISTAT (2008), La ricerca e sviluppo in Italia. Anno 2008, Statistiche in breve, 1-8, available at http://www.istat.it/it/ archivio/3890.
Italia Startup (2013), The Italian Startup Ecosystem: “Who’s Who”, available at http://www.italiastartup.it/whoiswho/. Kauffman Foundation (2010), The Importance of Startups in Job Creation and Job Destruction, Kauffman Foundation Research Series: Firm Formation and Economic Growth, T. Kane, Ewig Marion Kauffman Foundation, available at http://www.kauffman.org/~/media/kauffman_org/research%20reports%20and%20covers/2010/07/firm_formation_ importance_of_startups.pdf.
Meyer-Frahmer, F., & Schmoch, U. (1998), Science-based technologies: university-industry interactions in four fields, Research Policy, 27, 835-851.
Ministero dello Sviluppo Economico (2014), Relazione al Parlamento sullo stato di attuazione della normativa a sostegno dell’ecosistema delle startup innovative, available at http://www.sviluppoeconomico.gov.it/images/stories/documenti/ Relazione_Ministro_policy_startup_ver_10_marzo.PDF.
OECD (2013), Science, Technology and Industry Scoreboard 2013, OECD Publishing, available at http://www.oecd-ilibrary. org/docserver/download/9213051e.pdf?expires=1402048072&id=id&accname=guest&checksum=6BD024DDE22D32B4 C0B098F6A6074570.
Salter, A., Tartari, V., D’Este, P., & Neely, A. (2010), The Republic of Engagement – Exploring UK Academic attitudes to collaborating with Industry and Entrepreneurship, London: Advanced Institute of Management Research (AIM).
How do academic spin-offs
per-Samson, K. J., & Gurdon, M. A. (1990), University scientists as entrepreneurs: a special case of technology transfer and high technology venturing”, Technovation, 13(2), 63-71.
Shane, S. A. (2004), Academic entrepreneurship: University spinoffs and wealth creation, Cheltenham: Edward Elgar Publishing.
SpinOuts (2014), Spinouts 2014 Quarterly Journal – News, comments and analysis on Spinouts from UK HEIs, Issue 11, April 2014, available at http://www.spinoutsuk.co.uk/Downloads/Spinouts_UK_Quarterly_Journal_April_2014.pdf. Startup Genome & Telefonica (2012), Startup Ecosystem Report 2012 – Part One, available at http://multisite-blog.digital. telefonica.com.s3amazonaws.com/wp-content/uploads/2013/01/Startup-Eco_14012013.pdf.
Unioncamere-Infocamere (2014), Movimprese – Natalità e mortalità delle imprese italiane registrate presso le camere di commercio, press release, January 22, 2014, available at www.unioncamere.gov.it/download/3074.html.
Wright M., Clarysse B., Mustar P., & Lockett A. (2007), Academic Entrepreneurship in Europe, Cheltenham: Edward Elgar Publishing.
How do academic spin-offs
per-Appendix
Methodological note
The aim of the TASTE project is to determine how knowledge transfer unfolds from academic institutions and to what extent this activity benefits individuals, firms, and public wealth.
The research is carried out at the Department of Management of UNIBO. It is managed by Dr. Riccardo Fini, and involves Dr. Daniela Bolzani, Prof. Rosa Grimaldi, Prof. Gian Luca Marzocchi and Ms. Eleonora Veglianti, under the scientific mentorship of Prof. Maurizio Sobrero. The project also brings together researchers from world-class institutions: Prof. Timothy Folta (University of Connecticut), Dr. Antonio Giuliani (University of Illinois Chicago), Prof. Einar Rasmussen (Bodo University), Dr. Simone Santoni (Cass Business School London), and Prof. Mike Wright (Imperial College London). The project TASTE builds on a long-lasting research program that was started in 2003 with the Project IRIS (Italian Research on Innovation Systems – PI: Maurizio Sobrero), hosted by the Department of Management of the University of Bologna, financed under the Italian FIRB program. In 2008, the Observatory of Science-Based Spin-Offs in Emilia Romagna (OSIRIDE) was created and, since then, updated on a yearly basis. These efforts converged into the TASTE project (2012-2016).
The TASTE database is one of the outcomes of the project. The TASTE database is relational and multilevel in nature and has systematically collected information on the population of 95 Italian universities, and their personnel, internal policies, departments, patenting and spinout activities, and the characteristics and entrepreneurial support mechanisms of the 20 Italian regions. The available data start in 2000 and cover up to 2013 . The database is updated annually. Data have been gathered from several sources, as detailed below.
Domain Level Type Description Records Timespan Data Source
University Organizational Secondary University character-istics and perfor-mance
95 2000 – 2013 MIUR Website
http://nuclei.miur.it/sommario/
University Organizational Secondary TTO characteristics 95 2001 – 2011 MIUR Website
http://nuclei.miur.it/sommario/
University Organizational Primary/
Secondary TTO personnel professionalization
95 2003 – 2012 Netval
www.netval.it
University Organizational Secondary University research
eminence 95 2000 – 2011 Censis
http://www.censis.it/
University Policy Primary/
Secondary Spin-off, patent and external engage-ment policies
336 1981 – 2013 University websites, research offices, central administra-tion
University Individual Secondary University-employed
research personnel 75,000 2000 – 2012 MIUR Website
http://cercauniversita.cineca.it/php5/docenti/cerca.php
University Individual Secondary Faculty members’
CVs 60,000 2012 MIUR Website
http://abilitazione.miur.it/public/index.php
University Patent Secondary Italian patent-fami-lies assigned to Pub-lic Research Centers and Universities
3,326 1990 –2013 PATIRIS – Orbit
http://patiris.uibm.gov.it/home
University Patent Secondary European patents invented by Italian academics
7,675 1971 –2013 APE-INV – Espacenet
http://www.esf-ape-inv.eu/
Firm Organizational Secondary Operational charac-teristics (e.g., year of incorporation, industry)
1,010 1978 – 2013 Italian Company’s House
https://telemaco.infocamere.it/
Firm Organizational Secondary Performance 1,010 1990 – 2013 AIDA database
How do academic spin-offs
per-Domain Level Type Description Records Timespan Data Source
Firm Organizational Secondary Patents 1,010 2000 – 2013 PATSTAT – EPO database http://epo.org
Firm Organizational Primary Business models, collaboration activi-ties, internationaliza-tion
578 2009 and 2013 Two survey waves sent out in 20091 and 20132 to the
same cohort of 578 companies established between 2000 and 2008; 196 answered the first wave (response rate = 33.9%), and 120 in 2013 (n. closed companies = 111; response rate = 25.8%).
Firm Individual Secondary Gender, age, ownership, and directorship(s)
3,300 1990 – 2013 Italian Company’s House
https://telemaco.infocamere.it/
Firm Individual Secondary Career path, human and social capital, education
2,500 1973 – 2013 Firms’ websites, Linkedin, Xing, Vidaeo, Academia.edu, and Facebook
Context Regional Secondary Regional munifi-cence, public expen-ditures for R&D, credit availability
20 2000 – 2011 Eurostat
http://epp.eurostat.ec.europa.eu
Context Regional Secondary Regional innovative
performance 20 2004 – 2011 PRO INNO EU
www.proinno-europe.eu
How do academic spin-offs
per-The TASTE research team has also activated stable, long-lasting collaborations with two other research groups that are involved in similar projects at Imperial College London (UK) and Bodo University (Norway). In particular, with Prof. Markus Perkmann, principal investigator of the TRIC Project at Imperial College London (http://wwwf.imperial.ac.uk/ blog/tric/), which focuses on the impact that science delivered at ICL has on industry and practice. With Prof. Einar Rasmussen, principal investigator of the FORNY Project at Bodo University, which focuses of the evolution of academic spin-outs in Norway. Both projects adopted multi-level population-based approaches.
Below we list the published research that uses the data stored into the TASTE database.
Articles in international refereed journals
• Baldini, R., Fini R., Grimaldi R., & Sobrero M. (2014), Organisational change and the institutionalisation of university patenting activity in Italy. Minerva, 52(1), 27-53;
• Fini, R., Grimaldi, R., Marzocchi, G. L., & Sobrero, M. (2012), The determinants of corporate entrepreneurial intention within small and newly established firms, Entrepreneurship Theory and Practice, 36(2), 387-414;
• Fini, R., Grimaldi, R., Santoni, S., & Sobrero, M. (2011), Complements or substitutes? The role of universities and local context in supporting the creation of academic spin-offs, Research Policy, 40(8), 1113-1127;
• Fini, R., Grimaldi, R., & Sobrero, M. (2009). Factors fostering academics to start up new ventures: an assessment of Italian founders’ incentives, The Journal of Technology Transfer, 34(4), 380-402.
International book chapters
• Baldini, R., Fini R., & Grimaldi R. (2014). The transition towards entrepreneurial universities: an assessment of academic entrepreneurship in Italy, in Al Link, Don Siegel, and Mike Wright, Handbook on Technology Transfer, Chicago: University of Chicago, forthcoming.
• Fini R., & Grimaldi R. (2007), Academic Founders and Business Opportunity Generation: an Empirical Analysis based on Italian Academic Spin-offs, in Dowling M., Schmude J., Empirical Entrepreneurship in Europe: New Perspectives, pp. 177-197, Edward Elgar. ISBN: 9781847202123.
National publications (in Italian)
• Fini R. (2010). The micro-foundation of entrepreneurial dynamics, Economia e Politica Industriale – Journal of Industrial and Business Economics, 37(2), 147-170.
• Fini R., Grimaldi R., & Zanoni A. (2009), L’impreditorialità generata dalla ricerca pubblica nei settori ad alta tecnologia, in Cassia L., Kalchschmidt M., Paleari S., L’imprenditorialità. Pensiero, elementi, contesto, Bergamo University Press, ISBN: 978-88-95184-99-9.
Reports and Policy-making
• Fini R., Grimaldi R., & Sobrero M. (2008), OSIRIDE, l’osservatorio degli Spin-off della ricerca della regione Emilia Romagna, Technical report, Department of Management, University of Bologna, available at http://ssrn.com/abstract=2281741.